 Email
Email Print
Print


Surge Protection Device Market - Forecast(2024 - 2030)
Most of the industries today are tending towards automation to reduce time, increase productivity and cut down the costs. This has led to produce more electronic based devices. There has also been a drastic increase in home automation which focuses more and more on electronic devices being integrated for common operations. Most of the microprocessor based electronic devices need power protection to function at ease and avoid issues poised by power fluctuations and this has been ignored due to low awareness of surge protection devices.
Surge protection devices allow multiple components to plug into a single power socket. A power surge is a significant increase in voltage above the designated level. If power voltage rises above the standard voltage, it is likely to damage the electronic equipment. The increase in the usage of electrical equipment such as personal computers, microwaves, washing machines and alarms are amplifying the demand for surge protection devices globally.
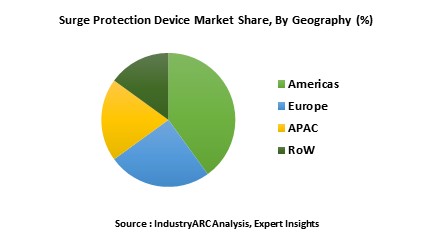
SPD`s market has set the highest growth record in America currently. Market for SPD`s is expected to upsurge in APAC and Europe by 2023. The market for SPD`s has been analyzed by every region which includes Americas, Europe, APAC and RoW.
Surge protection devices market is expected to experience significant growth in the coming years due to the increasing demand by end users such as residential, industries, commercial, medical, telecommunication, data centers and others. Surge protection devices are classified into three types, namely: Type 1, Type 2, Type 3 and others and protection types are classified into Line to Neutral, Neutral to Ground, Line to Ground.
In this report, the SPD`s are further segmented into Power rating, Applications and Geography.
The report contains detailed and in-depth analysis of the segmentation of the Surge Protection Devices market.
1. Surge Protection Device – Market Overview
2. Executive Summary
3. Surge Protection Device – Market Landscape
3.1. Market Share Analysis
3.2. Comparative Analysis
3.2.1. Product Benchmarking
3.2.2. End user profiling
3.2.3. Patent Analysis
3.2.4. Top 5 Financials Analysis
4. Surge Protection Device – Market Forces
4.1. Market Drivers
4.2. Market Constraints
4.3. Market Challenges
4.4. Attractiveness of the Uninterruptible Power Supply Industry
4.4.1. Power of Suppliers
4.4.2. Power of Customers
4.4.3. Threat of New entrants
4.4.4. Threat of Substitution
4.4.5. Degree of Competition
5. Surge Protection Device Market– Strategic Analysis
5.1. Value Chain Analysis
5.2. Pricing Analysis
5.3. Opportunities Analysis
5.4. Product/Market Life Cycle Analysis
5.5. Suppliers and Distributors
6. Surge Protection Device Market – By Protection Type
6.1. Introduction
6.2. Line to Neutral
6.3. Neutral to Ground
6.4. Line to Ground
6.5. By Type
7. Surge Protection Device Market – By ANSI/ UL Type
7.1. Introduction
7.2. Type 1 (Permanently connected, Hardwired)
7.3. Type 2 (Permanently connected, Hardwired)
7.4. Type 3 (Point of Utilisation)
7.5. Type 4 (component recognised)
7.6 Type 5 (component recognised)
7.7. Type 1, Type 2 or Type 3 component assembly SPD (component recognised)
8. Surge Protection Device Market – By Type
8.1. By Power Rating Mode
8.1.1. 0-50 kA
8.1.2. 50.1-100 kA
8.1.3. 100.1-200 kA
8.1.4. 200.1 kA and Above
8.1.5. By Discharge Current
8.2. By Discharge Current
8.2.1 < 10 kA
8.2.3 >10 kA to 25 kA
8.2.4. >25 kA
9. Surge Protection Device Market – By Component
9.1. Metal Oxide Varistor
9.2. Gas Discharge Tube
9.3. Silicon Avalanche Diode
9.4. Others
10. Surge Protection Device Market – By End User Industry
10.1. Introduction
10.2. Residential (HVAC, UPS, power, etc.)
10.3. Commercial (HVAC, UPS, Security systems, power etc.)
10.5. Medical (Devices, etc.)
10.6. Telecommunication
10.7. Data Center
10.8. Transportation
10.9. Agriculture
10.10. Oil.& Gas
10.11. Power (Wind, Solar etc.)
10.12. Logistics & Automotive
10.13. Pulp & Paper
10.14. Others
11. Surge Protection Device - Geographic Analysis
11.1. Introduction
11.2. Americas
11.2.1. U.S.
11.2.2. Canada
11.2.3. Brazil
11.2.4. Mexico
11.2.5. Argentina
11.2.6. Venezuela
11.3. Europe
11.3.1. U.K.
11.3.2. Germany
11.3.3. France
10.3.4. Italy
10.3.5. Denmark
10.3.6. Netherlands
10.3.7. Spain
11.3.8. Others
11.4. APAC
11.4.1. China
11.4.2. South Korea
11.4.3. Japan
11.4.4. India
11.4.6 Taiwan
11.4.5. Others
11.5. ROW
11.5.1. Middle East
11.5.2. Africa
11.5.3. Others
12. Market Entropy
12.1. New Product Launches
12.2. M&As, Collaborations, JVs and Partnerships
13. Company Profiles
13.1. Company 1
13.2. Company 2
13.3. Company 3
13.4. Company 4
13.5. Company 5
13.6. Company 6
13.7. Company 7
13.8. Company 8
13.9. Company 9
13.10. Company 10
13.11. Company 11
*More than 20 Companies are profiled in this Research Report*
"*Financials would be provided on a best efforts basis for private companies"
14. Appendix
14.1. Abbreviations
14.2. Sources
14.3. Research Methodology
14.4. Bibliography
14.5. Disclaimer
List of Table s:
Table 1: Surge Protection Device Market Overview 2021-2026
Table 2: Surge Protection Device Market Leader Analysis 2018-2019 (US$)
Table 3: Surge Protection Device Market Product Analysis 2018-2019 (US$)
Table 4: Surge Protection Device Market End User Analysis 2018-2019 (US$)
Table 5: Surge Protection Device Market Patent Analysis 2013-2018* (US$)
Table 6: Surge Protection Device Market Financial Analysis 2018-2019 (US$)
Table 7: Surge Protection Device Market Driver Analysis 2018-2019 (US$)
Table 8: Surge Protection Device Market Challenges Analysis 2018-2019 (US$)
Table 9: Surge Protection Device Market Constraint Analysis 2018-2019 (US$)
Table 10: Surge Protection Device Market Supplier Bargaining Power Analysis 2018-2019 (US$)
Table 11: Surge Protection Device Market Buyer Bargaining Power Analysis 2018-2019 (US$)
Table 12: Surge Protection Device Market Threat of Substitutes Analysis 2018-2019 (US$)
Table 13: Surge Protection Device Market Threat of New Entrants Analysis 2018-2019 (US$)
Table 14: Surge Protection Device Market Degree of Competition Analysis 2018-2019 (US$)
Table 15: Surge Protection Device Market Value Chain Analysis 2018-2019 (US$)
Table 16: Surge Protection Device Market Pricing Analysis 2021-2026 (US$)
Table 17: Surge Protection Device Market Opportunities Analysis 2021-2026 (US$)
Table 18: Surge Protection Device Market Product Life Cycle Analysis 2021-2026 (US$)
Table 19: Surge Protection Device Market Supplier Analysis 2018-2019 (US$)
Table 20: Surge Protection Device Market Distributor Analysis 2018-2019 (US$)
Table 21: Surge Protection Device Market Trend Analysis 2018-2019 (US$)
Table 22: Surge Protection Device Market Size 2018 (US$)
Table 23: Surge Protection Device Market Forecast Analysis 2021-2026 (US$)
Table 24: Surge Protection Device Market Sales Forecast Analysis 2021-2026 (Units)
Table 25: Surge Protection Device Market, Revenue & Volume, By Type, 2021-2026 ($)
Table 26: Surge Protection Device Market By Type, Revenue & Volume, By By Power Rating Mode, 2021-2026 ($)
Table 27: Surge Protection Device Market By Type, Revenue & Volume, By By Discharge Current, 2021-2026 ($)
Table 28: Surge Protection Device Market, Revenue & Volume, By Protection Type, 2021-2026 ($)
Table 29: Surge Protection Device Market By Protection Type, Revenue & Volume, By Line to Neutral, 2021-2026 ($)
Table 30: Surge Protection Device Market By Protection Type, Revenue & Volume, By Neutral to Ground, 2021-2026 ($)
Table 31: Surge Protection Device Market By Protection Type, Revenue & Volume, By Line to Ground, 2021-2026 ($)
Table 32: Surge Protection Device Market By Protection Type, Revenue & Volume, By By Type, 2021-2026 ($)
Table 33: Surge Protection Device Market, Revenue & Volume, By Component, 2021-2026 ($)
Table 34: Surge Protection Device Market By Component, Revenue & Volume, By Metal Oxide Varistor, 2021-2026 ($)
Table 35: Surge Protection Device Market By Component, Revenue & Volume, By Gas Discharge Tube, 2021-2026 ($)
Table 36: Surge Protection Device Market By Component, Revenue & Volume, By Silicon Avalanche Diode, 2021-2026 ($)
Table 37: Surge Protection Device Market, Revenue & Volume, By By ANSI/ UL Type, 2021-2026 ($)
Table 38: Surge Protection Device Market By By ANSI/ UL Type, Revenue & Volume, By Type 1 (Permanently connected, Hardwired), 2021-2026 ($)
Table 39: Surge Protection Device Market By By ANSI/ UL Type, Revenue & Volume, By Type 2 (Permanently connected, Hardwired), 2021-2026 ($)
Table 40: Surge Protection Device Market, Revenue & Volume, By End User Industry, 2021-2026 ($)
Table 41: Surge Protection Device Market By End User Industry, Revenue & Volume, By Residential (HVAC, UPS, power, etc.), 2021-2026 ($)
Table 42: Surge Protection Device Market By End User Industry, Revenue & Volume, By Commercial (HVAC, UPS, Security systems, power etc.), 2021-2026 ($)
Table 43: Surge Protection Device Market By End User Industry, Revenue & Volume, By Medical (Devices, etc.), 2021-2026 ($)
Table 44: Surge Protection Device Market By End User Industry, Revenue & Volume, By Telecommunication, 2021-2026 ($)
Table 45: Surge Protection Device Market By End User Industry, Revenue & Volume, By Data Center, 2021-2026 ($)
Table 46: North America Surge Protection Device Market, Revenue & Volume, By Type, 2021-2026 ($)
Table 47: North America Surge Protection Device Market, Revenue & Volume, By Protection Type, 2021-2026 ($)
Table 48: North America Surge Protection Device Market, Revenue & Volume, By Component, 2021-2026 ($)
Table 49: North America Surge Protection Device Market, Revenue & Volume, By By ANSI/ UL Type, 2021-2026 ($)
Table 50: North America Surge Protection Device Market, Revenue & Volume, By End User Industry, 2021-2026 ($)
Table 51: South america Surge Protection Device Market, Revenue & Volume, By Type, 2021-2026 ($)
Table 52: South america Surge Protection Device Market, Revenue & Volume, By Protection Type, 2021-2026 ($)
Table 53: South america Surge Protection Device Market, Revenue & Volume, By Component, 2021-2026 ($)
Table 54: South america Surge Protection Device Market, Revenue & Volume, By By ANSI/ UL Type, 2021-2026 ($)
Table 55: South america Surge Protection Device Market, Revenue & Volume, By End User Industry, 2021-2026 ($)
Table 56: Europe Surge Protection Device Market, Revenue & Volume, By Type, 2021-2026 ($)
Table 57: Europe Surge Protection Device Market, Revenue & Volume, By Protection Type, 2021-2026 ($)
Table 58: Europe Surge Protection Device Market, Revenue & Volume, By Component, 2021-2026 ($)
Table 59: Europe Surge Protection Device Market, Revenue & Volume, By By ANSI/ UL Type, 2021-2026 ($)
Table 60: Europe Surge Protection Device Market, Revenue & Volume, By End User Industry, 2021-2026 ($)
Table 61: APAC Surge Protection Device Market, Revenue & Volume, By Type, 2021-2026 ($)
Table 62: APAC Surge Protection Device Market, Revenue & Volume, By Protection Type, 2021-2026 ($)
Table 63: APAC Surge Protection Device Market, Revenue & Volume, By Component, 2021-2026 ($)
Table 64: APAC Surge Protection Device Market, Revenue & Volume, By By ANSI/ UL Type, 2021-2026 ($)
Table 65: APAC Surge Protection Device Market, Revenue & Volume, By End User Industry, 2021-2026 ($)
Table 66: Middle East & Africa Surge Protection Device Market, Revenue & Volume, By Type, 2021-2026 ($)
Table 67: Middle East & Africa Surge Protection Device Market, Revenue & Volume, By Protection Type, 2021-2026 ($)
Table 68: Middle East & Africa Surge Protection Device Market, Revenue & Volume, By Component, 2021-2026 ($)
Table 69: Middle East & Africa Surge Protection Device Market, Revenue & Volume, By By ANSI/ UL Type, 2021-2026 ($)
Table 70: Middle East & Africa Surge Protection Device Market, Revenue & Volume, By End User Industry, 2021-2026 ($)
Table 71: Russia Surge Protection Device Market, Revenue & Volume, By Type, 2021-2026 ($)
Table 72: Russia Surge Protection Device Market, Revenue & Volume, By Protection Type, 2021-2026 ($)
Table 73: Russia Surge Protection Device Market, Revenue & Volume, By Component, 2021-2026 ($)
Table 74: Russia Surge Protection Device Market, Revenue & Volume, By By ANSI/ UL Type, 2021-2026 ($)
Table 75: Russia Surge Protection Device Market, Revenue & Volume, By End User Industry, 2021-2026 ($)
Table 76: Israel Surge Protection Device Market, Revenue & Volume, By Type, 2021-2026 ($)
Table 77: Israel Surge Protection Device Market, Revenue & Volume, By Protection Type, 2021-2026 ($)
Table 78: Israel Surge Protection Device Market, Revenue & Volume, By Component, 2021-2026 ($)
Table 79: Israel Surge Protection Device Market, Revenue & Volume, By By ANSI/ UL Type, 2021-2026 ($)
Table 80: Israel Surge Protection Device Market, Revenue & Volume, By End User Industry, 2021-2026 ($)
Table 81: Top Companies 2018 (US$) Surge Protection Device Market, Revenue & Volume
Table 82: Product Launch 2018-2019 Surge Protection Device Market, Revenue & Volume
Table 83: Mergers & Acquistions 2018-2019 Surge Protection Device Market, Revenue & Volume
List of Figures:
Figure 1: Overview of Surge Protection Device Market 2021-2026
Figure 2: Market Share Analysis for Surge Protection Device Market 2018 (US$)
Figure 3: Product Comparison in Surge Protection Device Market 2018-2019 (US$)
Figure 4: End User Profile for Surge Protection Device Market 2018-2019 (US$)
Figure 5: Patent Application and Grant in Surge Protection Device Market 2013-2018* (US$)
Figure 6: Top 5 Companies Financial Analysis in Surge Protection Device Market 2018-2019 (US$)
Figure 7: Market Entry Strategy in Surge Protection Device Market 2018-2019
Figure 8: Ecosystem Analysis in Surge Protection Device Market 2018
Figure 9: Average Selling Price in Surge Protection Device Market 2021-2026
Figure 10: Top Opportunites in Surge Protection Device Market 2018-2019
Figure 11: Market Life Cycle Analysis in Surge Protection Device Market
Figure 12: GlobalBy Type Surge Protection Device Market Revenue, 2021-2026 ($)
Figure 13: GlobalBy Protection Type Surge Protection Device Market Revenue, 2021-2026 ($)
Figure 14: GlobalBy Component Surge Protection Device Market Revenue, 2021-2026 ($)
Figure 15: GlobalBy By ANSI/ UL Type Surge Protection Device Market Revenue, 2021-2026 ($)
Figure 16: GlobalBy End User Industry Surge Protection Device Market Revenue, 2021-2026 ($)
Figure 17: Global Surge Protection Device Market - By Geography
Figure 18: Global Surge Protection Device Market Value & Volume, By Geography, 2021-2026 ($)
Figure 19: Global Surge Protection Device Market CAGR, By Geography, 2021-2026 (%)
Figure 20: North America Surge Protection Device Market Value & Volume, 2021-2026 ($)
Figure 21: US Surge Protection Device Market Value & Volume, 2021-2026 ($)
Figure 22: US GDP and Population, 2018-2019 ($)
Figure 23: US GDP – Composition of 2018, By Sector of Origin
Figure 24: US Export and Import Value & Volume, 2018-2019 ($)
Figure 25: Canada Surge Protection Device Market Value & Volume, 2021-2026 ($)
Figure 26: Canada GDP and Population, 2018-2019 ($)
Figure 27: Canada GDP – Composition of 2018, By Sector of Origin
Figure 28: Canada Export and Import Value & Volume, 2018-2019 ($)
Figure 29: Mexico Surge Protection Device Market Value & Volume, 2021-2026 ($)
Figure 30: Mexico GDP and Population, 2018-2019 ($)
Figure 31: Mexico GDP – Composition of 2018, By Sector of Origin
Figure 32: Mexico Export and Import Value & Volume, 2018-2019 ($)
Figure 33: South America Surge Protection Device Market Value & Volume, 2021-2026 ($)
Figure 34: Brazil Surge Protection Device Market Value & Volume, 2021-2026 ($)
Figure 35: Brazil GDP and Population, 2018-2019 ($)
Figure 36: Brazil GDP – Composition of 2018, By Sector of Origin
Figure 37: Brazil Export and Import Value & Volume, 2018-2019 ($)
Figure 38: Venezuela Surge Protection Device Market Value & Volume, 2021-2026 ($)
Figure 39: Venezuela GDP and Population, 2018-2019 ($)
Figure 40: Venezuela GDP – Composition of 2018, By Sector of Origin
Figure 41: Venezuela Export and Import Value & Volume, 2018-2019 ($)
Figure 42: Argentina Surge Protection Device Market Value & Volume, 2021-2026 ($)
Figure 43: Argentina GDP and Population, 2018-2019 ($)
Figure 44: Argentina GDP – Composition of 2018, By Sector of Origin
Figure 45: Argentina Export and Import Value & Volume, 2018-2019 ($)
Figure 46: Ecuador Surge Protection Device Market Value & Volume, 2021-2026 ($)
Figure 47: Ecuador GDP and Population, 2018-2019 ($)
Figure 48: Ecuador GDP – Composition of 2018, By Sector of Origin
Figure 49: Ecuador Export and Import Value & Volume, 2018-2019 ($)
Figure 50: Peru Surge Protection Device Market Value & Volume, 2021-2026 ($)
Figure 51: Peru GDP and Population, 2018-2019 ($)
Figure 52: Peru GDP – Composition of 2018, By Sector of Origin
Figure 53: Peru Export and Import Value & Volume, 2018-2019 ($)
Figure 54: Colombia Surge Protection Device Market Value & Volume, 2021-2026 ($)
Figure 55: Colombia GDP and Population, 2018-2019 ($)
Figure 56: Colombia GDP – Composition of 2018, By Sector of Origin
Figure 57: Colombia Export and Import Value & Volume, 2018-2019 ($)
Figure 58: Costa Rica Surge Protection Device Market Value & Volume, 2021-2026 ($)
Figure 59: Costa Rica GDP and Population, 2018-2019 ($)
Figure 60: Costa Rica GDP – Composition of 2018, By Sector of Origin
Figure 61: Costa Rica Export and Import Value & Volume, 2018-2019 ($)
Figure 62: Europe Surge Protection Device Market Value & Volume, 2021-2026 ($)
Figure 63: U.K Surge Protection Device Market Value & Volume, 2021-2026 ($)
Figure 64: U.K GDP and Population, 2018-2019 ($)
Figure 65: U.K GDP – Composition of 2018, By Sector of Origin
Figure 66: U.K Export and Import Value & Volume, 2018-2019 ($)
Figure 67: Germany Surge Protection Device Market Value & Volume, 2021-2026 ($)
Figure 68: Germany GDP and Population, 2018-2019 ($)
Figure 69: Germany GDP – Composition of 2018, By Sector of Origin
Figure 70: Germany Export and Import Value & Volume, 2018-2019 ($)
Figure 71: Italy Surge Protection Device Market Value & Volume, 2021-2026 ($)
Figure 72: Italy GDP and Population, 2018-2019 ($)
Figure 73: Italy GDP – Composition of 2018, By Sector of Origin
Figure 74: Italy Export and Import Value & Volume, 2018-2019 ($)
Figure 75: France Surge Protection Device Market Value & Volume, 2021-2026 ($)
Figure 76: France GDP and Population, 2018-2019 ($)
Figure 77: France GDP – Composition of 2018, By Sector of Origin
Figure 78: France Export and Import Value & Volume, 2018-2019 ($)
Figure 79: Netherlands Surge Protection Device Market Value & Volume, 2021-2026 ($)
Figure 80: Netherlands GDP and Population, 2018-2019 ($)
Figure 81: Netherlands GDP – Composition of 2018, By Sector of Origin
Figure 82: Netherlands Export and Import Value & Volume, 2018-2019 ($)
Figure 83: Belgium Surge Protection Device Market Value & Volume, 2021-2026 ($)
Figure 84: Belgium GDP and Population, 2018-2019 ($)
Figure 85: Belgium GDP – Composition of 2018, By Sector of Origin
Figure 86: Belgium Export and Import Value & Volume, 2018-2019 ($)
Figure 87: Spain Surge Protection Device Market Value & Volume, 2021-2026 ($)
Figure 88: Spain GDP and Population, 2018-2019 ($)
Figure 89: Spain GDP – Composition of 2018, By Sector of Origin
Figure 90: Spain Export and Import Value & Volume, 2018-2019 ($)
Figure 91: Denmark Surge Protection Device Market Value & Volume, 2021-2026 ($)
Figure 92: Denmark GDP and Population, 2018-2019 ($)
Figure 93: Denmark GDP – Composition of 2018, By Sector of Origin
Figure 94: Denmark Export and Import Value & Volume, 2018-2019 ($)
Figure 95: APAC Surge Protection Device Market Value & Volume, 2021-2026 ($)
Figure 96: China Surge Protection Device Market Value & Volume, 2021-2026
Figure 97: China GDP and Population, 2018-2019 ($)
Figure 98: China GDP – Composition of 2018, By Sector of Origin
Figure 99: China Export and Import Value & Volume, 2018-2019 ($) Surge Protection Device Market China Export and Import Value & Volume, 2018-2019 ($)
Figure 100: Australia Surge Protection Device Market Value & Volume, 2021-2026 ($)
Figure 101: Australia GDP and Population, 2018-2019 ($)
Figure 102: Australia GDP – Composition of 2018, By Sector of Origin
Figure 103: Australia Export and Import Value & Volume, 2018-2019 ($)
Figure 104: South Korea Surge Protection Device Market Value & Volume, 2021-2026 ($)
Figure 105: South Korea GDP and Population, 2018-2019 ($)
Figure 106: South Korea GDP – Composition of 2018, By Sector of Origin
Figure 107: South Korea Export and Import Value & Volume, 2018-2019 ($)
Figure 108: India Surge Protection Device Market Value & Volume, 2021-2026 ($)
Figure 109: India GDP and Population, 2018-2019 ($)
Figure 110: India GDP – Composition of 2018, By Sector of Origin
Figure 111: India Export and Import Value & Volume, 2018-2019 ($)
Figure 112: Taiwan Surge Protection Device Market Value & Volume, 2021-2026 ($)
Figure 113: Taiwan GDP and Population, 2018-2019 ($)
Figure 114: Taiwan GDP – Composition of 2018, By Sector of Origin
Figure 115: Taiwan Export and Import Value & Volume, 2018-2019 ($)
Figure 116: Malaysia Surge Protection Device Market Value & Volume, 2021-2026 ($)
Figure 117: Malaysia GDP and Population, 2018-2019 ($)
Figure 118: Malaysia GDP – Composition of 2018, By Sector of Origin
Figure 119: Malaysia Export and Import Value & Volume, 2018-2019 ($)
Figure 120: Hong Kong Surge Protection Device Market Value & Volume, 2021-2026 ($)
Figure 121: Hong Kong GDP and Population, 2018-2019 ($)
Figure 122: Hong Kong GDP – Composition of 2018, By Sector of Origin
Figure 123: Hong Kong Export and Import Value & Volume, 2018-2019 ($)
Figure 124: Middle East & Africa Surge Protection Device Market Middle East & Africa 3D Printing Market Value & Volume, 2021-2026 ($)
Figure 125: Russia Surge Protection Device Market Value & Volume, 2021-2026 ($)
Figure 126: Russia GDP and Population, 2018-2019 ($)
Figure 127: Russia GDP – Composition of 2018, By Sector of Origin
Figure 128: Russia Export and Import Value & Volume, 2018-2019 ($)
Figure 129: Israel Surge Protection Device Market Value & Volume, 2021-2026 ($)
Figure 130: Israel GDP and Population, 2018-2019 ($)
Figure 131: Israel GDP – Composition of 2018, By Sector of Origin
Figure 132: Israel Export and Import Value & Volume, 2018-2019 ($)
Figure 133: Entropy Share, By Strategies, 2018-2019* (%) Surge Protection Device Market
Figure 134: Developments, 2018-2019* Surge Protection Device Market
Figure 135: Company 1 Surge Protection Device Market Net Revenue, By Years, 2018-2019* ($)
Figure 136: Company 1 Surge Protection Device Market Net Revenue Share, By Business segments, 2018 (%)
Figure 137: Company 1 Surge Protection Device Market Net Sales Share, By Geography, 2018 (%)
Figure 138: Company 2 Surge Protection Device Market Net Revenue, By Years, 2018-2019* ($)
Figure 139: Company 2 Surge Protection Device Market Net Revenue Share, By Business segments, 2018 (%)
Figure 140: Company 2 Surge Protection Device Market Net Sales Share, By Geography, 2018 (%)
Figure 141: Company 3 Surge Protection Device Market Net Revenue, By Years, 2018-2019* ($)
Figure 142: Company 3 Surge Protection Device Market Net Revenue Share, By Business segments, 2018 (%)
Figure 143: Company 3 Surge Protection Device Market Net Sales Share, By Geography, 2018 (%)
Figure 144: Company 4 Surge Protection Device Market Net Revenue, By Years, 2018-2019* ($)
Figure 145: Company 4 Surge Protection Device Market Net Revenue Share, By Business segments, 2018 (%)
Figure 146: Company 4 Surge Protection Device Market Net Sales Share, By Geography, 2018 (%)
Figure 147: Company 5 Surge Protection Device Market Net Revenue, By Years, 2018-2019* ($)
Figure 148: Company 5 Surge Protection Device Market Net Revenue Share, By Business segments, 2018 (%)
Figure 149: Company 5 Surge Protection Device Market Net Sales Share, By Geography, 2018 (%)
Figure 150: Company 6 Surge Protection Device Market Net Revenue, By Years, 2018-2019* ($)
Figure 151: Company 6 Surge Protection Device Market Net Revenue Share, By Business segments, 2018 (%)
Figure 152: Company 6 Surge Protection Device Market Net Sales Share, By Geography, 2018 (%)
Figure 153: Company 7 Surge Protection Device Market Net Revenue, By Years, 2018-2019* ($)
Figure 154: Company 7 Surge Protection Device Market Net Revenue Share, By Business segments, 2018 (%)
Figure 155: Company 7 Surge Protection Device Market Net Sales Share, By Geography, 2018 (%)
Figure 156: Company 8 Surge Protection Device Market Net Revenue, By Years, 2018-2019* ($)
Figure 157: Company 8 Surge Protection Device Market Net Revenue Share, By Business segments, 2018 (%)
Figure 158: Company 8 Surge Protection Device Market Net Sales Share, By Geography, 2018 (%)
Figure 159: Company 9 Surge Protection Device Market Net Revenue, By Years, 2018-2019* ($)
Figure 160: Company 9 Surge Protection Device Market Net Revenue Share, By Business segments, 2018 (%)
Figure 161: Company 9 Surge Protection Device Market Net Sales Share, By Geography, 2018 (%)
Figure 162: Company 10 Surge Protection Device Market Net Revenue, By Years, 2018-2019* ($)
Figure 163: Company 10 Surge Protection Device Market Net Revenue Share, By Business segments, 2018 (%)
Figure 164: Company 10 Surge Protection Device Market Net Sales Share, By Geography, 2018 (%)
Figure 165: Company 11 Surge Protection Device Market Net Revenue, By Years, 2018-2019* ($)
Figure 166: Company 11 Surge Protection Device Market Net Revenue Share, By Business segments, 2018 (%)
Figure 167: Company 11 Surge Protection Device Market Net Sales Share, By Geography, 2018 (%)
Figure 168: Company 12 Surge Protection Device Market Net Revenue, By Years, 2018-2019* ($)
Figure 169: Company 12 Surge Protection Device Market Net Revenue Share, By Business segments, 2018 (%)
Figure 170: Company 12 Surge Protection Device Market Net Sales Share, By Geography, 2018 (%)
Figure 171: Company 13 Surge Protection Device Market Net Revenue, By Years, 2018-2019* ($)
Figure 172: Company 13 Surge Protection Device Market Net Revenue Share, By Business segments, 2018 (%)
Figure 173: Company 13 Surge Protection Device Market Net Sales Share, By Geography, 2018 (%)
Figure 174: Company 14 Surge Protection Device Market Net Revenue, By Years, 2018-2019* ($)
Figure 175: Company 14 Surge Protection Device Market Net Revenue Share, By Business segments, 2018 (%)
Figure 176: Company 14 Surge Protection Device Market Net Sales Share, By Geography, 2018 (%)
Figure 177: Company 15 Surge Protection Device Market Net Revenue, By Years, 2018-2019* ($)
Figure 178: Company 15 Surge Protection Device Market Net Revenue Share, By Business segments, 2018 (%)
Figure 179: Company 15 Surge Protection Device Market Net Sales Share, By Geography, 2018 (%)