 Email
Email Print
Print


Shrink Film For Beverage Multipacks Market - Forecast(2024 - 2030)
Multipacks are generally used for the purpose of wrapping a group of several containers or bottles together in order to sell it as a single unit. They find their application in the packing process of various containers which include alcoholic drinks, soft drinks and dairy products of dissimilar shapes and sizes. This type of packaging also helps in preventing the environment by reducing the plastic use which consequently fuels the demand for shrink films pertaining to beverage multipack applications. This market is regulated and controlled by both established as well as small emerging players.
This type of packaging is light-weight, durable and visually attractive. When equated to rigid packaging, these shrink film beverage multipacks lessen the conveyance expenditures of beverages and are easier to carry. Some of the factors which are all set to boost the growth of shrink film for beverages multipacks include, growing consumption of alcoholic beverages a well as demand for ready-to-drink fruit juices. Major types of shrink films materials commercially available are polyethylene, polypropylene, polyvinyl chloride and more. The report also focuses on different geographic regions and the key countries in terms of changing trends in shrink films for beverage multipacks market in various fields.
The Shrink film for beverage multipacks majorly comprise of three applications forms which include can, bottle and brick. Water and carbonated soft drinks is the major contributing segment in the overall demand for shrink films packaging owing to the constant growth in demand for mineral water and carbonated drinks. Additionally, various designs of bottle wrapping have been introduced which also fuel the growth of this market. Soft-drinks and water are generally packed in bottles and after that shrink film is applied for the secondary packaging. Polyolefins are the most preferred materials for this type of packaging as it biodegrades naturally but over a long period of time. Printed shrink wrap film continues to make headway into all industries, especially where retail point-of-sale is concerned.
The application segment is the major driver for the shrink film for beverage multipacks market to grow. Shrink film for beverage multipacks find their applications in various segments like water, milk, alcoholic beverages, carbonated soft drinks and more. North America dominated the global shrink film for beverage multipacks market. The industrial development in this region is all set to drive the demand of shrink film for beverage multipacks materials. Major players involved in this market are mainly concentrating on R&D initiatives and new product developments to cater the needs of customers. Moreover, booming petrochemical industry will directly impact the demand of the shrink film for beverage multipacks over the foreseeable period.
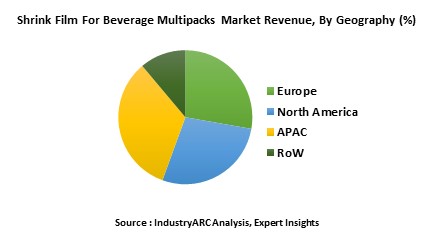
The market share for shrink film for beverage multipacks in Europe is estimated to be the highest in 2015 and is also anticipated to account for the highest market share by 2021. Both, Europe and the Americas are expected to continue to grow at a substantial rate during the forecast period. The APAC region is anticipated to be the fastest growing market during the forecast period. Rising need for attractive packaging in beverages industry coupled with increasing sales of multi-bottle packages drives shrink film market.
The global shrink film for beverage multipacks market is evaluated based on key attributes such as type of materials, application and others. Each of the segmentations in the report has been studied to give comprehensive analysis of global shrink film for beverage multipacks market. The overall market has also been consolidated from the perspective of different geographic locations into standard geographic regions and key economies for this market. Additionally, this report encompasses opportunity analysis, porter analysis, pricing analysis and market forces such as drivers, constraints and challenges that are involved to drive the overall market.
Sample Companies Profiled in this Report are:
This report gives detailed information about the product value chain right from the beginning which includes raw materials till end-use. The market is analyzed based on the key attributes such as the power in the hands of producers and consumers, analysis on the degree of competition, and threats from substitutes and new entrants. The study includes the demand of this particular market on a global and regional scale for a six year period of 2016-2021, both in terms of volume(kilo tons) and revenue($ million).
This type of packaging is light-weight, durable and visually attractive. When equated to rigid packaging, these shrink film beverage multipacks lessen the conveyance expenditures of beverages and are easier to carry. Some of the factors which are all set to boost the growth of shrink film for beverages multipacks include, growing consumption of alcoholic beverages a well as demand for ready-to-drink fruit juices. Major types of shrink films materials commercially available are polyethylene, polypropylene, polyvinyl chloride and more. The report also focuses on different geographic regions and the key countries in terms of changing trends in shrink films for beverage multipacks market in various fields.
The Shrink film for beverage multipacks majorly comprise of three applications forms which include can, bottle and brick. Water and carbonated soft drinks is the major contributing segment in the overall demand for shrink films packaging owing to the constant growth in demand for mineral water and carbonated drinks. Additionally, various designs of bottle wrapping have been introduced which also fuel the growth of this market. Soft-drinks and water are generally packed in bottles and after that shrink film is applied for the secondary packaging. Polyolefins are the most preferred materials for this type of packaging as it biodegrades naturally but over a long period of time. Printed shrink wrap film continues to make headway into all industries, especially where retail point-of-sale is concerned.
The application segment is the major driver for the shrink film for beverage multipacks market to grow. Shrink film for beverage multipacks find their applications in various segments like water, milk, alcoholic beverages, carbonated soft drinks and more. North America dominated the global shrink film for beverage multipacks market. The industrial development in this region is all set to drive the demand of shrink film for beverage multipacks materials. Major players involved in this market are mainly concentrating on R&D initiatives and new product developments to cater the needs of customers. Moreover, booming petrochemical industry will directly impact the demand of the shrink film for beverage multipacks over the foreseeable period.
The market share for shrink film for beverage multipacks in Europe is estimated to be the highest in 2015 and is also anticipated to account for the highest market share by 2021. Both, Europe and the Americas are expected to continue to grow at a substantial rate during the forecast period. The APAC region is anticipated to be the fastest growing market during the forecast period. Rising need for attractive packaging in beverages industry coupled with increasing sales of multi-bottle packages drives shrink film market.
The global shrink film for beverage multipacks market is evaluated based on key attributes such as type of materials, application and others. Each of the segmentations in the report has been studied to give comprehensive analysis of global shrink film for beverage multipacks market. The overall market has also been consolidated from the perspective of different geographic locations into standard geographic regions and key economies for this market. Additionally, this report encompasses opportunity analysis, porter analysis, pricing analysis and market forces such as drivers, constraints and challenges that are involved to drive the overall market.
Sample Companies Profiled in this Report are:
- AEP Industries Inc.
- Amcor Limited
- Bemis Company, Inc.
- Coveris Holdings S.A.
- 10+.
This report gives detailed information about the product value chain right from the beginning which includes raw materials till end-use. The market is analyzed based on the key attributes such as the power in the hands of producers and consumers, analysis on the degree of competition, and threats from substitutes and new entrants. The study includes the demand of this particular market on a global and regional scale for a six year period of 2016-2021, both in terms of volume(kilo tons) and revenue($ million).
1. Market Overview
2. Executive Summary
3. Shrink Film For Beverage Multipacks Market Landscape
3.1. Market Share Analysis
3.2. Comparative Analysis
3.2.1. Product Benchmarking
3.2.2. End User Profiling
3.2.3. Top 5 Financials Analysis
4. Shrink Film For Beverage Multipacks Market Forces
4.1. Market Drivers
4.2. Market Constraints & Challenges
4.3. Attractiveness Of The Shrink Film For Beverage Multipacks Industry
4.3.1. Power of Suppliers
4.3.2. Threats From New Entrants
4.3.3. Power of Buyer
4.3.4. Threat From Substitute Product
4.3.5. Degree of Competition
5. Shrink Film For Beverage Multipacks Market-Strategic Analysis
5.1. Value Chain Analysis
5.2. Pricing Analysis
5.3. Opportunity Analysis
5.4. Product Life Cycle
5.5. Suppliers and Distributors
6. Shrink Film For Beverage Multipacks Market-By Material Type
6.1. Introduction
6.2. Polyethylene
6.3. Polypropylene
6.4. PVC
6.5. Others
7. Shrink Film For Beverage Multipacks Market-By Form
7.1. Introduction
7.2. Bottle
7.3. Can
7.4. Brick
7.5. Others
8. Shrink Film For Beverage Multipacks Market-By Application
8.1. Introduction
8.2. Water
8.3. Milk
8.4. Alcoholic Beverages
8.5. Carbonated Soft Drinks(CSD)
8.6. Others
9. Shrink Film For Beverage Multipacks Market-By Geography
9.1. North America
9.1.1. U.S.
9.1.2. Canada
9.1.3. Mexico
9.1.4. Others
9.2. Europe
9.2.1. U.K.
9.2.2. Germany
9.2.3. Italy
9.2.4. France
9.2.5. Turkey
9.2.6. Rest of Europe
9.3. APAC
9.3.1. China
9.3.2. South Korea
9.3.3. Japan
9.3.4. India
9.3.5. Rest of APAC
9.4. Rest of The World (RoW)
10. Shrink Film For Beverage Multipacks Market Entropy
10.1. New Product Developments
10.2. Product Launches, JVs, Mergers and Acquisitions
11. Company Profiles
11.1. Company 1
"*Financials would be provided on a best efforts basis for private companies"
2. Executive Summary
3. Shrink Film For Beverage Multipacks Market Landscape
3.1. Market Share Analysis
3.2. Comparative Analysis
3.2.1. Product Benchmarking
3.2.2. End User Profiling
3.2.3. Top 5 Financials Analysis
4. Shrink Film For Beverage Multipacks Market Forces
4.1. Market Drivers
4.2. Market Constraints & Challenges
4.3. Attractiveness Of The Shrink Film For Beverage Multipacks Industry
4.3.1. Power of Suppliers
4.3.2. Threats From New Entrants
4.3.3. Power of Buyer
4.3.4. Threat From Substitute Product
4.3.5. Degree of Competition
5. Shrink Film For Beverage Multipacks Market-Strategic Analysis
5.1. Value Chain Analysis
5.2. Pricing Analysis
5.3. Opportunity Analysis
5.4. Product Life Cycle
5.5. Suppliers and Distributors
6. Shrink Film For Beverage Multipacks Market-By Material Type
6.1. Introduction
6.2. Polyethylene
6.3. Polypropylene
6.4. PVC
6.5. Others
7. Shrink Film For Beverage Multipacks Market-By Form
7.1. Introduction
7.2. Bottle
7.3. Can
7.4. Brick
7.5. Others
8. Shrink Film For Beverage Multipacks Market-By Application
8.1. Introduction
8.2. Water
8.3. Milk
8.4. Alcoholic Beverages
8.5. Carbonated Soft Drinks(CSD)
8.6. Others
9. Shrink Film For Beverage Multipacks Market-By Geography
9.1. North America
9.1.1. U.S.
9.1.2. Canada
9.1.3. Mexico
9.1.4. Others
9.2. Europe
9.2.1. U.K.
9.2.2. Germany
9.2.3. Italy
9.2.4. France
9.2.5. Turkey
9.2.6. Rest of Europe
9.3. APAC
9.3.1. China
9.3.2. South Korea
9.3.3. Japan
9.3.4. India
9.3.5. Rest of APAC
9.4. Rest of The World (RoW)
10. Shrink Film For Beverage Multipacks Market Entropy
10.1. New Product Developments
10.2. Product Launches, JVs, Mergers and Acquisitions
11. Company Profiles
11.1. Company 1
11.2. Company 2
11.3. Company 3
11.4. Company 4
11.5. Company 5
11.6. Company 6
11.7. Company 7
11.8. Company 8
11.9. Company 9
11.10. Company 10
*More than 10 Companies are profiled in this Research Report*"*Financials would be provided on a best efforts basis for private companies"
12. Appendix
12.1. Abbreviations
12.2. Sources
12.3. Research Methodology
12.4. Bibliography
12.5. Compilation of Expert Insights
12.6. Disclaimer
List of Table s
Table 1 Shrink Film For Beverage Multipacks Market Overview 2021-2026
Table 2 Shrink Film For Beverage Multipacks Market Leader Analysis 2018-2019 (US$)
Table 3 Shrink Film For Beverage Multipacks MarketProduct Analysis 2018-2019 (US$)
Table 4 Shrink Film For Beverage Multipacks MarketEnd User Analysis 2018-2019 (US$)
Table 5 Shrink Film For Beverage Multipacks MarketPatent Analysis 2013-2018* (US$)
Table 6 Shrink Film For Beverage Multipacks MarketFinancial Analysis 2018-2019 (US$)
Table 7 Shrink Film For Beverage Multipacks Market Driver Analysis 2018-2019 (US$)
Table 8 Shrink Film For Beverage Multipacks MarketChallenges Analysis 2018-2019 (US$)
Table 9 Shrink Film For Beverage Multipacks MarketConstraint Analysis 2018-2019 (US$)
Table 10 Shrink Film For Beverage Multipacks Market Supplier Bargaining Power Analysis 2018-2019 (US$)
Table 11 Shrink Film For Beverage Multipacks Market Buyer Bargaining Power Analysis 2018-2019 (US$)
Table 12 Shrink Film For Beverage Multipacks Market Threat of Substitutes Analysis 2018-2019 (US$)
Table 13 Shrink Film For Beverage Multipacks Market Threat of New Entrants Analysis 2018-2019 (US$)
Table 14 Shrink Film For Beverage Multipacks Market Degree of Competition Analysis 2018-2019 (US$)
Table 15 Shrink Film For Beverage Multipacks MarketValue Chain Analysis 2018-2019 (US$)
Table 16 Shrink Film For Beverage Multipacks MarketPricing Analysis 2021-2026 (US$)
Table 17 Shrink Film For Beverage Multipacks MarketOpportunities Analysis 2021-2026 (US$)
Table 18 Shrink Film For Beverage Multipacks MarketProduct Life Cycle Analysis 2021-2026 (US$)
Table 19 Shrink Film For Beverage Multipacks MarketSupplier Analysis 2018-2019 (US$)
Table 20 Shrink Film For Beverage Multipacks MarketDistributor Analysis 2018-2019 (US$)
Table 21 Shrink Film For Beverage Multipacks Market Trend Analysis 2018-2019 (US$)
Table 22 Shrink Film For Beverage Multipacks Market Size 2018 (US$)
Table 23 Shrink Film For Beverage Multipacks Market Forecast Analysis 2021-2026 (US$)
Table 24 Shrink Film For Beverage Multipacks Market Sales Forecast Analysis 2021-2026 (Units)
Table 25 Shrink Film For Beverage Multipacks Market, Revenue & Volume,By Material Type, 2021-2026 ($)
Table 26 Shrink Film For Beverage Multipacks MarketBy Material Type, Revenue & Volume,By Polyethylene, 2021-2026 ($)
Table 27 Shrink Film For Beverage Multipacks MarketBy Material Type, Revenue & Volume,By Polypropylene, 2021-2026 ($)
Table 28 Shrink Film For Beverage Multipacks MarketBy Material Type, Revenue & Volume,By PVC, 2021-2026 ($)
Table 29 Shrink Film For Beverage Multipacks Market, Revenue & Volume,By Form, 2021-2026 ($)
Table 30 Shrink Film For Beverage Multipacks MarketBy Form, Revenue & Volume,By Bottle, 2021-2026 ($)
Table 31 Shrink Film For Beverage Multipacks MarketBy Form, Revenue & Volume,By Can, 2021-2026 ($)
Table 32 Shrink Film For Beverage Multipacks MarketBy Form, Revenue & Volume,By Brick, 2021-2026 ($)
Table 33 Shrink Film For Beverage Multipacks Market, Revenue & Volume,By Application, 2021-2026 ($)
Table 34 Shrink Film For Beverage Multipacks MarketBy Application, Revenue & Volume,By Water, 2021-2026 ($)
Table 35 Shrink Film For Beverage Multipacks MarketBy Application, Revenue & Volume,By Milk, 2021-2026 ($)
Table 36 Shrink Film For Beverage Multipacks MarketBy Application, Revenue & Volume,By Alcoholic Beverages, 2021-2026 ($)
Table 37 Shrink Film For Beverage Multipacks MarketBy Application, Revenue & Volume,By Carbonated Soft Drinks(CSD), 2021-2026 ($)
Table 38 North America Shrink Film For Beverage Multipacks Market, Revenue & Volume,By Material Type, 2021-2026 ($)
Table 39 North America Shrink Film For Beverage Multipacks Market, Revenue & Volume,By Form, 2021-2026 ($)
Table 40 North America Shrink Film For Beverage Multipacks Market, Revenue & Volume,By Application, 2021-2026 ($)
Table 41 South america Shrink Film For Beverage Multipacks Market, Revenue & Volume,By Material Type, 2021-2026 ($)
Table 42 South america Shrink Film For Beverage Multipacks Market, Revenue & Volume,By Form, 2021-2026 ($)
Table 43 South america Shrink Film For Beverage Multipacks Market, Revenue & Volume,By Application, 2021-2026 ($)
Table 44 Europe Shrink Film For Beverage Multipacks Market, Revenue & Volume,By Material Type, 2021-2026 ($)
Table 45 Europe Shrink Film For Beverage Multipacks Market, Revenue & Volume,By Form, 2021-2026 ($)
Table 46 Europe Shrink Film For Beverage Multipacks Market, Revenue & Volume,By Application, 2021-2026 ($)
Table 47 APAC Shrink Film For Beverage Multipacks Market, Revenue & Volume,By Material Type, 2021-2026 ($)
Table 48 APAC Shrink Film For Beverage Multipacks Market, Revenue & Volume,By Form, 2021-2026 ($)
Table 49 APAC Shrink Film For Beverage Multipacks Market, Revenue & Volume,By Application, 2021-2026 ($)
Table 50 Middle East & Africa Shrink Film For Beverage Multipacks Market, Revenue & Volume,By Material Type, 2021-2026 ($)
Table 51 Middle East & Africa Shrink Film For Beverage Multipacks Market, Revenue & Volume,By Form, 2021-2026 ($)
Table 52 Middle East & Africa Shrink Film For Beverage Multipacks Market, Revenue & Volume,By Application, 2021-2026 ($)
Table 53 Russia Shrink Film For Beverage Multipacks Market, Revenue & Volume,By Material Type, 2021-2026 ($)
Table 54 Russia Shrink Film For Beverage Multipacks Market, Revenue & Volume,By Form, 2021-2026 ($)
Table 55 Russia Shrink Film For Beverage Multipacks Market, Revenue & Volume,By Application, 2021-2026 ($)
Table 56 Israel Shrink Film For Beverage Multipacks Market, Revenue & Volume,By Material Type, 2021-2026 ($)
Table 57 Israel Shrink Film For Beverage Multipacks Market, Revenue & Volume,By Form, 2021-2026 ($)
Table 58 Israel Shrink Film For Beverage Multipacks Market, Revenue & Volume,By Application, 2021-2026 ($)
Table 59 Top Companies 2018 (US$)Shrink Film For Beverage Multipacks Market, Revenue & Volume,,
Table 60 Product Launch 2018-2019Shrink Film For Beverage Multipacks Market, Revenue & Volume,,
Table 61 Mergers & Acquistions 2018-2019Shrink Film For Beverage Multipacks Market, Revenue & Volume,,
List of Figures
Figure 1 Overview of Shrink Film For Beverage Multipacks Market 2021-2026
Figure 2 Market Share Analysis for Shrink Film For Beverage Multipacks Market 2018 (US$)
Figure 3 Product Comparison in Shrink Film For Beverage Multipacks Market 2018-2019 (US$)
Figure 4 End User Profile for Shrink Film For Beverage Multipacks Market 2018-2019 (US$)
Figure 5 Patent Application and Grant in Shrink Film For Beverage Multipacks Market 2013-2018* (US$)
Figure 6 Top 5 Companies Financial Analysis in Shrink Film For Beverage Multipacks Market 2018-2019 (US$)
Figure 7 Market Entry Strategy in Shrink Film For Beverage Multipacks Market 2018-2019
Figure 8 Ecosystem Analysis in Shrink Film For Beverage Multipacks Market2018
Figure 9 Average Selling Price in Shrink Film For Beverage Multipacks Market 2021-2026
Figure 10 Top Opportunites in Shrink Film For Beverage Multipacks Market 2018-2019
Figure 11 Market Life Cycle Analysis in Shrink Film For Beverage Multipacks Market
Figure 12 GlobalBy Material TypeShrink Film For Beverage Multipacks Market Revenue, 2021-2026 ($)
Figure 13 GlobalBy FormShrink Film For Beverage Multipacks Market Revenue, 2021-2026 ($)
Figure 15 GlobalBy ApplicationShrink Film For Beverage Multipacks Market Revenue, 2021-2026 ($)
Figure 17 Global Shrink Film For Beverage Multipacks Market - By Geography
Figure 18 Global Shrink Film For Beverage Multipacks Market Value & Volume, By Geography, 2021-2026 ($)
Figure 19 Global Shrink Film For Beverage Multipacks Market CAGR, By Geography, 2021-2026 (%)
Figure 20 North America Shrink Film For Beverage Multipacks Market Value & Volume, 2021-2026 ($)
Figure 21 US Shrink Film For Beverage Multipacks Market Value & Volume, 2021-2026 ($)
Figure 22 US GDP and Population, 2018-2019 ($)
Figure 23 US GDP – Composition of 2018, By Sector of Origin
Figure 24 US Export and Import Value & Volume, 2018-2019 ($)
Figure 25 Canada Shrink Film For Beverage Multipacks Market Value & Volume, 2021-2026 ($)
Figure 26 Canada GDP and Population, 2018-2019 ($)
Figure 27 Canada GDP – Composition of 2018, By Sector of Origin
Figure 28 Canada Export and Import Value & Volume, 2018-2019 ($)
Figure 29 Mexico Shrink Film For Beverage Multipacks Market Value & Volume, 2021-2026 ($)
Figure 30 Mexico GDP and Population, 2018-2019 ($)
Figure 31 Mexico GDP – Composition of 2018, By Sector of Origin
Figure 32 Mexico Export and Import Value & Volume, 2018-2019 ($)
Figure 33 South America Shrink Film For Beverage Multipacks MarketSouth America 3D Printing Market Value & Volume, 2021-2026 ($)
Figure 34 Brazil Shrink Film For Beverage Multipacks Market Value & Volume, 2021-2026 ($)
Figure 35 Brazil GDP and Population, 2018-2019 ($)
Figure 36 Brazil GDP – Composition of 2018, By Sector of Origin
Figure 37 Brazil Export and Import Value & Volume, 2018-2019 ($)
Figure 38 Venezuela Shrink Film For Beverage Multipacks Market Value & Volume, 2021-2026 ($)
Figure 39 Venezuela GDP and Population, 2018-2019 ($)
Figure 40 Venezuela GDP – Composition of 2018, By Sector of Origin
Figure 41 Venezuela Export and Import Value & Volume, 2018-2019 ($)
Figure 42 Argentina Shrink Film For Beverage Multipacks Market Value & Volume, 2021-2026 ($)
Figure 43 Argentina GDP and Population, 2018-2019 ($)
Figure 44 Argentina GDP – Composition of 2018, By Sector of Origin
Figure 45 Argentina Export and Import Value & Volume, 2018-2019 ($)
Figure 46 Ecuador Shrink Film For Beverage Multipacks Market Value & Volume, 2021-2026 ($)
Figure 47 Ecuador GDP and Population, 2018-2019 ($)
Figure 48 Ecuador GDP – Composition of 2018, By Sector of Origin
Figure 49 Ecuador Export and Import Value & Volume, 2018-2019 ($)
Figure 50 Peru Shrink Film For Beverage Multipacks Market Value & Volume, 2021-2026 ($)
Figure 51 Peru GDP and Population, 2018-2019 ($)
Figure 52 Peru GDP – Composition of 2018, By Sector of Origin
Figure 53 Peru Export and Import Value & Volume, 2018-2019 ($)
Figure 54 Colombia Shrink Film For Beverage Multipacks Market Value & Volume, 2021-2026 ($)
Figure 55 Colombia GDP and Population, 2018-2019 ($)
Figure 56 Colombia GDP – Composition of 2018, By Sector of Origin
Figure 57 Colombia Export and Import Value & Volume, 2018-2019 ($)
Figure 58 Costa Rica Shrink Film For Beverage Multipacks MarketCosta Rica 3D Printing Market Value & Volume, 2021-2026 ($)
Figure 59 Costa Rica GDP and Population, 2018-2019 ($)
Figure 60 Costa Rica GDP – Composition of 2018, By Sector of Origin
Figure 61 Costa Rica Export and Import Value & Volume, 2018-2019 ($)
Figure 62 Europe Shrink Film For Beverage Multipacks Market Value & Volume, 2021-2026 ($)
Figure 63 U.K Shrink Film For Beverage Multipacks Market Value & Volume, 2021-2026 ($)
Figure 64 U.K GDP and Population, 2018-2019 ($)
Figure 65 U.K GDP – Composition of 2018, By Sector of Origin
Figure 66 U.K Export and Import Value & Volume, 2018-2019 ($)
Figure 67 Germany Shrink Film For Beverage Multipacks Market Value & Volume, 2021-2026 ($)
Figure 68 Germany GDP and Population, 2018-2019 ($)
Figure 69 Germany GDP – Composition of 2018, By Sector of Origin
Figure 70 Germany Export and Import Value & Volume, 2018-2019 ($)
Figure 71 Italy Shrink Film For Beverage Multipacks Market Value & Volume, 2021-2026 ($)
Figure 72 Italy GDP and Population, 2018-2019 ($)
Figure 73 Italy GDP – Composition of 2018, By Sector of Origin
Figure 74 Italy Export and Import Value & Volume, 2018-2019 ($)
Figure 75 France Shrink Film For Beverage Multipacks Market Value & Volume, 2021-2026 ($)
Figure 76 France GDP and Population, 2018-2019 ($)
Figure 77 France GDP – Composition of 2018, By Sector of Origin
Figure 78 France Export and Import Value & Volume, 2018-2019 ($)
Figure 79 Netherlands Shrink Film For Beverage Multipacks Market Value & Volume, 2021-2026 ($)
Figure 80 Netherlands GDP and Population, 2018-2019 ($)
Figure 81 Netherlands GDP – Composition of 2018, By Sector of Origin
Figure 82 Netherlands Export and Import Value & Volume, 2018-2019 ($)
Figure 83 Belgium Shrink Film For Beverage Multipacks Market Value & Volume, 2021-2026 ($)
Figure 84 Belgium GDP and Population, 2018-2019 ($)
Figure 85 Belgium GDP – Composition of 2018, By Sector of Origin
Figure 86 Belgium Export and Import Value & Volume, 2018-2019 ($)
Figure 87 Spain Shrink Film For Beverage Multipacks Market Value & Volume, 2021-2026 ($)
Figure 88 Spain GDP and Population, 2018-2019 ($)
Figure 89 Spain GDP – Composition of 2018, By Sector of Origin
Figure 90 Spain Export and Import Value & Volume, 2018-2019 ($)
Figure 91 Denmark Shrink Film For Beverage Multipacks Market Value & Volume, 2021-2026 ($)
Figure 92 Denmark GDP and Population, 2018-2019 ($)
Figure 93 Denmark GDP – Composition of 2018, By Sector of Origin
Figure 94 Denmark Export and Import Value & Volume, 2018-2019 ($)
Figure 95 APAC Shrink Film For Beverage Multipacks Market Value & Volume, 2021-2026 ($)
Figure 96 China Shrink Film For Beverage Multipacks MarketValue & Volume, 2021-2026
Figure 97 China GDP and Population, 2018-2019 ($)
Figure 98 China GDP – Composition of 2018, By Sector of Origin
Figure 99 China Export and Import Value & Volume, 2018-2019 ($)Shrink Film For Beverage Multipacks MarketChina Export and Import Value & Volume, 2018-2019 ($)
Figure 100 Australia Shrink Film For Beverage Multipacks Market Value & Volume, 2021-2026 ($)
Figure 101 Australia GDP and Population, 2018-2019 ($)
Figure 102 Australia GDP – Composition of 2018, By Sector of Origin
Figure 103 Australia Export and Import Value & Volume, 2018-2019 ($)
Figure 104 South Korea Shrink Film For Beverage Multipacks Market Value & Volume, 2021-2026 ($)
Figure 105 South Korea GDP and Population, 2018-2019 ($)
Figure 106 South Korea GDP – Composition of 2018, By Sector of Origin
Figure 107 South Korea Export and Import Value & Volume, 2018-2019 ($)
Figure 108 India Shrink Film For Beverage Multipacks Market Value & Volume, 2021-2026 ($)
Figure 109 India GDP and Population, 2018-2019 ($)
Figure 110 India GDP – Composition of 2018, By Sector of Origin
Figure 111 India Export and Import Value & Volume, 2018-2019 ($)
Figure 112 Taiwan Shrink Film For Beverage Multipacks MarketTaiwan 3D Printing Market Value & Volume, 2021-2026 ($)
Figure 113 Taiwan GDP and Population, 2018-2019 ($)
Figure 114 Taiwan GDP – Composition of 2018, By Sector of Origin
Figure 115 Taiwan Export and Import Value & Volume, 2018-2019 ($)
Figure 116 Malaysia Shrink Film For Beverage Multipacks MarketMalaysia 3D Printing Market Value & Volume, 2021-2026 ($)
Figure 117 Malaysia GDP and Population, 2018-2019 ($)
Figure 118 Malaysia GDP – Composition of 2018, By Sector of Origin
Figure 119 Malaysia Export and Import Value & Volume, 2018-2019 ($)
Figure 120 Hong Kong Shrink Film For Beverage Multipacks MarketHong Kong 3D Printing Market Value & Volume, 2021-2026 ($)
Figure 121 Hong Kong GDP and Population, 2018-2019 ($)
Figure 122 Hong Kong GDP – Composition of 2018, By Sector of Origin
Figure 123 Hong Kong Export and Import Value & Volume, 2018-2019 ($)
Figure 124 Middle East & Africa Shrink Film For Beverage Multipacks MarketMiddle East & Africa 3D Printing Market Value & Volume, 2021-2026 ($)
Figure 125 Russia Shrink Film For Beverage Multipacks MarketRussia 3D Printing Market Value & Volume, 2021-2026 ($)
Figure 126 Russia GDP and Population, 2018-2019 ($)
Figure 127 Russia GDP – Composition of 2018, By Sector of Origin
Figure 128 Russia Export and Import Value & Volume, 2018-2019 ($)
Figure 129 Israel Shrink Film For Beverage Multipacks Market Value & Volume, 2021-2026 ($)
Figure 130 Israel GDP and Population, 2018-2019 ($)
Figure 131 Israel GDP – Composition of 2018, By Sector of Origin
Figure 132 Israel Export and Import Value & Volume, 2018-2019 ($)
Figure 133 Entropy Share, By Strategies, 2018-2019* (%)Shrink Film For Beverage Multipacks Market
Figure 134 Developments, 2018-2019*Shrink Film For Beverage Multipacks Market
Figure 135 Company 1 Shrink Film For Beverage Multipacks Market Net Revenue, By Years, 2018-2019* ($)
Figure 136 Company 1 Shrink Film For Beverage Multipacks Market Net Revenue Share, By Business segments, 2018 (%)
Figure 137 Company 1 Shrink Film For Beverage Multipacks Market Net Sales Share, By Geography, 2018 (%)
Figure 138 Company 2 Shrink Film For Beverage Multipacks Market Net Revenue, By Years, 2018-2019* ($)
Figure 139 Company 2 Shrink Film For Beverage Multipacks Market Net Revenue Share, By Business segments, 2018 (%)
Figure 140 Company 2 Shrink Film For Beverage Multipacks Market Net Sales Share, By Geography, 2018 (%)
Figure 141 Company 3Shrink Film For Beverage Multipacks Market Net Revenue, By Years, 2018-2019* ($)
Figure 142 Company 3Shrink Film For Beverage Multipacks Market Net Revenue Share, By Business segments, 2018 (%)
Figure 143 Company 3Shrink Film For Beverage Multipacks Market Net Sales Share, By Geography, 2018 (%)
Figure 144 Company 4 Shrink Film For Beverage Multipacks Market Net Revenue, By Years, 2018-2019* ($)
Figure 145 Company 4 Shrink Film For Beverage Multipacks Market Net Revenue Share, By Business segments, 2018 (%)
Figure 146 Company 4 Shrink Film For Beverage Multipacks Market Net Sales Share, By Geography, 2018 (%)
Figure 147 Company 5 Shrink Film For Beverage Multipacks Market Net Revenue, By Years, 2018-2019* ($)
Figure 148 Company 5 Shrink Film For Beverage Multipacks Market Net Revenue Share, By Business segments, 2018 (%)
Figure 149 Company 5 Shrink Film For Beverage Multipacks Market Net Sales Share, By Geography, 2018 (%)
Figure 150 Company 6 Shrink Film For Beverage Multipacks Market Net Revenue, By Years, 2018-2019* ($)
Figure 151 Company 6 Shrink Film For Beverage Multipacks Market Net Revenue Share, By Business segments, 2018 (%)
Figure 152 Company 6 Shrink Film For Beverage Multipacks Market Net Sales Share, By Geography, 2018 (%)
Figure 153 Company 7 Shrink Film For Beverage Multipacks Market Net Revenue, By Years, 2018-2019* ($)
Figure 154 Company 7 Shrink Film For Beverage Multipacks Market Net Revenue Share, By Business segments, 2018 (%)
Figure 155 Company 7 Shrink Film For Beverage Multipacks Market Net Sales Share, By Geography, 2018 (%)
Figure 156 Company 8 Shrink Film For Beverage Multipacks Market Net Revenue, By Years, 2018-2019* ($)
Figure 157 Company 8 Shrink Film For Beverage Multipacks Market Net Revenue Share, By Business segments, 2018 (%)
Figure 158 Company 8 Shrink Film For Beverage Multipacks Market Net Sales Share, By Geography, 2018 (%)
Figure 159 Company 9 Shrink Film For Beverage Multipacks Market Net Revenue, By Years, 2018-2019* ($)
Figure 160 Company 9 Shrink Film For Beverage Multipacks Market Net Revenue Share, By Business segments, 2018 (%)
Figure 161 Company 9 Shrink Film For Beverage Multipacks Market Net Sales Share, By Geography, 2018 (%)
Figure 162 Company 10 Shrink Film For Beverage Multipacks Market Net Revenue, By Years, 2018-2019* ($)
Figure 163 Company 10 Shrink Film For Beverage Multipacks Market Net Revenue Share, By Business segments, 2018 (%)
Figure 164 Company 10 Shrink Film For Beverage Multipacks Market Net Sales Share, By Geography, 2018 (%)
Figure 165 Company 11 Shrink Film For Beverage Multipacks Market Net Revenue, By Years, 2018-2019* ($)
Figure 166 Company 11 Shrink Film For Beverage Multipacks Market Net Revenue Share, By Business segments, 2018 (%)
Figure 167 Company 11 Shrink Film For Beverage Multipacks Market Net Sales Share, By Geography, 2018 (%)
Figure 168 Company 12 Shrink Film For Beverage Multipacks Market Net Revenue, By Years, 2018-2019* ($)
Figure 169 Company 12 Shrink Film For Beverage Multipacks Market Net Revenue Share, By Business segments, 2018 (%)
Figure 170 Company 12 Shrink Film For Beverage Multipacks Market Net Sales Share, By Geography, 2018 (%)
Figure 171 Company 13Shrink Film For Beverage Multipacks Market Net Revenue, By Years, 2018-2019* ($)
Figure 172 Company 13Shrink Film For Beverage Multipacks Market Net Revenue Share, By Business segments, 2018 (%)
Figure 173 Company 13Shrink Film For Beverage Multipacks Market Net Sales Share, By Geography, 2018 (%)
Figure 174 Company 14 Shrink Film For Beverage Multipacks Market Net Revenue, By Years, 2018-2019* ($)
Figure 175 Company 14 Shrink Film For Beverage Multipacks Market Net Revenue Share, By Business segments, 2018 (%)
Figure 176 Company 14 Shrink Film For Beverage Multipacks Market Net Sales Share, By Geography, 2018 (%)
Figure 177 Company 15 Shrink Film For Beverage Multipacks Market Net Revenue, By Years, 2018-2019* ($)
Figure 178 Company 15 Shrink Film For Beverage Multipacks Market Net Revenue Share, By Business segments, 2018 (%)
Figure 179 Company 15 Shrink Film For Beverage Multipacks Market Net Sales Share, By Geography, 2018 (%)