 Email
Email Print
Print


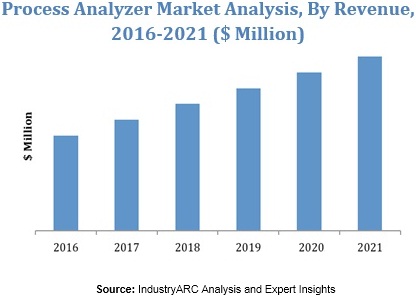
A process analyser is a device which is used for determining the chemical composition or physical properties of substances in a process. The process analyser is responsible for process optimization, asset protection, and compliance.
Looking at process analysers by type, the market for pH/ORP analyzers is expected to have the highest growth rate during the forecast period. A key reason for the high growth of this particular type of process analyser is its ability to be used across key applications such as water & waste water treatment, pharmaceutical and food & beverages. The food & beverage industry is one particular industry which will contribute significantly to the process analyser market size as numerous countries are slowly implementing strict regulations related to the testing and analysis of food & beverage products as a continuous process throughout the year.
The process analyzers market for the water & wastewater industry accounted for the highest hare of the process analyser market globally. This was followed by the food & beverages, petrochemical, and pharmaceuticals industries. Key factors that are contributing to the high growth in for these type of process analyzers is that there have been a number of stringent regulations which have been implemented across the globe in terms of the sort of testing which needs to be done and more importantly having all the key constituents of the substance listed down which can be done through a process analyser.
The market for process analysers is fuelled by the growth in demand from the application segments listed above. Another unique driver that is expected to help the market grow especially in the US is the shale gas market. As of 2015, the Americas contributed the highest to the overall process analyser market, while the APAC region will experience the fastest growth during the forecast period. The APAC market offers numerous opportunities since various governments in the region are looking at clean water as a key requirement for its citizens for which process analysers will be required for testing purposes. Water treatment facilities are being developed in the emerging markets in the APAC region which is again fuelling the growth. Testing in the food & beverage industry is absolutely essential and now numerous countries are implementing strict norms to ensure that all food and beverage production meet the conditions of these stringent requirements.
In terms of Process analyzer by service the market has been divided into the following Start-Up & Commissioning Services, Technical Support Services, Parts & Spares Services and Preventive Maintenance Services. The Process analyzer market has also been segmented by the following types Aluminum Analyzers , Ammonia Analyzers, Chlorine Analyzers , Conductivity Analyzers , Dissolved Oxygen Analyzers , Fluoride Analyzers , Liquid Density Analyzers , MLSS Analyzers , Near-Infrared Analyzers , PH/ORP Analyzers , TOC Analyzers , Turbidity Analyzers and Others. The Process analyzer market has also been segmented by the following industries Food & Beverages, Metal & Mining, Oil & Gas , Petrochemical , Pharmaceutical , Power Generation , Pulp & Paper , Semiconductor Processing , Water & Wastewater and Others. The Process analyzer market has also been segmented by the following geographies Americas, APAC, Europe, ROW.
Following are just a few of the companies that are operating in the Process analyzer market:
- ABB Ltd.
- Endress+Hauser AG
- GE Analytical Instruments
- Hach Lange GmbH
- Honeywell International, Inc.
1. Process Analyzer Market - Overview
1.1. Definitions and Scope
2. Process Analyzer Market - Executive summary
2.1. Market Revenue, Market Size and Key Trends by Company
2.2. Key Trends by type of Application
2.3. Key Trends segmented by Geography
3. Process Analyzer Market
3.1. Comparative analysis
3.1.1. Product Benchmarking - Top 10 companies
3.1.2. Top 5 Financials Analysis
3.1.3. Market Value split by Top 10 companies
3.1.4. Patent Analysis - Top 10 companies
3.1.5. Pricing Analysis
4. Process Analyzer Market – Startup companies Scenario Premium
4.1. Top 10 startup company Analysis by
4.1.1. Investment
4.1.2. Revenue
4.1.3. Market Shares
4.1.4. Market Size and Application Analysis
4.1.5. Venture Capital and Funding Scenario
5. Process Analyzer Market – Industry Market Entry Scenario Premium
5.1. Regulatory Framework Overview
5.2. New Business and Ease of Doing business index
5.3. Case studies of successful ventures
5.4. Customer Analysis – Top 10 companies
6. Process Analyzer Market Forces
6.1. Drivers
6.2. Constraints
6.3. Challenges
6.4. Porters five force model
6.4.1. Bargaining power of suppliers
6.4.2. Bargaining powers of customers
6.4.3. Threat of new entrants
6.4.4. Rivalry among existing players
6.4.5. Threat of substitutes
7. Process Analyzer Market -Strategic analysis
7.1. Value chain analysis
7.2. Opportunities analysis
7.3. Product life cycle
7.4. Suppliers and distributors Market Share
8. Process Analyzer Market – By Service (Market Size -$Million / $Billion)
8.1. Market Size and Market Share Analysis
8.2. Application Revenue and Trend Research
8.3. Product Segment Analysis
8.3.1. Start-Up & Commissioning Services
8.3.2. Technical Support Services
8.3.3. Parts & Spares Services
8.3.4. Preventive Maintenance Services
9. Process Analyzer Market – By Type (Market Size -$Million / $Billion)
9.1. Aluminum Analyzers
9.2. Ammonia Analyzers
9.3. Chlorine Analyzers
9.4. Conductivity Analyzers
9.5. Dissolved Oxygen Analyzers
9.6. Fluoride Analyzers
9.7. Liquid Density Analyzers
9.8. MLSS Analyzers
9.9. Near-Infrared Analyzers
9.10. PH/ORP Analyzers
9.11. TOC Analyzers
9.12. Turbidity Analyzers
9.13. Others
10. Process Analyzer - By Geography (Market Size -$Million / $Billion)
10.1. Process Analyzer Market - North America Segment Research
10.2. North America Market Research (Million / $Billion)
10.2.1. Segment type Size and Market Size Analysis
10.2.2. Revenue and Trends
10.2.3. Application Revenue and Trends by type of Application
10.2.4. Company Revenue and Product Analysis
10.2.5. North America Product type and Application Market Size
10.2.5.1. U.S.
10.2.5.2. Canada
10.2.5.3. Mexico
10.2.5.4. Rest of North America
10.3. Process Analyzer - South America Segment Research
10.4. South America Market Research (Market Size -$Million / $Billion)
10.4.1. Segment type Size and Market Size Analysis
10.4.2. Revenue and Trends
10.4.3. Application Revenue and Trends by type of Application
10.4.4. Company Revenue and Product Analysis
10.4.5. South America Product type and Application Market Size
10.4.5.1. Brazil
10.4.5.2. Venezuela
10.4.5.3. Argentina
10.4.5.4. Ecuador
10.4.5.5. Peru
10.4.5.6. Colombia
10.4.5.7. Costa Rica
10.4.5.8. Rest of South America
10.5. Process Analyzer - Europe Segment Research
10.6. Europe Market Research (Market Size -$Million / $Billion)
10.6.1. Segment type Size and Market Size Analysis
10.6.2. Revenue and Trends
10.6.3. Application Revenue and Trends by type of Application
10.6.4. Company Revenue and Product Analysis
10.6.5. Europe Segment Product type and Application Market Size
10.6.5.1. U.K
10.6.5.2. Germany
10.6.5.3. Italy
10.6.5.4. France
10.6.5.5. Netherlands
10.6.5.6. Belgium
10.6.5.7. Spain
10.6.5.8. Denmark
10.6.5.9. Rest of Europe
10.7. Process Analyzer – APAC Segment Research
10.8. APAC Market Research (Market Size -$Million / $Billion)
10.8.1. Segment type Size and Market Size Analysis
10.8.2. Revenue and Trends
10.8.3. Application Revenue and Trends by type of Application
10.8.4. Company Revenue and Product Analysis
10.8.5. APAC Segment – Product type and Application Market Size
10.8.5.1. China
10.8.5.2. Australia
10.8.5.3. Japan
10.8.5.4. South Korea
10.8.5.5. India
10.8.5.6. Taiwan
10.8.5.7. Malaysia
11. Process Analyzer Market - Entropy
11.1. New product launches
11.2. M&A's, collaborations, JVs and partnerships
12. Process Analyzer Market – Industry / Segment Competition landscape Premium
12.1. Market Share Analysis
12.1.1. Market Share by Country- Top companies
12.1.2. Market Share by Region- Top 10 companies
12.1.3. Market Share by type of Application – Top 10 companies
12.1.4. Market Share by type of Product / Product category- Top 10 companies
12.1.5. Market Share at global level- Top 10 companies
12.1.6. Best Practises for companies
13. Process Analyzer Market – Key Company List by Country Premium
14. Process Analyzer Market Company Analysis
14.1. Market Share, Company Revenue, Products, M&A, Developments
14.2. ABB Ltd.
14.3. Endress+Hauser AG
14.4. GE Analytical Instruments
14.5. Hach Lange GmbH
14.6. Honeywell International, Inc.
14.7. Company 6
14.8. Company 7
14.9. Company 8
14.10. Company 9
14.11. Company 10 and more
"*Financials would be provided on a best efforts basis for private companies"
15. Process Analyzer Market -Appendix
15.1. Abbreviations
15.2. Sources
16. Process Analyzer Market -Methodology Premium
16.1. Research Methodology
16.1.1. Company Expert Interviews
16.1.2. Industry Databases
16.1.3. Associations
16.1.4. Company News
16.1.5. Company Annual Reports
16.1.6. Application Trends
16.1.7. New Products and Product database
16.1.8. Company Transcripts
16.1.9. R&D Trends
16.1.10. Key Opinion Leaders Interviews
16.1.11. Supply and Demand Trends
List of Tables
Table1 Process Analyzer Market Overview 2021-2026
Table2 Process Analyzer Market Leader Analysis 2018-2019 (US$)
Table3 Process Analyzer MarketProduct Analysis 2018-2019 (US$)
Table4 Process Analyzer MarketEnd User Analysis 2018-2019 (US$)
Table5 Process Analyzer MarketPatent Analysis 2013-2018* (US$)
Table6 Process Analyzer MarketFinancial Analysis 2018-2019 (US$)
Table7 Process Analyzer Market Driver Analysis 2018-2019 (US$)
Table8 Process Analyzer MarketChallenges Analysis 2018-2019 (US$)
Table9 Process Analyzer MarketConstraint Analysis 2018-2019 (US$)
Table10 Process Analyzer Market Supplier Bargaining Power Analysis 2018-2019 (US$)
Table11 Process Analyzer Market Buyer Bargaining Power Analysis 2018-2019 (US$)
Table12 Process Analyzer Market Threat of Substitutes Analysis 2018-2019 (US$)
Table13 Process Analyzer Market Threat of New Entrants Analysis 2018-2019 (US$)
Table14 Process Analyzer Market Degree of Competition Analysis 2018-2019 (US$)
Table15 Process Analyzer MarketValue Chain Analysis 2018-2019 (US$)
Table16 Process Analyzer MarketPricing Analysis 2021-2026 (US$)
Table17 Process Analyzer MarketOpportunities Analysis 2021-2026 (US$)
Table18 Process Analyzer MarketProduct Life Cycle Analysis 2021-2026 (US$)
Table19 Process Analyzer MarketSupplier Analysis 2018-2019 (US$)
Table20 Process Analyzer MarketDistributor Analysis 2018-2019 (US$)
Table21 Process Analyzer Market Trend Analysis 2018-2019 (US$)
Table22 Process Analyzer Market Size 2018 (US$)
Table23 Process Analyzer Market Forecast Analysis 2021-2026 (US$)
Table24 Process Analyzer Market Sales Forecast Analysis 2021-2026 (Units)
Table25 Process Analyzer Market, Revenue & Volume,By Type, 2021-2026 ($)
Table26 Process Analyzer MarketBy Type, Revenue & Volume,Aluminum Analyzers, 2021-2026 ($)
Table27 Process Analyzer MarketBy Type, Revenue & Volume,Ammonia Analyzers, 2021-2026 ($)
Table28 Process Analyzer MarketBy Type, Revenue & Volume,Conductivity Analyzers, 2021-2026 ($)
Table29 Process Analyzer MarketBy Type, Revenue & Volume,Dissolved Oxygen Analyzers, 2021-2026 ($)
Table30 Process Analyzer MarketBy Type, Revenue & Volume,Liquid Density Analyzers, 2021-2026 ($)
Table31 North America Process Analyzer Market, Revenue & Volume,By Type, 2021-2026 ($)
Table32 South america Process Analyzer Market, Revenue & Volume,By Type, 2021-2026 ($)
Table33 Europe Process Analyzer Market, Revenue & Volume,By Type, 2021-2026 ($)
Table34 APAC Process Analyzer Market, Revenue & Volume,By Type, 2021-2026 ($)
Table35 Middle East & Africa Process Analyzer Market, Revenue & Volume,By Type, 2021-2026 ($)
Table36 Russia Process Analyzer Market, Revenue & Volume,By Type, 2021-2026 ($)
Table37 Israel Process Analyzer Market, Revenue & Volume,By Type, 2021-2026 ($)
Table38 Top Companies 2018 (US$)Process Analyzer Market, Revenue & Volume,,
Table39 Product Launch 2018-2019Process Analyzer Market, Revenue & Volume,,
Table40 Mergers & Acquistions 2018-2019Process Analyzer Market, Revenue & Volume,,
List of Figures
Figure 1 Overview of Process Analyzer Market 2021-2026
Figure 2 Market Share Analysis for Process Analyzer Market 2018 (US$)
Figure 3 Product Comparison in Process Analyzer Market 2018-2019 (US$)
Figure 4 End User Profile for Process Analyzer Market 2018-2019 (US$)
Figure 5 Patent Application and Grant in Process Analyzer Market 2013-2018* (US$)
Figure 6 Top 5 Companies Financial Analysis in Process Analyzer Market 2018-2019 (US$)
Figure 7 Market Entry Strategy in Process Analyzer Market 2018-2019
Figure 8 Ecosystem Analysis in Process Analyzer Market2018
Figure 9 Average Selling Price in Process Analyzer Market 2021-2026
Figure 10 Top Opportunites in Process Analyzer Market 2018-2019
Figure 11 Market Life Cycle Analysis in Process Analyzer Market
Figure 12 GlobalBy TypeProcess Analyzer Market Revenue, 2021-2026 ($)
Figure 13 Global Process Analyzer Market - By Geography
Figure 14 Global Process Analyzer Market Value & Volume, By Geography, 2021-2026 ($)
Figure 15 Global Process Analyzer Market CAGR, By Geography, 2021-2026 (%)
Figure 16 North America Process Analyzer Market Value & Volume, 2021-2026 ($)
Figure 17 US Process Analyzer Market Value & Volume, 2021-2026 ($)
Figure 18 US GDP and Population, 2018-2019 ($)
Figure 19 US GDP – Composition of 2018, By Sector of Origin
Figure 20 US Export and Import Value & Volume, 2018-2019 ($)
Figure 21 Canada Process Analyzer Market Value & Volume, 2021-2026 ($)
Figure 22 Canada GDP and Population, 2018-2019 ($)
Figure 23 Canada GDP – Composition of 2018, By Sector of Origin
Figure 24 Canada Export and Import Value & Volume, 2018-2019 ($)
Figure 25 Mexico Process Analyzer Market Value & Volume, 2021-2026 ($)
Figure 26 Mexico GDP and Population, 2018-2019 ($)
Figure 27 Mexico GDP – Composition of 2018, By Sector of Origin
Figure 28 Mexico Export and Import Value & Volume, 2018-2019 ($)
Figure 29 South America Process Analyzer MarketSouth America 3D Printing Market Value & Volume, 2021-2026 ($)
Figure 30 Brazil Process Analyzer Market Value & Volume, 2021-2026 ($)
Figure 31 Brazil GDP and Population, 2018-2019 ($)
Figure 32 Brazil GDP – Composition of 2018, By Sector of Origin
Figure 33 Brazil Export and Import Value & Volume, 2018-2019 ($)
Figure 34 Venezuela Process Analyzer Market Value & Volume, 2021-2026 ($)
Figure 35 Venezuela GDP and Population, 2018-2019 ($)
Figure 36 Venezuela GDP – Composition of 2018, By Sector of Origin
Figure 37 Venezuela Export and Import Value & Volume, 2018-2019 ($)
Figure 38 Argentina Process Analyzer Market Value & Volume, 2021-2026 ($)
Figure 39 Argentina GDP and Population, 2018-2019 ($)
Figure 40 Argentina GDP – Composition of 2018, By Sector of Origin
Figure 41 Argentina Export and Import Value & Volume, 2018-2019 ($)
Figure 42 Ecuador Process Analyzer Market Value & Volume, 2021-2026 ($)
Figure 43 Ecuador GDP and Population, 2018-2019 ($)
Figure 44 Ecuador GDP – Composition of 2018, By Sector of Origin
Figure 45 Ecuador Export and Import Value & Volume, 2018-2019 ($)
Figure 46 Peru Process Analyzer Market Value & Volume, 2021-2026 ($)
Figure 47 Peru GDP and Population, 2018-2019 ($)
Figure 48 Peru GDP – Composition of 2018, By Sector of Origin
Figure 49 Peru Export and Import Value & Volume, 2018-2019 ($)
Figure 50 Colombia Process Analyzer Market Value & Volume, 2021-2026 ($)
Figure 51 Colombia GDP and Population, 2018-2019 ($)
Figure 52 Colombia GDP – Composition of 2018, By Sector of Origin
Figure 53 Colombia Export and Import Value & Volume, 2018-2019 ($)
Figure 54 Costa Rica Process Analyzer MarketCosta Rica 3D Printing Market Value & Volume, 2021-2026 ($)
Figure 55 Costa Rica GDP and Population, 2018-2019 ($)
Figure 56 Costa Rica GDP – Composition of 2018, By Sector of Origin
Figure 57 Costa Rica Export and Import Value & Volume, 2018-2019 ($)
Figure 58 Europe Process Analyzer Market Value & Volume, 2021-2026 ($)
Figure 59 U.K Process Analyzer Market Value & Volume, 2021-2026 ($)
Figure 60 U.K GDP and Population, 2018-2019 ($)
Figure 61 U.K GDP – Composition of 2018, By Sector of Origin
Figure 62 U.K Export and Import Value & Volume, 2018-2019 ($)
Figure 63 Germany Process Analyzer Market Value & Volume, 2021-2026 ($)
Figure 64 Germany GDP and Population, 2018-2019 ($)
Figure 65 Germany GDP – Composition of 2018, By Sector of Origin
Figure 66 Germany Export and Import Value & Volume, 2018-2019 ($)
Figure 67 Italy Process Analyzer Market Value & Volume, 2021-2026 ($)
Figure 68 Italy GDP and Population, 2018-2019 ($)
Figure 69 Italy GDP – Composition of 2018, By Sector of Origin
Figure 70 Italy Export and Import Value & Volume, 2018-2019 ($)
Figure 71 France Process Analyzer Market Value & Volume, 2021-2026 ($)
Figure 72 France GDP and Population, 2018-2019 ($)
Figure 73 France GDP – Composition of 2018, By Sector of Origin
Figure 74 France Export and Import Value & Volume, 2018-2019 ($)
Figure 75 Netherlands Process Analyzer Market Value & Volume, 2021-2026 ($)
Figure 76 Netherlands GDP and Population, 2018-2019 ($)
Figure 77 Netherlands GDP – Composition of 2018, By Sector of Origin
Figure 78 Netherlands Export and Import Value & Volume, 2018-2019 ($)
Figure 79 Belgium Process Analyzer Market Value & Volume, 2021-2026 ($)
Figure 80 Belgium GDP and Population, 2018-2019 ($)
Figure 81 Belgium GDP – Composition of 2018, By Sector of Origin
Figure 82 Belgium Export and Import Value & Volume, 2018-2019 ($)
Figure 83 Spain Process Analyzer Market Value & Volume, 2021-2026 ($)
Figure 84 Spain GDP and Population, 2018-2019 ($)
Figure 85 Spain GDP – Composition of 2018, By Sector of Origin
Figure 86 Spain Export and Import Value & Volume, 2018-2019 ($)
Figure 87 Denmark Process Analyzer Market Value & Volume, 2021-2026 ($)
Figure 88 Denmark GDP and Population, 2018-2019 ($)
Figure 89 Denmark GDP – Composition of 2018, By Sector of Origin
Figure 90 Denmark Export and Import Value & Volume, 2018-2019 ($)
Figure 91 APAC Process Analyzer Market Value & Volume, 2021-2026 ($)
Figure 92 China Process Analyzer MarketValue & Volume, 2021-2026
Figure 93 China GDP and Population, 2018-2019 ($)
Figure 94 China GDP – Composition of 2018, By Sector of Origin
Figure 95 China Export and Import Value & Volume, 2018-2019 ($)Process Analyzer MarketChina Export and Import Value & Volume, 2018-2019 ($)
Figure 96 Australia Process Analyzer Market Value & Volume, 2021-2026 ($)
Figure 97 Australia GDP and Population, 2018-2019 ($)
Figure 98 Australia GDP – Composition of 2018, By Sector of Origin
Figure 99 Australia Export and Import Value & Volume, 2018-2019 ($)
Figure 100 South Korea Process Analyzer Market Value & Volume, 2021-2026 ($)
Figure 101 South Korea GDP and Population, 2018-2019 ($)
Figure 102 South Korea GDP – Composition of 2018, By Sector of Origin
Figure 103 South Korea Export and Import Value & Volume, 2018-2019 ($)
Figure 104 India Process Analyzer Market Value & Volume, 2021-2026 ($)
Figure 105 India GDP and Population, 2018-2019 ($)
Figure 106 India GDP – Composition of 2018, By Sector of Origin
Figure 107 India Export and Import Value & Volume, 2018-2019 ($)
Figure 108 Taiwan Process Analyzer MarketTaiwan 3D Printing Market Value & Volume, 2021-2026 ($)
Figure 109 Taiwan GDP and Population, 2018-2019 ($)
Figure 110 Taiwan GDP – Composition of 2018, By Sector of Origin
Figure 111 Taiwan Export and Import Value & Volume, 2018-2019 ($)
Figure 112 Malaysia Process Analyzer MarketMalaysia 3D Printing Market Value & Volume, 2021-2026 ($)
Figure 113 Malaysia GDP and Population, 2018-2019 ($)
Figure 114 Malaysia GDP – Composition of 2018, By Sector of Origin
Figure 115 Malaysia Export and Import Value & Volume, 2018-2019 ($)
Figure 116 Hong Kong Process Analyzer MarketHong Kong 3D Printing Market Value & Volume, 2021-2026 ($)
Figure 117 Hong Kong GDP and Population, 2018-2019 ($)
Figure 118 Hong Kong GDP – Composition of 2018, By Sector of Origin
Figure 119 Hong Kong Export and Import Value & Volume, 2018-2019 ($)
Figure 120 Middle East & Africa Process Analyzer MarketMiddle East & Africa 3D Printing Market Value & Volume, 2021-2026 ($)
Figure 121 Russia Process Analyzer MarketRussia 3D Printing Market Value & Volume, 2021-2026 ($)
Figure 122 Russia GDP and Population, 2018-2019 ($)
Figure 123 Russia GDP – Composition of 2018, By Sector of Origin
Figure 124 Russia Export and Import Value & Volume, 2018-2019 ($)
Figure 125 Israel Process Analyzer Market Value & Volume, 2021-2026 ($)
Figure 126 Israel GDP and Population, 2018-2019 ($)
Figure 127 Israel GDP – Composition of 2018, By Sector of Origin
Figure 128 Israel Export and Import Value & Volume, 2018-2019 ($)
Figure 129 Entropy Share, By Strategies, 2018-2019* (%)Process Analyzer Market
Figure 130 Developments, 2018-2019*Process Analyzer Market
Figure 131 Company 1 Process Analyzer Market Net Revenue, By Years, 2018-2019* ($)
Figure 132 Company 1 Process Analyzer Market Net Revenue Share, By Business segments, 2018 (%)
Figure 133 Company 1 Process Analyzer Market Net Sales Share, By Geography, 2018 (%)
Figure 134 Company 2 Process Analyzer Market Net Revenue, By Years, 2018-2019* ($)
Figure 135 Company 2 Process Analyzer Market Net Revenue Share, By Business segments, 2018 (%)
Figure 136 Company 2 Process Analyzer Market Net Sales Share, By Geography, 2018 (%)
Figure 137 Company 3Process Analyzer Market Net Revenue, By Years, 2018-2019* ($)
Figure 138 Company 3Process Analyzer Market Net Revenue Share, By Business segments, 2018 (%)
Figure 139 Company 3Process Analyzer Market Net Sales Share, By Geography, 2018 (%)
Figure 140 Company 4 Process Analyzer Market Net Revenue, By Years, 2018-2019* ($)
Figure 141 Company 4 Process Analyzer Market Net Revenue Share, By Business segments, 2018 (%)
Figure 142 Company 4 Process Analyzer Market Net Sales Share, By Geography, 2018 (%)
Figure 143 Company 5 Process Analyzer Market Net Revenue, By Years, 2018-2019* ($)
Figure 144 Company 5 Process Analyzer Market Net Revenue Share, By Business segments, 2018 (%)
Figure 145 Company 5 Process Analyzer Market Net Sales Share, By Geography, 2018 (%)
Figure 146 Company 6 Process Analyzer Market Net Revenue, By Years, 2018-2019* ($)
Figure 147 Company 6 Process Analyzer Market Net Revenue Share, By Business segments, 2018 (%)
Figure 148 Company 6 Process Analyzer Market Net Sales Share, By Geography, 2018 (%)
Figure 149 Company 7 Process Analyzer Market Net Revenue, By Years, 2018-2019* ($)
Figure 150 Company 7 Process Analyzer Market Net Revenue Share, By Business segments, 2018 (%)
Figure 151 Company 7 Process Analyzer Market Net Sales Share, By Geography, 2018 (%)
Figure 152 Company 8 Process Analyzer Market Net Revenue, By Years, 2018-2019* ($)
Figure 153 Company 8 Process Analyzer Market Net Revenue Share, By Business segments, 2018 (%)
Figure 154 Company 8 Process Analyzer Market Net Sales Share, By Geography, 2018 (%)
Figure 155 Company 9 Process Analyzer Market Net Revenue, By Years, 2018-2019* ($)
Figure 156 Company 9 Process Analyzer Market Net Revenue Share, By Business segments, 2018 (%)
Figure 157 Company 9 Process Analyzer Market Net Sales Share, By Geography, 2018 (%)
Figure 158 Company 10 Process Analyzer Market Net Revenue, By Years, 2018-2019* ($)
Figure 159 Company 10 Process Analyzer Market Net Revenue Share, By Business segments, 2018 (%)
Figure 160 Company 10 Process Analyzer Market Net Sales Share, By Geography, 2018 (%)
Figure 161 Company 11 Process Analyzer Market Net Revenue, By Years, 2018-2019* ($)
Figure 162 Company 11 Process Analyzer Market Net Revenue Share, By Business segments, 2018 (%)
Figure 163 Company 11 Process Analyzer Market Net Sales Share, By Geography, 2018 (%)
Figure 164 Company 12 Process Analyzer Market Net Revenue, By Years, 2018-2019* ($)
Figure 165 Company 12 Process Analyzer Market Net Revenue Share, By Business segments, 2018 (%)
Figure 166 Company 12 Process Analyzer Market Net Sales Share, By Geography, 2018 (%)
Figure 167 Company 13Process Analyzer Market Net Revenue, By Years, 2018-2019* ($)
Figure 168 Company 13Process Analyzer Market Net Revenue Share, By Business segments, 2018 (%)
Figure 169 Company 13Process Analyzer Market Net Sales Share, By Geography, 2018 (%)
Figure 170 Company 14 Process Analyzer Market Net Revenue, By Years, 2018-2019* ($)
Figure 171 Company 14 Process Analyzer Market Net Revenue Share, By Business segments, 2018 (%)
Figure 172 Company 14 Process Analyzer Market Net Sales Share, By Geography, 2018 (%)
Figure 173 Company 15 Process Analyzer Market Net Revenue, By Years, 2018-2019* ($)
Figure 174 Company 15 Process Analyzer Market Net Revenue Share, By Business segments, 2018 (%)
Figure 175 Company 15 Process Analyzer Market Net Sales Share, By Geography, 2018 (%)