 Email
Email Print
Print


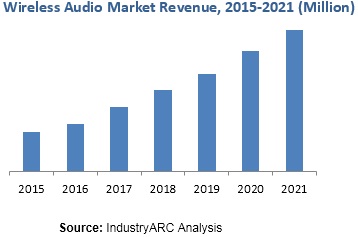
Wireless Audio Systems, as the name suggests, transfer audio signals from one place to another without the use of wires. Wireless Audio System usually uses Radio Frequency (RF). In some cases, Electromagnetic Waves are also used. The main benefit of Wireless Audio System is that, there are no interconnecting wires and hence, no need for worries regarding the wear and tear of intermediate components. Since past few years, there has been a tremendous growth in the market share of Wireless Audio Systems. Wireless Communications has also played an instrumental role in the growth of Semi-Conductor and Electronic devices.
Wireless Audio Market Report provides a detailed analysis on the industry by Technology, By type of products, By Frequency Range, By Application and By Geography. The market has been segmented by Technology into Wi-fi, Bluetooth, Airplay, Sonos, DLNA and few others. Further segregation is done on the basis of Frequency Bandwidth into various ranges such as 500-694 MHz, 900-928 MHz and few others. The Wireless Audio is classified into types of products such as Microphone, Speakers, Radio, Headphones and others. The Wireless Audio System is used in various areas such as Sporting Events, Music Concerts, TV & Radio Broadcasting and few others.
The Americas accounted for the largest share in the Wireless Audio Market in terms of value as well as the volume in recent years. Within Americas, The U.S. is at the forefront amongst all the other countries in terms of commercializing new technologies. Europe followed closely due to the large wireless audio market in TV broadcasting. The APAC region is the fastest growing market for Wireless Audio Systems as the improving economy combined with growing consumer electronics market is said to drive the demand for wireless audio.
The key players of the Wireless Audio Market are listed below:
The methodology involved in estimating the Wireless Audio Market is highly depended on the Technology type. The Bluetooth technology has been forecasted to dominate the Wireless Audio Market because of its higher throughput, more ubiquitous usage and linking with Wi-Fi and Ultra-Wide Band (UWB) broadcast technology. The companies involved in Wireless Audio are also studied from the perspective of their product portfolio, annual turnover and few other parameters. These data were further validated with industry experts both at technical and market levels.
Wireless Audio Market Report provides a detailed analysis on the industry by Technology, By type of products, By Frequency Range, By Application and By Geography. The market has been segmented by Technology into Wi-fi, Bluetooth, Airplay, Sonos, DLNA and few others. Further segregation is done on the basis of Frequency Bandwidth into various ranges such as 500-694 MHz, 900-928 MHz and few others. The Wireless Audio is classified into types of products such as Microphone, Speakers, Radio, Headphones and others. The Wireless Audio System is used in various areas such as Sporting Events, Music Concerts, TV & Radio Broadcasting and few others.
The Americas accounted for the largest share in the Wireless Audio Market in terms of value as well as the volume in recent years. Within Americas, The U.S. is at the forefront amongst all the other countries in terms of commercializing new technologies. Europe followed closely due to the large wireless audio market in TV broadcasting. The APAC region is the fastest growing market for Wireless Audio Systems as the improving economy combined with growing consumer electronics market is said to drive the demand for wireless audio.
The key players of the Wireless Audio Market are listed below:
- Apple, Inc. (The U.S.)
- Bose Corporation (The U.S.)
- Sonos, Inc. (The U.S.)
- Dei Holdings, Inc. (The U.S.)
- Harman International Industries, Inc. (The U.S.)
- Samsung Group (South Korea)
The methodology involved in estimating the Wireless Audio Market is highly depended on the Technology type. The Bluetooth technology has been forecasted to dominate the Wireless Audio Market because of its higher throughput, more ubiquitous usage and linking with Wi-Fi and Ultra-Wide Band (UWB) broadcast technology. The companies involved in Wireless Audio are also studied from the perspective of their product portfolio, annual turnover and few other parameters. These data were further validated with industry experts both at technical and market levels.
1. Wireless Audio – Market Overview
1.1. Introduction
1.2. Market Scope
1.3. Stakeholders
2. Wireless Audio - Executive Summary
3. Wireless Audio – Market Landscape
3.1. Market Share Analysis
3.1.1. Comprehensive Market Share Analysis
3.2. Comparative Analysis
3.2.1. Competitor Benchmarking
3.2.2. Competitor Financial Analysis
3.2.3. Patent Analysis
3.2.4. End-User Profiling
4. Wireless Audio – Market Forces
4.1. Market Drivers
4.2. Market Constraints
4.3. Market Challenges
4.4. Attractiveness of the Smart Parking Solutions Industry
4.4.1. Power of Suppliers
4.4.2. Power of Customers
4.4.3. Threat of New entrants
4.4.4. Threat of Substitution
4.4.5. Degree of Competition
5. Wireless Audio – Strategic Analysis
5.1. Value Chain Analysis
5.2. Pricing Analysis
5.2.1. Influencing Factor Analysis
5.2.2. Forecast of Prices
5.3. Opportunities Analysis
5.4. Product/Market Life Cycle Analysis
6. Wireless Audio – By technology
6.1. Introduction
6.2. Bluetooth
6.3. Wi-fi
6.4. Airplay
6.5. Sonos
6.6. DLNA
6.7. Others
7. Wireless Audio – By Frequency Range
7.1. Introduction
7.2. 500-694 MHz
7.3. 900-928 MHz
7.4. Others
8. Wireless Audio – By type of products
8.1. Introduction
8.2. Microphones
8.3. Headphones
8.4. Speaker
8.5. Soundbar
8.6. Radio
8.7. Others
9. Wireless Audio – By application
9.1. Introduction
9.2. Consumer Electronics
9.3. Automotive
9.4. Commercial
9.4.1. Musical Events
9.4.2. Sporting events
9.5. Communication technology
9.6. Others
10. Wireless Audio Market - By Geography
10.1. Introduction
10.2. Americas
10.2.1. The U.S.
10.2.2. Canada
10.3. Europe
10.3.1. Germany
10.3.2. U.K.
10.3.3. Others
10.4. Asia-Pacific
10.4.1. China
10.4.2. Japan
10.4.3. South Korea
10.4.4. Others
10.5. Rest Of the World
11. Market Entropy
11.1. Introduction
11.2. Product Launches - Most Dominant Strategy
11.3. Mergers, Agreements & Partnerships
11.4. Acquisitions and Others
12. Company Profiles
"*Financials would be provided on a best efforts basis for private companies"
13. Appendix
13.1. Abbreviations
13.2. Sources
13.3. Research Methodology
13.4. Compilation of Expert Insights
13.5. Disclaimer
1.1. Introduction
1.2. Market Scope
1.3. Stakeholders
2. Wireless Audio - Executive Summary
3. Wireless Audio – Market Landscape
3.1. Market Share Analysis
3.1.1. Comprehensive Market Share Analysis
3.2. Comparative Analysis
3.2.1. Competitor Benchmarking
3.2.2. Competitor Financial Analysis
3.2.3. Patent Analysis
3.2.4. End-User Profiling
4. Wireless Audio – Market Forces
4.1. Market Drivers
4.2. Market Constraints
4.3. Market Challenges
4.4. Attractiveness of the Smart Parking Solutions Industry
4.4.1. Power of Suppliers
4.4.2. Power of Customers
4.4.3. Threat of New entrants
4.4.4. Threat of Substitution
4.4.5. Degree of Competition
5. Wireless Audio – Strategic Analysis
5.1. Value Chain Analysis
5.2. Pricing Analysis
5.2.1. Influencing Factor Analysis
5.2.2. Forecast of Prices
5.3. Opportunities Analysis
5.4. Product/Market Life Cycle Analysis
6. Wireless Audio – By technology
6.1. Introduction
6.2. Bluetooth
6.3. Wi-fi
6.4. Airplay
6.5. Sonos
6.6. DLNA
6.7. Others
7. Wireless Audio – By Frequency Range
7.1. Introduction
7.2. 500-694 MHz
7.3. 900-928 MHz
7.4. Others
8. Wireless Audio – By type of products
8.1. Introduction
8.2. Microphones
8.3. Headphones
8.4. Speaker
8.5. Soundbar
8.6. Radio
8.7. Others
9. Wireless Audio – By application
9.1. Introduction
9.2. Consumer Electronics
9.3. Automotive
9.4. Commercial
9.4.1. Musical Events
9.4.2. Sporting events
9.5. Communication technology
9.6. Others
10. Wireless Audio Market - By Geography
10.1. Introduction
10.2. Americas
10.2.1. The U.S.
10.2.2. Canada
10.3. Europe
10.3.1. Germany
10.3.2. U.K.
10.3.3. Others
10.4. Asia-Pacific
10.4.1. China
10.4.2. Japan
10.4.3. South Korea
10.4.4. Others
10.5. Rest Of the World
11. Market Entropy
11.1. Introduction
11.2. Product Launches - Most Dominant Strategy
11.3. Mergers, Agreements & Partnerships
11.4. Acquisitions and Others
12. Company Profiles
12.1. Company 1
12.2. Company 2
12.3. Company 3
12.4. Company 4
12.5. Company 5
12.6. Company 6
12.7. Company 7
12.8. Company 8
12.9. Company 9
12.10. Company 10
*More than 40 Companies are profiled in this Research Report, Complete List available on Request*"*Financials would be provided on a best efforts basis for private companies"
13. Appendix
13.1. Abbreviations
13.2. Sources
13.3. Research Methodology
13.4. Compilation of Expert Insights
13.5. Disclaimer
List of Table:
Table 1: Wireless Audio Market Overview 2021-2026
Table 2: Wireless Audio Market Leader Analysis 2018-2019 (US$)
Table 3: Wireless Audio Market Product Analysis 2018-2019 (US$)
Table 4: Wireless Audio Market End User Analysis 2018-2019 (US$)
Table 5: Wireless Audio Market Patent Analysis 2013-2018* (US$)
Table 6: Wireless Audio Market Financial Analysis 2018-2019 (US$)
Table 7: Wireless Audio Market Driver Analysis 2018-2019 (US$)
Table 8: Wireless Audio Market Challenges Analysis 2018-2019 (US$)
Table 9: Wireless Audio Market Constraint Analysis 2018-2019 (US$)
Table 10: Wireless Audio Market Supplier Bargaining Power Analysis 2018-2019 (US$)
Table 11: Wireless Audio Market Buyer Bargaining Power Analysis 2018-2019 (US$)
Table 12: Wireless Audio Market Threat of Substitutes Analysis 2018-2019 (US$)
Table 13: Wireless Audio Market Threat of New Entrants Analysis 2018-2019 (US$)
Table 14: Wireless Audio Market Degree of Competition Analysis 2018-2019 (US$)
Table 15: Wireless Audio Market Value Chain Analysis 2018-2019 (US$)
Table 16: Wireless Audio Market Pricing Analysis 2021-2026 (US$)
Table 17: Wireless Audio Market Opportunities Analysis 2021-2026 (US$)
Table 18: Wireless Audio Market Product Life Cycle Analysis 2021-2026 (US$)
Table 19: Wireless Audio Market Supplier Analysis 2018-2019 (US$)
Table 20: Wireless Audio Market Distributor Analysis 2018-2019 (US$)
Table 21: Wireless Audio Market Trend Analysis 2018-2019 (US$)
Table 22: Wireless Audio Market Size 2018 (US$)
Table 23: Wireless Audio Market Forecast Analysis 2021-2026 (US$)
Table 24: Wireless Audio Market Sales Forecast Analysis 2021-2026 (Units)
Table 25: Wireless Audio Market, Revenue & Volume,By Technology, 2021-2026 ($)
Table 26: Wireless Audio MarketBy Technology, Revenue & Volume,By Bluetooth, 2021-2026 ($)
Table 27: Wireless Audio MarketBy Technology, Revenue & Volume,By Wi-fi, 2021-2026 ($)
Table 28: Wireless Audio MarketBy Technology, Revenue & Volume,By Airplay, 2021-2026 ($)
Table 29: Wireless Audio MarketBy Technology, Revenue & Volume,By Sonos, 2021-2026 ($)
Table 30: Wireless Audio MarketBy Technology, Revenue & Volume,By DLNA, 2021-2026 ($)
Table 31: Wireless Audio Market, Revenue & Volume,By Application, 2021-2026 ($)
Table 32: Wireless Audio MarketBy Application, Revenue & Volume,By Consumer Electronics, 2021-2026 ($)
Table 33: Wireless Audio MarketBy Application, Revenue & Volume,By Automotive , 2021-2026 ($)
Table 34: Wireless Audio MarketBy Application, Revenue & Volume,By Commercial, 2021-2026 ($)
Table 35: Wireless Audio MarketBy Application, Revenue & Volume,By Communication technology, 2021-2026 ($)
Table 36: Wireless Audio Market, Revenue & Volume,By Frequency Range, 2021-2026 ($)
Table 37: Wireless Audio MarketBy Frequency Range, Revenue & Volume,By 500-694 MHz, 2021-2026 ($)
Table 38: Wireless Audio MarketBy Frequency Range, Revenue & Volume,By 900-928 MHz, 2021-2026 ($)
Table 39: North America Wireless Audio Market, Revenue & Volume,By Technology, 2021-2026 ($)
Table 40: North America Wireless Audio Market, Revenue & Volume,By Application, 2021-2026 ($)
Table 41: North America Wireless Audio Market, Revenue & Volume,By Frequency Range, 2021-2026 ($)
Table 42: South america Wireless Audio Market, Revenue & Volume,By Technology, 2021-2026 ($)
Table 43: South america Wireless Audio Market, Revenue & Volume,By Application, 2021-2026 ($)
Table 44: South america Wireless Audio Market, Revenue & Volume,By Frequency Range, 2021-2026 ($)
Table 45: Europe Wireless Audio Market, Revenue & Volume,By Technology, 2021-2026 ($)
Table 46: Europe Wireless Audio Market, Revenue & Volume,By Application, 2021-2026 ($)
Table 47: Europe Wireless Audio Market, Revenue & Volume,By Frequency Range, 2021-2026 ($)
Table 48: APAC Wireless Audio Market, Revenue & Volume,By Technology, 2021-2026 ($)
Table 49: APAC Wireless Audio Market, Revenue & Volume,By Application, 2021-2026 ($)
Table 50: APAC Wireless Audio Market, Revenue & Volume,By Frequency Range, 2021-2026 ($)
Table 51: Middle East & Africa Wireless Audio Market, Revenue & Volume,By Technology, 2021-2026 ($)
Table 52: Middle East & Africa Wireless Audio Market, Revenue & Volume,By Application, 2021-2026 ($)
Table 53: Middle East & Africa Wireless Audio Market, Revenue & Volume,By Frequency Range, 2021-2026 ($)
Table 54: Russia Wireless Audio Market, Revenue & Volume,By Technology, 2021-2026 ($)
Table 55: Russia Wireless Audio Market, Revenue & Volume,By Application, 2021-2026 ($)
Table 56: Russia Wireless Audio Market, Revenue & Volume,By Frequency Range, 2021-2026 ($)
Table 57: Israel Wireless Audio Market, Revenue & Volume,By Technology, 2021-2026 ($)
Table 58: Israel Wireless Audio Market, Revenue & Volume,By Application, 2021-2026 ($)
Table 59: Israel Wireless Audio Market, Revenue & Volume,By Frequency Range, 2021-2026 ($)
Table 60: Top Companies 2018 (US$)Wireless Audio Market, Revenue & Volume
Table 61: Product Launch 2018-2019Wireless Audio Market, Revenue & Volume
Table 62: Mergers & Acquistions 2018-2019Wireless Audio Market, Revenue & Volume
List of Figures:
Figure 1: Overview of Wireless Audio Market 2021-2026
Figure 2: Market Share Analysis for Wireless Audio Market 2018 (US$)
Figure 3: Product Comparison in Wireless Audio Market 2018-2019 (US$)
Figure 4: End User Profile for Wireless Audio Market 2018-2019 (US$)
Figure 5: Patent Application and Grant in Wireless Audio Market 2013-2018* (US$)
Figure 6: Top 5 Companies Financial Analysis in Wireless Audio Market 2018-2019 (US$)
Figure 7: Market Entry Strategy in Wireless Audio Market 2018-2019
Figure 8: Ecosystem Analysis in Wireless Audio Market2018
Figure 9: Average Selling Price in Wireless Audio Market 2021-2026
Figure 10: Top Opportunites in Wireless Audio Market 2018-2019
Figure 11: Market Life Cycle Analysis in Wireless Audio Market
Figure 12: GlobalBy TechnologyWireless Audio Market Revenue, 2021-2026 ($)
Figure 13: GlobalBy ApplicationWireless Audio Market Revenue, 2021-2026 ($)
Figure 14: GlobalBy Frequency RangeWireless Audio Market Revenue, 2021-2026 ($)
Figure 15: Global Wireless Audio Market - By Geography
Figure 16: Global Wireless Audio Market Value & Volume, By Geography, 2021-2026 ($)
Figure 17: Global Wireless Audio Market CAGR, By Geography, 2021-2026 (%)
Figure 18: North America Wireless Audio Market Value & Volume, 2021-2026 ($)
Figure 19: US Wireless Audio Market Value & Volume, 2021-2026 ($)
Figure 20: US GDP and Population, 2018-2019 ($)
Figure 21: US GDP – Composition of 2018, By Sector of Origin
Figure 22: US Export and Import Value & Volume, 2018-2019 ($)
Figure 23: Canada Wireless Audio Market Value & Volume, 2021-2026 ($)
Figure 24: Canada GDP and Population, 2018-2019 ($)
Figure 25: Canada GDP – Composition of 2018, By Sector of Origin
Figure 26: Canada Export and Import Value & Volume, 2018-2019 ($)
Figure 27: Mexico Wireless Audio Market Value & Volume, 2021-2026 ($)
Figure 28: Mexico GDP and Population, 2018-2019 ($)
Figure 29: Mexico GDP – Composition of 2018, By Sector of Origin
Figure 30: Mexico Export and Import Value & Volume, 2018-2019 ($)
Figure 31: South America Wireless Audio MarketSouth America 3D Printing Market Value & Volume, 2021-2026 ($)
Figure 32: Brazil Wireless Audio Market Value & Volume, 2021-2026 ($)
Figure 33: Brazil GDP and Population, 2018-2019 ($)
Figure 34: Brazil GDP – Composition of 2018, By Sector of Origin
Figure 35: Brazil Export and Import Value & Volume, 2018-2019 ($)
Figure 36: Venezuela Wireless Audio Market Value & Volume, 2021-2026 ($)
Figure 37: Venezuela GDP and Population, 2018-2019 ($)
Figure 38: Venezuela GDP – Composition of 2018, By Sector of Origin
Figure 39: Venezuela Export and Import Value & Volume, 2018-2019 ($)
Figure 40: Argentina Wireless Audio Market Value & Volume, 2021-2026 ($)
Figure 41: Argentina GDP and Population, 2018-2019 ($)
Figure 42: Argentina GDP – Composition of 2018, By Sector of Origin
Figure 43: Argentina Export and Import Value & Volume, 2018-2019 ($)
Figure 44: Ecuador Wireless Audio Market Value & Volume, 2021-2026 ($)
Figure 45: Ecuador GDP and Population, 2018-2019 ($)
Figure 46: Ecuador GDP – Composition of 2018, By Sector of Origin
Figure 47: Ecuador Export and Import Value & Volume, 2018-2019 ($)
Figure 48: Peru Wireless Audio Market Value & Volume, 2021-2026 ($)
Figure 49: Peru GDP and Population, 2018-2019 ($)
Figure 50: Peru GDP – Composition of 2018, By Sector of Origin
Figure 51: Peru Export and Import Value & Volume, 2018-2019 ($)
Figure 52: Colombia Wireless Audio Market Value & Volume, 2021-2026 ($)
Figure 53: Colombia GDP and Population, 2018-2019 ($)
Figure 54: Colombia GDP – Composition of 2018, By Sector of Origin
Figure 55: Colombia Export and Import Value & Volume, 2018-2019 ($)
Figure 56: Costa Rica Wireless Audio MarketCosta Rica 3D Printing Market Value & Volume, 2021-2026 ($)
Figure 57: Costa Rica GDP and Population, 2018-2019 ($)
Figure 58: Costa Rica GDP – Composition of 2018, By Sector of Origin
Figure 59: Costa Rica Export and Import Value & Volume, 2018-2019 ($)
Figure 60: Europe Wireless Audio Market Value & Volume, 2021-2026 ($)
Figure 61: U.K Wireless Audio Market Value & Volume, 2021-2026 ($)
Figure 62: U.K GDP and Population, 2018-2019 ($)
Figure 63: U.K GDP – Composition of 2018, By Sector of Origin
Figure 64: U.K Export and Import Value & Volume, 2018-2019 ($)
Figure 65: Germany Wireless Audio Market Value & Volume, 2021-2026 ($)
Figure 66: Germany GDP and Population, 2018-2019 ($)
Figure 67: Germany GDP – Composition of 2018, By Sector of Origin
Figure 68: Germany Export and Import Value & Volume, 2018-2019 ($)
Figure 69: Italy Wireless Audio Market Value & Volume, 2021-2026 ($)
Figure 70: Italy GDP and Population, 2018-2019 ($)
Figure 71: Italy GDP – Composition of 2018, By Sector of Origin
Figure 72: Italy Export and Import Value & Volume, 2018-2019 ($)
Figure 73: France Wireless Audio Market Value & Volume, 2021-2026 ($)
Figure 74: France GDP and Population, 2018-2019 ($)
Figure 75: France GDP – Composition of 2018, By Sector of Origin
Figure 76: France Export and Import Value & Volume, 2018-2019 ($)
Figure 77: Netherlands Wireless Audio Market Value & Volume, 2021-2026 ($)
Figure 78: Netherlands GDP and Population, 2018-2019 ($)
Figure 79: Netherlands GDP – Composition of 2018, By Sector of Origin
Figure 80: Netherlands Export and Import Value & Volume, 2018-2019 ($)
Figure 81: Belgium Wireless Audio Market Value & Volume, 2021-2026 ($)
Figure 82: Belgium GDP and Population, 2018-2019 ($)
Figure 83: Belgium GDP – Composition of 2018, By Sector of Origin
Figure 84: Belgium Export and Import Value & Volume, 2018-2019 ($)
Figure 85: Spain Wireless Audio Market Value & Volume, 2021-2026 ($)
Figure 86: Spain GDP and Population, 2018-2019 ($)
Figure 87: Spain GDP – Composition of 2018, By Sector of Origin
Figure 88: Spain Export and Import Value & Volume, 2018-2019 ($)
Figure 89: Denmark Wireless Audio Market Value & Volume, 2021-2026 ($)
Figure 90: Denmark GDP and Population, 2018-2019 ($)
Figure 91: Denmark GDP – Composition of 2018, By Sector of Origin
Figure 92: Denmark Export and Import Value & Volume, 2018-2019 ($)
Figure 93: APAC Wireless Audio Market Value & Volume, 2021-2026 ($)
Figure 94: China Wireless Audio MarketValue & Volume, 2021-2026
Figure 95: China GDP and Population, 2018-2019 ($)
Figure 96: China GDP – Composition of 2018, By Sector of Origin
Figure 97: China Export and Import Value & Volume, 2018-2019 ($)Wireless Audio MarketChina Export and Import Value & Volume, 2018-2019 ($)
Figure 98: Australia Wireless Audio Market Value & Volume, 2021-2026 ($)
Figure 99: Australia GDP and Population, 2018-2019 ($)
Figure 100: Australia GDP – Composition of 2018, By Sector of Origin
Figure 101: Australia Export and Import Value & Volume, 2018-2019 ($)
Figure 102: South Korea Wireless Audio Market Value & Volume, 2021-2026 ($)
Figure 103: South Korea GDP and Population, 2018-2019 ($)
Figure 104: South Korea GDP – Composition of 2018, By Sector of Origin
Figure 105: South Korea Export and Import Value & Volume, 2018-2019 ($)
Figure 106: India Wireless Audio Market Value & Volume, 2021-2026 ($)
Figure 107: India GDP and Population, 2018-2019 ($)
Figure 108: India GDP – Composition of 2018, By Sector of Origin
Figure 109: India Export and Import Value & Volume, 2018-2019 ($)
Figure 110: Taiwan Wireless Audio MarketTaiwan 3D Printing Market Value & Volume, 2021-2026 ($)
Figure 111: Taiwan GDP and Population, 2018-2019 ($)
Figure 112: Taiwan GDP – Composition of 2018, By Sector of Origin
Figure 113: Taiwan Export and Import Value & Volume, 2018-2019 ($)
Figure 114: Malaysia Wireless Audio MarketMalaysia 3D Printing Market Value & Volume, 2021-2026 ($)
Figure 115: Malaysia GDP and Population, 2018-2019 ($)
Figure 116: Malaysia GDP – Composition of 2018, By Sector of Origin
Figure 117: Malaysia Export and Import Value & Volume, 2018-2019 ($)
Figure 118: Hong Kong Wireless Audio MarketHong Kong 3D Printing Market Value & Volume, 2021-2026 ($)
Figure 119: Hong Kong GDP and Population, 2018-2019 ($)
Figure 120: Hong Kong GDP – Composition of 2018, By Sector of Origin
Figure 121: Hong Kong Export and Import Value & Volume, 2018-2019 ($)
Figure 122: Middle East & Africa Wireless Audio MarketMiddle East & Africa 3D Printing Market Value & Volume, 2021-2026 ($)
Figure 123: Russia Wireless Audio MarketRussia 3D Printing Market Value & Volume, 2021-2026 ($)
Figure 124: Russia GDP and Population, 2018-2019 ($)
Figure 125: Russia GDP – Composition of 2018, By Sector of Origin
Figure 126: Russia Export and Import Value & Volume, 2018-2019 ($)
Figure 127: Israel Wireless Audio Market Value & Volume, 2021-2026 ($)
Figure 128: Israel GDP and Population, 2018-2019 ($)
Figure 129: Israel GDP – Composition of 2018, By Sector of Origin
Figure 130: Israel Export and Import Value & Volume, 2018-2019 ($)
Figure 131: Entropy Share, By Strategies, 2018-2019* (%)Wireless Audio Market
Figure 132: Developments, 2018-2019*Wireless Audio Market
Figure 133: Company 1 Wireless Audio Market Net Revenue, By Years, 2018-2019* ($)
Figure 134: Company 1 Wireless Audio Market Net Revenue Share, By Business segments, 2018 (%)
Figure 135: Company 1 Wireless Audio Market Net Sales Share, By Geography, 2018 (%)
Figure 136: Company 2 Wireless Audio Market Net Revenue, By Years, 2018-2019* ($)
Figure 137: Company 2 Wireless Audio Market Net Revenue Share, By Business segments, 2018 (%)
Figure 138: Company 2 Wireless Audio Market Net Sales Share, By Geography, 2018 (%)
Figure 139: Company 3Wireless Audio Market Net Revenue, By Years, 2018-2019* ($)
Figure 140: Company 3Wireless Audio Market Net Revenue Share, By Business segments, 2018 (%)
Figure 141: Company 3Wireless Audio Market Net Sales Share, By Geography, 2018 (%)
Figure 142: Company 4 Wireless Audio Market Net Revenue, By Years, 2018-2019* ($)
Figure 143: Company 4 Wireless Audio Market Net Revenue Share, By Business segments, 2018 (%)
Figure 144: Company 4 Wireless Audio Market Net Sales Share, By Geography, 2018 (%)
Figure 145: Company 5 Wireless Audio Market Net Revenue, By Years, 2018-2019* ($)
Figure 146: Company 5 Wireless Audio Market Net Revenue Share, By Business segments, 2018 (%)
Figure 147: Company 5 Wireless Audio Market Net Sales Share, By Geography, 2018 (%)
Figure 148: Company 6 Wireless Audio Market Net Revenue, By Years, 2018-2019* ($)
Figure 149: Company 6 Wireless Audio Market Net Revenue Share, By Business segments, 2018 (%)
Figure 150: Company 6 Wireless Audio Market Net Sales Share, By Geography, 2018 (%)
Figure 151: Company 7 Wireless Audio Market Net Revenue, By Years, 2018-2019* ($)
Figure 152: Company 7 Wireless Audio Market Net Revenue Share, By Business segments, 2018 (%)
Figure 153: Company 7 Wireless Audio Market Net Sales Share, By Geography, 2018 (%)
Figure 154: Company 8 Wireless Audio Market Net Revenue, By Years, 2018-2019* ($)
Figure 155: Company 8 Wireless Audio Market Net Revenue Share, By Business segments, 2018 (%)
Figure 156: Company 8 Wireless Audio Market Net Sales Share, By Geography, 2018 (%)
Figure 157: Company 9 Wireless Audio Market Net Revenue, By Years, 2018-2019* ($)
Figure 158: Company 9 Wireless Audio Market Net Revenue Share, By Business segments, 2018 (%)
Figure 159: Company 9 Wireless Audio Market Net Sales Share, By Geography, 2018 (%)
Figure 160: Company 10 Wireless Audio Market Net Revenue, By Years, 2018-2019* ($)
Figure 161: Company 10 Wireless Audio Market Net Revenue Share, By Business segments, 2018 (%)
Figure 162: Company 10 Wireless Audio Market Net Sales Share, By Geography, 2018 (%)
Figure 163: Company 11 Wireless Audio Market Net Revenue, By Years, 2018-2019* ($)
Figure 164: Company 11 Wireless Audio Market Net Revenue Share, By Business segments, 2018 (%)
Figure 165: Company 11 Wireless Audio Market Net Sales Share, By Geography, 2018 (%)
Figure 166: Company 12 Wireless Audio Market Net Revenue, By Years, 2018-2019* ($)
Figure 167: Company 12 Wireless Audio Market Net Revenue Share, By Business segments, 2018 (%)
Figure 168: Company 12 Wireless Audio Market Net Sales Share, By Geography, 2018 (%)
Figure 169: Company 13Wireless Audio Market Net Revenue, By Years, 2018-2019* ($)
Figure 170: Company 13Wireless Audio Market Net Revenue Share, By Business segments, 2018 (%)
Figure 171: Company 13Wireless Audio Market Net Sales Share, By Geography, 2018 (%)
Figure 172: Company 14 Wireless Audio Market Net Revenue, By Years, 2018-2019* ($)
Figure 173: Company 14 Wireless Audio Market Net Revenue Share, By Business segments, 2018 (%)
Figure 174: Company 14 Wireless Audio Market Net Sales Share, By Geography, 2018 (%)
Figure 175: Company 15 Wireless Audio Market Net Revenue, By Years, 2018-2019* ($)
Figure 176: Company 15 Wireless Audio Market Net Revenue Share, By Business segments, 2018 (%)
Figure 177: Company 15 Wireless Audio Market Net Sales Share, By Geography, 2018 (%)