 Email
Email Print
Print


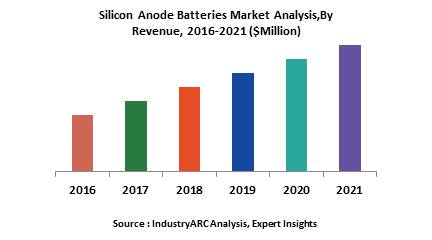
Silicon anode batteries Market - Forecast(2024 - 2030)
Batteries form an essential component for any electronic device. As such, the advancements which are made for batteries also determine how efficient and what features that consumer electronic device can do. For example, smartphones need highly efficient batteries in order to perform the number functions, which they do today. Without the ability to be powered to perform these functions, it would not have made sense for any device manufacturers to develop such products. As such, Li-ion batteries were brought in after the standard Ni-Cd batteries, which were bulkier and less efficient. Li-Ion batteries however also have their share of problems. For example, the batteries tend to bulge after prolonged use and in some cases have been known to rupture. With this in mind, device manufacturers have been looking for batteries, which have a better durability whilst also having higher power retention than the standard Li-Ion batteries. In such a case, silicon anode batteries are the next level of batteries which device manufacturers are looking for which will also help then in designing the end product.
The APAC region will be the highest contributor to the silicon anode batteries market as the end device manufacturers are the key customers for these batteries. The batteries may not become smaller than what they are currently, however, the batteries will be able to hold a lot more charge than their predecessors. The APAC market will be the leading region in this market till the end of the forecast period followed by the European market where the market for silicon anode batteries will be driven by the automotive market
The companies operating in this market will be looking at not just being able to provide silicon anode batteries for the applications for which batteries are used for today already, but will be looking at new and upcoming applications in order to penetrate the market further.
The Silicon anode batteries Market can be segmented as
Sample Companies profiled in this Report are:
The APAC region will be the highest contributor to the silicon anode batteries market as the end device manufacturers are the key customers for these batteries. The batteries may not become smaller than what they are currently, however, the batteries will be able to hold a lot more charge than their predecessors. The APAC market will be the leading region in this market till the end of the forecast period followed by the European market where the market for silicon anode batteries will be driven by the automotive market
The companies operating in this market will be looking at not just being able to provide silicon anode batteries for the applications for which batteries are used for today already, but will be looking at new and upcoming applications in order to penetrate the market further.
The Silicon anode batteries Market can be segmented as
- on the basis of application
- 3G/4G Cell Phones, Digital Cameras, Electric Bicycles, Electric vehicles, Grid & Renewable Energy Storage, Hybrid Electric vehicles, Laptops, MP4 Players, Other Microelectronic Devices, Plug-in Hybrid Electric vehicles and Tablets
- By Geography
- North America, South America, APAC, Europe, Middle East and Africa
Sample Companies profiled in this Report are:
- Amprius
- California Lithium Battery
- Enevate Corporation
- Enevate Corporation
- Los Angeles Cleantech Incubator
- 10+.
1. Silicon anode batteries Market - Overview
1.1. Definitions and Scope
2. Silicon anode batteries Market - Executive summary
2.1. Market Revenue, Market Size and Key Trends by Company
2.2. Key Trends by type of Application
2.3. Key Trends segmented by Geography
3. Silicon anode batteries Market
3.1. Comparative analysis
3.1.1. Product Benchmarking - Top 10 companies
3.1.2. Top 5 Financials Analysis
3.1.3. Market Value split by Top 10 companies
3.1.4. Patent Analysis - Top 10 companies
3.1.5. Pricing Analysis
4. Silicon anode batteries Market – Startup companies Scenario Premium
4.1. Top 10 startup company Analysis by
4.1.1. Investment
4.1.2. Revenue
4.1.3. Market Shares
4.1.4. Market Size and Application Analysis
4.1.5. Venture Capital and Funding Scenario
5. Silicon anode batteries Market – Industry Market Entry Scenario Premium
5.1. Regulatory Framework Overview
5.2. New Business and Ease of Doing business index
5.3. Case studies of successful ventures
5.4. Customer Analysis – Top 10 companies
6. Silicon anode batteries Market Forces
6.1. Drivers
6.2. Constraints
6.3. Challenges
6.4. Porters five force model
6.4.1. Bargaining power of suppliers
6.4.2. Bargaining powers of customers
6.4.3. Threat of new entrants
6.4.4. Rivalry among existing players
6.4.5. Threat of substitutes
7. Silicon anode batteries Market -Strategic analysis
7.1. Value chain analysis
7.2. Opportunities analysis
7.3. Product life cycle
7.4. Suppliers and distributors Market Share
8. Silicon anode batteries Market – By Application (Market Size -$Million / $Billion)
8.1. Market Size and Market Share Analysis
8.2. Application Revenue and Trend Research
8.3. Product Segment Analysis
8.3.1. 3G/4G Cell Phones
8.3.2. Digital Cameras
8.3.3. Electric Bicycles
8.3.4. Electric vehicles
8.3.5. Grid & Renewable Energy Storage
8.3.6. Hybrid Electric vehicles
8.3.7. Laptops
8.3.8. MP4 Players
8.3.9. Other Microelectronic Devices
8.3.10. Plug-in Hybrid Electric vehicles
8.3.11. Tablets
9. Silicon anode batteries - By Geography (Market Size -$Million / $Billion)
9.1. Silicon anode batteries Market - North America Segment Research
9.2. North America Market Research (Million / $Billion)
9.2.1. Segment type Size and Market Size Analysis
9.2.2. Revenue and Trends
9.2.3. Application Revenue and Trends by type of Application
9.2.4. Company Revenue and Product Analysis
9.2.5. North America Product type and Application Market Size
9.2.5.1. U.S.
9.2.5.2. Canada
9.2.5.3. Mexico
9.2.5.4. Rest of North America
9.3. Silicon anode batteries - South America Segment Research
9.4. South America Market Research (Market Size -$Million / $Billion)
9.4.1. Segment type Size and Market Size Analysis
9.4.2. Revenue and Trends
9.4.3. Application Revenue and Trends by type of Application
9.4.4. Company Revenue and Product Analysis
9.4.5. South America Product type and Application Market Size
9.4.5.1. Brazil
9.4.5.2. Venezuela
9.4.5.3. Argentina
9.4.5.4. Ecuador
9.4.5.5. Peru
9.4.5.6. Colombia
9.4.5.7. Costa Rica
9.4.5.8. Rest of South America
9.5. Silicon anode batteries - Europe Segment Research
9.6. Europe Market Research (Market Size -$Million / $Billion)
9.6.1. Segment type Size and Market Size Analysis
9.6.2. Revenue and Trends
9.6.3. Application Revenue and Trends by type of Application
9.6.4. Company Revenue and Product Analysis
9.6.5. Europe Segment Product type and Application Market Size
9.6.5.1. U.K
9.6.5.2. Germany
9.6.5.3. Italy
9.6.5.4. France
9.6.5.5. Netherlands
9.6.5.6. Belgium
9.6.5.7. Spain
9.6.5.8. Denmark
9.6.5.9. Rest of Europe
9.7. Silicon anode batteries – APAC Segment Research
9.8. APAC Market Research (Market Size -$Million / $Billion)
9.8.1. Segment type Size and Market Size Analysis
9.8.2. Revenue and Trends
9.8.3. Application Revenue and Trends by type of Application
9.8.4. Company Revenue and Product Analysis
9.8.5. APAC Segment – Product type and Application Market Size
9.8.5.1. China
9.8.5.2. Australia
9.8.5.3. Japan
9.8.5.4. South Korea
9.8.5.5. India
9.8.5.6. Taiwan
9.8.5.7. Malaysia
10. Silicon anode batteries Market - Entropy
10.1. New product launches
10.2. M&A's, collaborations, JVs and partnerships
11. Silicon anode batteries Market – Industry / Segment Competition landscape Premium
11.1. Market Share Analysis
11.1.1. Market Share by Country- Top companies
11.1.2. Market Share by Region- Top 10 companies
11.1.3. Market Share by type of Application – Top 10 companies
11.1.4. Market Share by type of Product / Product category- Top 10 companies
11.1.5. Market Share at global level- Top 10 companies
11.1.6. Best Practises for companies
12. Silicon anode batteries Market – Key Company List by Country Premium
13. Silicon anode batteries Market Company Analysis
13.1. Market Share, Company Revenue, Products, M&A, Developments
13.2. Amprius
13.3. California Lithium Battery
13.4. Enevate Corporation
13.5. Enevate Corporation
13.6. Los Angeles Cleantech Incubator
13.7. Nanotek Instruments
13.8. Nexeon Limited
13.9. XG Sciences
13.10. Zeptor Corporation
13.11. Company 10
13.12. Company 11
13.13. Company 12 and more
"*Financials would be provided on a best efforts basis for private companies"
14. Silicon anode batteries Market -Appendix
14.1. Abbreviations
14.2. Sources
15. Silicon anode batteries Market -Methodology Premium
15.1. Research Methodology
15.1.1. Company Expert Interviews
15.1.2. Industry Databases
15.1.3. Associations
15.1.4. Company News
15.1.5. Company Annual Reports
15.1.6. Application Trends
15.1.7. New Products and Product database
15.1.8. Company Transcripts
15.1.9. R&D Trends
15.1.10. Key Opinion Leaders Interviews
15.1.11. Supply and Demand Trends
List of Tables:
Table 1: Silicon anode batteries Market Overview 2021-2026
Table 2: Silicon anode batteries Market Leader Analysis 2018-2019 (US$)
Table 3: Silicon anode batteries Market Product Analysis 2018-2019 (US$)
Table 4: Silicon anode batteries Market End User Analysis 2018-2019 (US$)
Table 5: Silicon anode batteries Market Patent Analysis 2013-2018* (US$)
Table 6: Silicon anode batteries Market Financial Analysis 2018-2019 (US$)
Table 7: Silicon anode batteries Market Driver Analysis 2018-2019 (US$)
Table 8: Silicon anode batteries Market Challenges Analysis 2018-2019 (US$)
Table 9: Silicon anode batteries Market Constraint Analysis 2018-2019 (US$)
Table 10: Silicon anode batteries Market Supplier Bargaining Power Analysis 2018-2019 (US$)
Table 11: Silicon anode batteries Market Buyer Bargaining Power Analysis 2018-2019 (US$)
Table 12: Silicon anode batteries Market Threat of Substitutes Analysis 2018-2019 (US$)
Table 13: Silicon anode batteries Market Threat of New Entrants Analysis 2018-2019 (US$)
Table 14: Silicon anode batteries Market Degree of Competition Analysis 2018-2019 (US$)
Table 15: Silicon anode batteries Market Value Chain Analysis 2018-2019 (US$)
Table 16: Silicon anode batteries Market Pricing Analysis 2021-2026 (US$)
Table 17: Silicon anode batteries Market Opportunities Analysis 2021-2026 (US$)
Table 18: Silicon anode batteries Market Product Life Cycle Analysis 2021-2026 (US$)
Table 19: Silicon anode batteries Market Supplier Analysis 2018-2019 (US$)
Table 20: Silicon anode batteries Market Distributor Analysis 2018-2019 (US$)
Table 21: Silicon anode batteries Market Trend Analysis 2018-2019 (US$)
Table 22: Silicon anode batteries Market Size 2018 (US$)
Table 23: Silicon anode batteries Market Forecast Analysis 2021-2026 (US$)
Table 24: Silicon anode batteries Market Sales Forecast Analysis 2021-2026 (Units)
Table 25: Silicon anode batteries Market, Revenue & Volume, By Application, 2021-2026 ($)
Table 26: Silicon anode batteries Market By Application, Revenue & Volume, By 3G/4G Cell Phones, 2021-2026 ($)
Table 27: Silicon anode batteries Market By Application, Revenue & Volume, By Electric Bicycles, 2021-2026 ($)
Table 28: Silicon anode batteries Market By Application, Revenue & Volume, By Electric vehicles, 2021-2026 ($)
Table 29: Silicon anode batteries Market By Application, Revenue & Volume, By Grid & Renewable Energy Storage, 2021-2026 ($)
Table 30: Silicon anode batteries Market By Application, Revenue & Volume, By Hybrid Electric vehicles, 2021-2026 ($)
Table 31: North America Silicon anode batteries Market, Revenue & Volume, By Application, 2021-2026 ($)
Table 32: South america Silicon anode batteries Market, Revenue & Volume, By Application, 2021-2026 ($)
Table 33: Europe Silicon anode batteries Market, Revenue & Volume, By Application, 2021-2026 ($)
Table 34: APAC Silicon anode batteries Market, Revenue & Volume, By Application, 2021-2026 ($)
Table 35: Middle East & Africa Silicon anode batteries Market, Revenue & Volume, By Application, 2021-2026 ($)
Table 36: Russia Silicon anode batteries Market, Revenue & Volume, By Application, 2021-2026 ($)
Table 37: Israel Silicon anode batteries Market, Revenue & Volume, By Application, 2021-2026 ($)
Table 38: Top Companies 2018 (US$)Silicon anode batteries Market, Revenue & Volume
Table 39: Product Launch 2018-2019Silicon anode batteries Market, Revenue & Volume
Table 40: Mergers & Acquistions 2018-2019Silicon anode batteries Market, Revenue & Volume
List of Figures:
Figure 1: Overview of Silicon anode batteries Market 2021-2026
Figure 2: Market Share Analysis for Silicon anode batteries Market 2018 (US$)
Figure 3: Product Comparison in Silicon anode batteries Market 2018-2019 (US$)
Figure 4: End User Profile for Silicon anode batteries Market 2018-2019 (US$)
Figure 5: Patent Application and Grant in Silicon anode batteries Market 2013-2018* (US$)
Figure 6: Top 5 Companies Financial Analysis in Silicon anode batteries Market 2018-2019 (US$)
Figure 7: Market Entry Strategy in Silicon anode batteries Market 2018-2019
Figure 8: Ecosystem Analysis in Silicon anode batteries Market 2018
Figure 9: Average Selling Price in Silicon anode batteries Market 2021-2026
Figure 10: Top Opportunites in Silicon anode batteries Market 2018-2019
Figure 11: Market Life Cycle Analysis in Silicon anode batteries Market
Figure 12: GlobalBy ApplicationSilicon anode batteries Market Revenue, 2021-2026 ($)
Figure 13: Global Silicon anode batteries Market - By Geography
Figure 14: Global Silicon anode batteries Market Value & Volume, By Geography, 2021-2026 ($)
Figure 15: Global Silicon anode batteries Market CAGR, By Geography, 2021-2026 (%)
Figure 16: North America Silicon anode batteries Market Value & Volume, 2021-2026 ($)
Figure 17: US Silicon anode batteries Market Value & Volume, 2021-2026 ($)
Figure 18: US GDP and Population, 2018-2019 ($)
Figure 19: US GDP – Composition of 2018, By Sector of Origin
Figure 20: US Export and Import Value & Volume, 2018-2019 ($)
Figure 21: Canada Silicon anode batteries Market Value & Volume, 2021-2026 ($)
Figure 22: Canada GDP and Population, 2018-2019 ($)
Figure 23: Canada GDP – Composition of 2018, By Sector of Origin
Figure 24: Canada Export and Import Value & Volume, 2018-2019 ($)
Figure 25: Mexico Silicon anode batteries Market Value & Volume, 2021-2026 ($)
Figure 26: Mexico GDP and Population, 2018-2019 ($)
Figure 27: Mexico GDP – Composition of 2018, By Sector of Origin
Figure 28: Mexico Export and Import Value & Volume, 2018-2019 ($)
Figure 29: South America Silicon anode batteries Market Value & Volume, 2021-2026 ($)
Figure 30: Brazil Silicon anode batteries Market Value & Volume, 2021-2026 ($)
Figure 31: Brazil GDP and Population, 2018-2019 ($)
Figure 32: Brazil GDP – Composition of 2018, By Sector of Origin
Figure 33: Brazil Export and Import Value & Volume, 2018-2019 ($)
Figure 34: Venezuela Silicon anode batteries Market Value & Volume, 2021-2026 ($)
Figure 35: Venezuela GDP and Population, 2018-2019 ($)
Figure 36: Venezuela GDP – Composition of 2018, By Sector of Origin
Figure 37: Venezuela Export and Import Value & Volume, 2018-2019 ($)
Figure 38: Argentina Silicon anode batteries Market Value & Volume, 2021-2026 ($)
Figure 39: Argentina GDP and Population, 2018-2019 ($)
Figure 40: Argentina GDP – Composition of 2018, By Sector of Origin
Figure 41: Argentina Export and Import Value & Volume, 2018-2019 ($)
Figure 42: Ecuador Silicon anode batteries Market Value & Volume, 2021-2026 ($)
Figure 43: Ecuador GDP and Population, 2018-2019 ($)
Figure 44: Ecuador GDP – Composition of 2018, By Sector of Origin
Figure 45: Ecuador Export and Import Value & Volume, 2018-2019 ($)
Figure 46: Peru Silicon anode batteries Market Value & Volume, 2021-2026 ($)
Figure 47:Peru GDP and Population, 2018-2019 ($)
Figure 48: Peru GDP – Composition of 2018, By Sector of Origin
Figure 49: Peru Export and Import Value & Volume, 2018-2019 ($)
Figure 50: Colombia Silicon anode batteries Market Value & Volume, 2021-2026 ($)
Figure 51: Colombia GDP and Population, 2018-2019 ($)
Figure 52: Colombia GDP – Composition of 2018, By Sector of Origin
Figure 53: Colombia Export and Import Value & Volume, 2018-2019 ($)
Figure 54: Costa Rica Silicon anode batteries Market Value & Volume, 2021-2026 ($)
Figure 55: Costa Rica GDP and Population, 2018-2019 ($)
Figure 56: Costa Rica GDP – Composition of 2018, By Sector of Origin
Figure 57: Costa Rica Export and Import Value & Volume, 2018-2019 ($)
Figure 58: Europe Silicon anode batteries Market Value & Volume, 2021-2026 ($)
Figure 59: U.K Silicon anode batteries Market Value & Volume, 2021-2026 ($)
Figure 60: U.K GDP and Population, 2018-2019 ($)
Figure 61: U.K GDP – Composition of 2018, By Sector of Origin
Figure 62: U.K Export and Import Value & Volume, 2018-2019 ($)
Figure 63: Germany Silicon anode batteries Market Value & Volume, 2021-2026 ($)
Figure 64: Germany GDP and Population, 2018-2019 ($)
Figure 65: Germany GDP – Composition of 2018, By Sector of Origin
Figure 66: Germany Export and Import Value & Volume, 2018-2019 ($)
Figure 67: Italy Silicon anode batteries Market Value & Volume, 2021-2026 ($)
Figure 68: Italy GDP and Population, 2018-2019 ($)
Figure 69: Italy GDP – Composition of 2018, By Sector of Origin
Figure 70: Italy Export and Import Value & Volume, 2018-2019 ($)
Figure 71: France Silicon anode batteries Market Value & Volume, 2021-2026 ($)
Figure 72: France GDP and Population, 2018-2019 ($)
Figure 73: France GDP – Composition of 2018, By Sector of Origin
Figure 74: France Export and Import Value & Volume, 2018-2019 ($)
Figure 75: Netherlands Silicon anode batteries Market Value & Volume, 2021-2026 ($)
Figure 76: Netherlands GDP and Population, 2018-2019 ($)
Figure 77: Netherlands GDP – Composition of 2018, By Sector of Origin
Figure 78: Netherlands Export and Import Value & Volume, 2018-2019 ($)
Figure 79: Belgium Silicon anode batteries Market Value & Volume, 2021-2026 ($)
Figure 80: Belgium GDP and Population, 2018-2019 ($)
Figure 81: Belgium GDP – Composition of 2018, By Sector of Origin
Figure 82: Belgium Export and Import Value & Volume, 2018-2019 ($)
Figure 83: Spain Silicon anode batteries Market Value & Volume, 2021-2026 ($)
Figure 84: Spain GDP and Population, 2018-2019 ($)
Figure 85: Spain GDP – Composition of 2018, By Sector of Origin
Figure 86: Spain Export and Import Value & Volume, 2018-2019 ($)
Figure 87: Denmark Silicon anode batteries Market Value & Volume, 2021-2026 ($)
Figure 88: Denmark GDP and Population, 2018-2019 ($)
Figure 89: Denmark GDP – Composition of 2018, By Sector of Origin
Figure 90: Denmark Export and Import Value & Volume, 2018-2019 ($)
Figure 91: APAC Silicon anode batteries Market Value & Volume, 2021-2026 ($)
Figure 92: China Silicon anode batteries Market Value & Volume, 2021-2026
Figure 93: China GDP and Population, 2018-2019 ($)
Figure 94: China GDP – Composition of 2018, By Sector of Origin
Figure 95: China Export and Import Value & Volume, 2018-2019 ($)Silicon anode batteries Market China Export and Import Value & Volume, 2018-2019 ($)
Figure 96: Australia Silicon anode batteries Market Value & Volume, 2021-2026 ($)
Figure 97: Australia GDP and Population, 2018-2019 ($)
Figure 98: Australia GDP – Composition of 2018, By Sector of Origin
Figure 99: Australia Export and Import Value & Volume, 2018-2019 ($)
Figure 100: South Korea Silicon anode batteries Market Value & Volume, 2021-2026 ($)
Figure 101: South Korea GDP and Population, 2018-2019 ($)
Figure 102: South Korea GDP – Composition of 2018, By Sector of Origin
Figure 103: South Korea Export and Import Value & Volume, 2018-2019 ($)
Figure 104: India Silicon anode batteries Market Value & Volume, 2021-2026 ($)
Figure 105: India GDP and Population, 2018-2019 ($)
Figure 106: India GDP – Composition of 2018, By Sector of Origin
Figure 107: India Export and Import Value & Volume, 2018-2019 ($)
Figure 108: Taiwan Silicon anode batteries Market Value & Volume, 2021-2026 ($)
Figure 109: Taiwan GDP and Population, 2018-2019 ($)
Figure 110: Taiwan GDP – Composition of 2018, By Sector of Origin
Figure 111: Taiwan Export and Import Value & Volume, 2018-2019 ($)
Figure 112: Malaysia Silicon anode batteries Market Value & Volume, 2021-2026 ($)
Figure 113: Malaysia GDP and Population, 2018-2019 ($)
Figure 114: Malaysia GDP – Composition of 2018, By Sector of Origin
Figure 115: Malaysia Export and Import Value & Volume, 2018-2019 ($)
Figure 116: Hong Kong Silicon anode batteries Market Value & Volume, 2021-2026 ($)
Figure 117: Hong Kong GDP and Population, 2018-2019 ($)
Figure 118: Hong Kong GDP – Composition of 2018, By Sector of Origin
Figure 119: Hong Kong Export and Import Value & Volume, 2018-2019 ($)
Figure 120: Middle East & Africa Silicon anode batteries Market Middle East & Africa 3D Printing Market Value & Volume, 2021-2026 ($)
Figure 121: Russia Silicon anode batteries Market Value & Volume, 2021-2026 ($)
Figure 122: Russia GDP and Population, 2018-2019 ($)
Figure 123: Russia GDP – Composition of 2018, By Sector of Origin
Figure 124: Russia Export and Import Value & Volume, 2018-2019 ($)
Figure 125: Israel Silicon anode batteries Market Value & Volume, 2021-2026 ($)
Figure 126: Israel GDP and Population, 2018-2019 ($)
Figure 127: Israel GDP – Composition of 2018, By Sector of Origin
Figure 128: Israel Export and Import Value & Volume, 2018-2019 ($)
Figure 129: Entropy Share, By Strategies, 2018-2019* (%)Silicon anode batteries Market
Figure 130: Developments, 2018-2019*Silicon anode batteries Market
Figure 131: Company 1 Silicon anode batteries Market Net Revenue, By Years, 2018-2019* ($)
Figure 132: Company 1 Silicon anode batteries Market Net Revenue Share, By Business segments, 2018 (%)
Figure 133: Company 1 Silicon anode batteries Market Net Sales Share, By Geography, 2018 (%)
Figure 134: Company 2 Silicon anode batteries Market Net Revenue, By Years, 2018-2019* ($)
Figure 135: Company 2 Silicon anode batteries Market Net Revenue Share, By Business segments, 2018 (%)
Figure 136: Company 2 Silicon anode batteries Market Net Sales Share, By Geography, 2018 (%)
Figure 137: Company 3 Silicon anode batteries Market Net Revenue, By Years, 2018-2019* ($)
Figure 138: Company 3 Silicon anode batteries Market Net Revenue Share, By Business segments, 2018 (%)
Figure 139: Company 3 Silicon anode batteries Market Net Sales Share, By Geography, 2018 (%)
Figure 140: Company 4 Silicon anode batteries Market Net Revenue, By Years, 2018-2019* ($)
Figure 141: Company 4 Silicon anode batteries Market Net Revenue Share, By Business segments, 2018 (%)
Figure 142: Company 4 Silicon anode batteries Market Net Sales Share, By Geography, 2018 (%)
Figure 143: Company 5 Silicon anode batteries Market Net Revenue, By Years, 2018-2019* ($)
Figure 144: Company 5 Silicon anode batteries Market Net Revenue Share, By Business segments, 2018 (%)
Figure 145: Company 5 Silicon anode batteries Market Net Sales Share, By Geography, 2018 (%)
Figure 146: Company 6 Silicon anode batteries Market Net Revenue, By Years, 2018-2019* ($)
Figure 147: Company 6 Silicon anode batteries Market Net Revenue Share, By Business segments, 2018 (%)
Figure 148: Company 6 Silicon anode batteries Market Net Sales Share, By Geography, 2018 (%)
Figure 149: Company 7 Silicon anode batteries Market Net Revenue, By Years, 2018-2019* ($)
Figure 150: Company 7 Silicon anode batteries Market Net Revenue Share, By Business segments, 2018 (%)
Figure 151: Company 7 Silicon anode batteries Market Net Sales Share, By Geography, 2018 (%)
Figure 152: Company 8 Silicon anode batteries Market Net Revenue, By Years, 2018-2019* ($)
Figure 153: Company 8 Silicon anode batteries Market Net Revenue Share, By Business segments, 2018 (%)
Figure 154: Company 8 Silicon anode batteries Market Net Sales Share, By Geography, 2018 (%)
Figure 155: Company 9 Silicon anode batteries Market Net Revenue, By Years, 2018-2019* ($)
Figure 156: Company 9 Silicon anode batteries Market Net Revenue Share, By Business segments, 2018 (%)
Figure 157: Company 9 Silicon anode batteries Market Net Sales Share, By Geography, 2018 (%)
Figure 158: Company 10 Silicon anode batteries Market Net Revenue, By Years, 2018-2019* ($)
Figure 159: Company 10 Silicon anode batteries Market Net Revenue Share, By Business segments, 2018 (%)
Figure 160: Company 10 Silicon anode batteries Market Net Sales Share, By Geography, 2018 (%)
Figure 161: Company 11 Silicon anode batteries Market Net Revenue, By Years, 2018-2019* ($)
Figure 162: Company 11 Silicon anode batteries Market Net Revenue Share, By Business segments, 2018 (%)
Figure 163: Company 11 Silicon anode batteries Market Net Sales Share, By Geography, 2018 (%)
Figure 164: Company 12 Silicon anode batteries Market Net Revenue, By Years, 2018-2019* ($)
Figure 165: Company 12 Silicon anode batteries Market Net Revenue Share, By Business segments, 2018 (%)
Figure 166: Company 12 Silicon anode batteries Market Net Sales Share, By Geography, 2018 (%)
Figure 167: Company 13 Silicon anode batteries Market Net Revenue, By Years, 2018-2019* ($)
Figure 168: Company 13 Silicon anode batteries Market Net Revenue Share, By Business segments, 2018 (%)
Figure 169: Company 13 Silicon anode batteries Market Net Sales Share, By Geography, 2018 (%)
Figure 170: Company 14 Silicon anode batteries Market Net Revenue, By Years, 2018-2019* ($)
Figure 171: Company 14 Silicon anode batteries Market Net Revenue Share, By Business segments, 2018 (%)
Figure 172: Company 14 Silicon anode batteries Market Net Sales Share, By Geography, 2018 (%)
Figure 173: Company 15 Silicon anode batteries Market Net Revenue, By Years, 2018-2019* ($)
Figure 174: Company 15 Silicon anode batteries Market Net Revenue Share, By Business segments, 2018 (%)
Figure 175: Company 15 Silicon anode batteries Market Net Sales Share, By Geography, 2018 (%)