 Email
Email Print
Print


The medical pendants are the systems designed to provide appropriate positioning and arrangement of equipment, terminal units, medical gas, specialty, electrical services and other surgical assistance materials used during surgical or medical process. A medical pendant system is installed on the hospital ceiling with a strong body system composed of stainless steel extensions and supporting rods. Such systems are compact with customizable configurations in order to fulfill exact requirements of hospital or any other healthcare center.
Doctors and medical professionals worldwide have acknowledged its potential and are adopting them in procedures like endoscopy, anesthesia, ICU procedures etc. Medical pendants have numerous arms which can be used to lodge all electrical services, medical gas, data communication services and simplifying Equipment management. They are acclaimed to be a very useful entity for all medical enterprises because of their functionality to make medical tasks easier, and ensure safety while placing monitoring equipment along with extending space in the operation theatre for operations and critical care areas to improve mobility around the patient bed thereby enabling healthcare staff to deliver effective patient care. They are basically used by specialists for holding various medical devices during surgery and different medical procedures. Globally improving medical practices and moving the focus towards ensuring patient safety are among the various key trends and is expected to drive the demand and considerable share for medical pendant during the period of study.
Geographically North America dominated global medical pendant market and is poised to be the leader in terms of revenue generation driven by best in the class healthcare infrastructure, advanced facilities, best healthcare practices coupled with strict guidelines from the regulating authorities. North America was followed by Europe and Asia-Pacific as second and third largest market for medical pendant market. Asia Pacific is projected to have fastest growth in adopting medical pendant system, owing to rapidly increasing healthcare infrastructure, increased spending, government initiatives and growing focus on better healthcare practices due to growing medical tourism industry in developing nations such as China, and India in this region. Prior mentioned trends will add market value and promote its worth, directing its establishment as a more prominent asset. Forecast of consumption in such large markets will definitely increase the market size for medical pendant system.
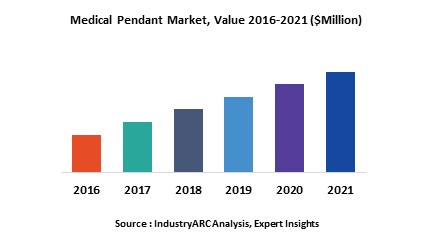
This report identifies the global medical pendant market size via acute analysis for the year 2014-2016, and forecast of the same for year 2021. It also highlights the market drivers, restraints, growth indicators, challenges, prices modulations and other key aspects with respect to global medical pendant market and provides an outlook for the same.
This report segments global medical pendant market on the basis of type, applications, and regional market as follows:
- Medical Pendant Market, By Type: Fixed Pendants, Fixed Retractable Pendants, Single Arm Movable Pendant, Double Multi Arm Movable Pendant
- Medical Pendant Market, By Application: Surgery, Endoscopy, Anaesthesia, Intensive care Unit and Other
- Medical Pendant Market, By End-User: Inpatient Facilities, Outpatient Facilities
- This report has been further segmented into major regions, which includes detailed analysis of each region such as: North America, Europe, Asia-Pacific (APAC), and Rest of the World (RoW) covering all the major country level markets in each of the region
This report identifies all the major companies operating in the medical pendant market. Some of the major companies’ profiles in detail are as follows:
- Acelity L.P., Inc.
- Smith and Nephew PLC
- Integra Lifesciences Holdings Corp.
- Mölnlycke Health Care
- Convatec, Inc.
1. Medical Pendant Market - Overview
1.1. Definitions and Scope
2. Medical Pendant Market - Executive summary
2.1. Market Revenue, Market Size and Key Trends by Company
2.2. Key Trends by type of Application
2.3. Key Trends segmented by Geography
3. Medical Pendant Market
3.1. Comparative analysis
3.1.1. Product Benchmarking - Top 10 companies
3.1.2. Top 5 Financials Analysis
3.1.3. Market Value split by Top 10 companies
3.1.4. Patent Analysis - Top 10 companies
3.1.5. Pricing Analysis
4. Medical Pendant Market – Startup companies Scenario Premium
4.1. Top 10 startup company Analysis by
4.1.1. Investment
4.1.2. Revenue
4.1.3. Market Shares
4.1.4. Market Size and Application Analysis
4.1.5. Venture Capital and Funding Scenario
5. Medical Pendant Market – Industry Market Entry Scenario Premium
5.1. Regulatory Framework Overview
5.2. New Business and Ease of Doing business index
5.3. Case studies of successful ventures
5.4. Customer Analysis – Top 10 companies
6. Medical Pendant Market Forces
6.1. Drivers
6.2. Constraints
6.3. Challenges
6.4. Porters five force model
6.4.1. Bargaining power of suppliers
6.4.2. Bargaining powers of customers
6.4.3. Threat of new entrants
6.4.4. Rivalry among existing players
6.4.5. Threat of substitutes
7. Medical Pendant Market -Strategic analysis
7.1. Value chain analysis
7.2. Opportunities analysis
7.3. Product life cycle
7.4. Suppliers and distributors Market Share
8. Medical Pendant Market – By Type (Market Size -$Million / $Billion)
8.1. Market Size and Market Share Analysis
8.2. Application Revenue and Trend Research
8.3. Product Segment Analysis
8.3.1. Fixed Pendants
8.3.2. Fixed Retractable Pendants
8.3.3. Single Arm Movable Pendant
8.3.4. Double Multi Arm Movable Pendant
9. Medical Pendant Market – By Application (Market Size -$Million / $Billion)
9.1. Surgery
9.2. Endoscopy
9.3. Anaesthesia
9.4. Intensive care Unit
9.5. Others
10. Medical Pendant - By Geography (Market Size -$Million / $Billion)
10.1. Medical Pendant Market - North America Segment Research
10.2. North America Market Research (Million / $Billion)
10.2.1. Segment type Size and Market Size Analysis
10.2.2. Revenue and Trends
10.2.3. Application Revenue and Trends by type of Application
10.2.4. Company Revenue and Product Analysis
10.2.5. North America Product type and Application Market Size
10.2.5.1. U.S.
10.2.5.2. Canada
10.2.5.3. Mexico
10.2.5.4. Rest of North America
10.3. Medical Pendant - South America Segment Research
10.4. South America Market Research (Market Size -$Million / $Billion)
10.4.1. Segment type Size and Market Size Analysis
10.4.2. Revenue and Trends
10.4.3. Application Revenue and Trends by type of Application
10.4.4. Company Revenue and Product Analysis
10.4.5. South America Product type and Application Market Size
10.4.5.1. Brazil
10.4.5.2. Venezuela
10.4.5.3. Argentina
10.4.5.4. Ecuador
10.4.5.5. Peru
10.4.5.6. Colombia
10.4.5.7. Costa Rica
10.4.5.8. Rest of South America
10.5. Medical Pendant - Europe Segment Research
10.6. Europe Market Research (Market Size -$Million / $Billion)
10.6.1. Segment type Size and Market Size Analysis
10.6.2. Revenue and Trends
10.6.3. Application Revenue and Trends by type of Application
10.6.4. Company Revenue and Product Analysis
10.6.5. Europe Segment Product type and Application Market Size
10.6.5.1. U.K
10.6.5.2. Germany
10.6.5.3. Italy
10.6.5.4. France
10.6.5.5. Netherlands
10.6.5.6. Belgium
10.6.5.7. Spain
10.6.5.8. Denmark
10.6.5.9. Rest of Europe
10.7. Medical Pendant – APAC Segment Research
10.8. APAC Market Research (Market Size -$Million / $Billion)
10.8.1. Segment type Size and Market Size Analysis
10.8.2. Revenue and Trends
10.8.3. Application Revenue and Trends by type of Application
10.8.4. Company Revenue and Product Analysis
10.8.5. APAC Segment – Product type and Application Market Size
10.8.5.1. China
10.8.5.2. Australia
10.8.5.3. Japan
10.8.5.4. South Korea
10.8.5.5. India
10.8.5.6. Taiwan
10.8.5.7. Malaysia
11. Medical Pendant Market - Entropy
11.1. New product launches
11.2. M&A's, collaborations, JVs and partnerships
12. Medical Pendant Market – Industry / Segment Competition landscape Premium
12.1. Market Share Analysis
12.1.1. Market Share by Country- Top companies
12.1.2. Market Share by Region- Top 10 companies
12.1.3. Market Share by type of Application – Top 10 companies
12.1.4. Market Share by type of Product / Product category- Top 10 companies
12.1.5. Market Share at global level- Top 10 companies
12.1.6. Best Practises for companies
13. Medical Pendant Market – Key Company List by Country Premium
14. Medical Pendant Market Company Analysis
14.1. Market Share, Company Revenue, Products, M&A, Developments
14.2. ELEKTRA HELLAS
14.3. Starkstrom
14.4. Ondal
14.5. Hipac
14.6. Beacon Medaes
14.7. Unicorn Medicals
14.8. Medilon
14.9. Uttam
14.10. Medimax
14.11. Brandon Medical
14.12. Company 12
14.13. Company 13
14.14. Company 14 and More
"*Financials would be provided on a best efforts basis for private companies"
15. Medical Pendant Market -Appendix
15.1. Abbreviations
15.2. Sources
16. Medical Pendant Market -Methodology Premium
16.1. Research Methodology
16.1.1. Company Expert Interviews
16.1.2. Industry Databases
16.1.3. Associations
16.1.4. Company News
16.1.5. Company Annual Reports
16.1.6. Application Trends
16.1.7. New Products and Product database
16.1.8. Company Transcripts
16.1.9. R&D Trends
16.1.10. Key Opinion Leaders Interviews
16.1.11. Supply and Demand Trends
List of Tables:
Table 1: Medical Pendant Market Overview 2021-2026
Table 2: Medical Pendant Market Leader Analysis 2018-2019 (US$)
Table 3: Medical Pendant Market Product Analysis 2018-2019 (US$)
Table 4: Medical Pendant Market End User Analysis 2018-2019 (US$)
Table 5: Medical Pendant Market Patent Analysis 2013-2018* (US$)
Table 6: Medical Pendant Market Financial Analysis 2018-2019 (US$)
Table 7: Medical Pendant Market Driver Analysis 2018-2019 (US$)
Table 8: Medical Pendant Market Challenges Analysis 2018-2019 (US$)
Table 9: Medical Pendant Market Constraint Analysis 2018-2019 (US$)
Table 10: Medical Pendant Market Supplier Bargaining Power Analysis 2018-2019 (US$)
Table 11: Medical Pendant Market Buyer Bargaining Power Analysis 2018-2019 (US$)
Table 12: Medical Pendant Market Threat of Substitutes Analysis 2018-2019 (US$)
Table 13: Medical Pendant Market Threat of New Entrants Analysis 2018-2019 (US$)
Table 14: Medical Pendant Market Degree of Competition Analysis 2018-2019 (US$)
Table 15: Medical Pendant Market Value Chain Analysis 2018-2019 (US$)
Table 16: Medical Pendant Market Pricing Analysis 2021-2026 (US$)
Table 17: Medical Pendant Market Opportunities Analysis 2021-2026 (US$)
Table 18: Medical Pendant Market Product Life Cycle Analysis 2021-2026 (US$)
Table 19: Medical Pendant Market Supplier Analysis 2018-2019 (US$)
Table 20: Medical Pendant Market Distributor Analysis 2018-2019 (US$)
Table 21: Medical Pendant Market Trend Analysis 2018-2019 (US$)
Table 22: Medical Pendant Market Size 2018 (US$)
Table 23: Medical Pendant Market Forecast Analysis 2021-2026 (US$)
Table 24: Medical Pendant Market Sales Forecast Analysis 2021-2026 (Units)
Table 25: Medical Pendant Market, Revenue & Volume,By Type, 2021-2026 ($)
Table 26: Medical Pendant Market By Type, Revenue & Volume,By Fixed Pendants, 2021-2026 ($)
Table 27: Medical Pendant Market By Type, Revenue & Volume,By Fixed Retractable Pendants, 2021-2026 ($)
Table 28: Medical Pendant Market By Type, Revenue & Volume,By Single Arm Movable Pendant, 2021-2026 ($)
Table 29: Medical Pendant Market By Type, Revenue & Volume,By Double Multi Arm Movable Pendant, 2021-2026 ($)
Table 30: Medical Pendant Market, Revenue & Volume,By Application, 2021-2026 ($)
Table 31: Medical Pendant Market By Application, Revenue & Volume,By Surgery, 2021-2026 ($)
Table 32: Medical Pendant Market By Application, Revenue & Volume,By Endoscopy, 2021-2026 ($)
Table 33: Medical Pendant Market By Application, Revenue & Volume,By Anaesthesia, 2021-2026 ($)
Table 34: Medical Pendant Market By Application, Revenue & Volume,By Intensive care Unit, 2021-2026 ($)
Table 35: North America Medical Pendant Market, Revenue & Volume,By Type, 2021-2026 ($)
Table 36: North America Medical Pendant Market, Revenue & Volume,By Application, 2021-2026 ($)
Table 37: South america Medical Pendant Market, Revenue & Volume,By Type, 2021-2026 ($)
Table 38: South america Medical Pendant Market, Revenue & Volume,By Application, 2021-2026 ($)
Table 39: Europe Medical Pendant Market, Revenue & Volume,By Type, 2021-2026 ($)
Table 40: Europe Medical Pendant Market, Revenue & Volume,By Application, 2021-2026 ($)
Table 41: APAC Medical Pendant Market, Revenue & Volume,By Type, 2021-2026 ($)
Table 42: APAC Medical Pendant Market, Revenue & Volume,By Application, 2021-2026 ($)
Table 43: Middle East & Africa Medical Pendant Market, Revenue & Volume,By Type, 2021-2026 ($)
Table 44: Middle East & Africa Medical Pendant Market, Revenue & Volume,By Application, 2021-2026 ($)
Table 45: Russia Medical Pendant Market, Revenue & Volume,By Type, 2021-2026 ($)
Table 46: Russia Medical Pendant Market, Revenue & Volume,By Application, 2021-2026 ($)
Table 47: Israel Medical Pendant Market, Revenue & Volume,By Type, 2021-2026 ($)
Table 48: Israel Medical Pendant Market, Revenue & Volume,By Application, 2021-2026 ($)
Table 49: Top Companies 2018 (US$) Medical Pendant Market, Revenue & Volume
Table 50: Product Launch 2018-2019 Medical Pendant Market, Revenue & Volume
Table 51: Mergers & Acquistions 2018-2019 Medical Pendant Market, Revenue & Volume
List of Figures:
Figure 1: Overview of Medical Pendant Market 2021-2026
Figure 2: Market Share Analysis for Medical Pendant Market 2018 (US$)
Figure 3: Product Comparison in Medical Pendant Market 2018-2019 (US$)
Figure 4: End User Profile for Medical Pendant Market 2018-2019 (US$)
Figure 5: Patent Application and Grant in Medical Pendant Market 2013-2018* (US$)
Figure 6: Top 5 Companies Financial Analysis in Medical Pendant Market 2018-2019 (US$)
Figure 7: Market Entry Strategy in Medical Pendant Market 2018-2019
Figure 8: Ecosystem Analysis in Medical Pendant Market2018
Figure 9: Average Selling Price in Medical Pendant Market 2021-2026
Figure 10: Top Opportunites in Medical Pendant Market 2018-2019
Figure 11: Market Life Cycle Analysis in Medical Pendant Market
Figure 12: Global By Type Medical Pendant Market Revenue, 2021-2026 ($)
Figure 13: Global By Application Medical Pendant Market Revenue, 2021-2026 ($)
Figure 14: Global Medical Pendant Market - By Geography
Figure 15: Global Medical Pendant Market Value & Volume, By Geography, 2021-2026 ($)
Figure 16: Global Medical Pendant Market CAGR, By Geography, 2021-2026 (%)
Figure 17: North America Medical Pendant Market Value & Volume, 2021-2026 ($)
Figure 18: US Medical Pendant Market Value & Volume, 2021-2026 ($)
Figure 19: US GDP and Population, 2018-2019 ($)
Figure 20: US GDP – Composition of 2018, By Sector of Origin
Figure 21: US Export and Import Value & Volume, 2018-2019 ($)
Figure 22: Canada Medical Pendant Market Value & Volume, 2021-2026 ($)
Figure 23: Canada GDP and Population, 2018-2019 ($)
Figure 24: Canada GDP – Composition of 2018, By Sector of Origin
Figure 25: Canada Export and Import Value & Volume, 2018-2019 ($)
Figure 26: Mexico Medical Pendant Market Value & Volume, 2021-2026 ($)
Figure 27: Mexico GDP and Population, 2018-2019 ($)
Figure 28: Mexico GDP – Composition of 2018, By Sector of Origin
Figure 29: Mexico Export and Import Value & Volume, 2018-2019 ($)
Figure 30: South America Medical Pendant Market South America 3D Printing Market Value & Volume, 2021-2026 ($)
Figure 31: Brazil Medical Pendant Market Value & Volume, 2021-2026 ($)
Figure 32: Brazil GDP and Population, 2018-2019 ($)
Figure 33: Brazil GDP – Composition of 2018, By Sector of Origin
Figure 34: Brazil Export and Import Value & Volume, 2018-2019 ($)
Figure 35: Venezuela Medical Pendant Market Value & Volume, 2021-2026 ($)
Figure 36: Venezuela GDP and Population, 2018-2019 ($)
Figure 37: Venezuela GDP – Composition of 2018, By Sector of Origin
Figure 38: Venezuela Export and Import Value & Volume, 2018-2019 ($)
Figure 39: Argentina Medical Pendant Market Value & Volume, 2021-2026 ($)
Figure 40: Argentina GDP and Population, 2018-2019 ($)
Figure 41: Argentina GDP – Composition of 2018, By Sector of Origin
Figure 42: Argentina Export and Import Value & Volume, 2018-2019 ($)
Figure 43: Ecuador Medical Pendant Market Value & Volume, 2021-2026 ($)
Figure 44: Ecuador GDP and Population, 2018-2019 ($)
Figure 45: Ecuador GDP – Composition of 2018, By Sector of Origin
Figure 46: Ecuador Export and Import Value & Volume, 2018-2019 ($)
Figure 47: Peru Medical Pendant Market Value & Volume, 2021-2026 ($)
Figure 48: Peru GDP and Population, 2018-2019 ($)
Figure 49: Peru GDP – Composition of 2018, By Sector of Origin
Figure 50: Peru Export and Import Value & Volume, 2018-2019 ($)
Figure 51: Colombia Medical Pendant Market Value & Volume, 2021-2026 ($)
Figure 52: Colombia GDP and Population, 2018-2019 ($)
Figure 53: Colombia GDP – Composition of 2018, By Sector of Origin
Figure 54: Colombia Export and Import Value & Volume, 2018-2019 ($)
Figure 55: Costa Rica Medical Pendant Market Costa Rica 3D Printing Market Value & Volume, 2021-2026 ($)
Figure 56: Costa Rica GDP and Population, 2018-2019 ($)
Figure 57: Costa Rica GDP – Composition of 2018, By Sector of Origin
Figure 58: Costa Rica Export and Import Value & Volume, 2018-2019 ($)
Figure 59: Europe Medical Pendant Market Value & Volume, 2021-2026 ($)
Figure 60: U.K Medical Pendant Market Value & Volume, 2021-2026 ($)
Figure 61: U.K GDP and Population, 2018-2019 ($)
Figure 62: U.K GDP – Composition of 2018, By Sector of Origin
Figure 63: U.K Export and Import Value & Volume, 2018-2019 ($)
Figure 64: Germany Medical Pendant Market Value & Volume, 2021-2026 ($)
Figure 65: Germany GDP and Population, 2018-2019 ($)
Figure 66: Germany GDP – Composition of 2018, By Sector of Origin
Figure 67: Germany Export and Import Value & Volume, 2018-2019 ($)
Figure 68: Italy Medical Pendant Market Value & Volume, 2021-2026 ($)
Figure 69: Italy GDP and Population, 2018-2019 ($)
Figure 70: Italy GDP – Composition of 2018, By Sector of Origin
Figure 71: Italy Export and Import Value & Volume, 2018-2019 ($)
Figure 72: France Medical Pendant Market Value & Volume, 2021-2026 ($)
Figure 73: France GDP and Population, 2018-2019 ($)
Figure 74: France GDP – Composition of 2018, By Sector of Origin
Figure 75: France Export and Import Value & Volume, 2018-2019 ($)
Figure 76: Netherlands Medical Pendant Market Value & Volume, 2021-2026 ($)
Figure 77: Netherlands GDP and Population, 2018-2019 ($)
Figure 78: Netherlands GDP – Composition of 2018, By Sector of Origin
Figure 79: Netherlands Export and Import Value & Volume, 2018-2019 ($)
Figure 80: Belgium Medical Pendant Market Value & Volume, 2021-2026 ($)
Figure 81: Belgium GDP and Population, 2018-2019 ($)
Figure 82: Belgium GDP – Composition of 2018, By Sector of Origin
Figure 83: Belgium Export and Import Value & Volume, 2018-2019 ($)
Figure 84: Spain Medical Pendant Market Value & Volume, 2021-2026 ($)
Figure 85: Spain GDP and Population, 2018-2019 ($)
Figure 86: Spain GDP – Composition of 2018, By Sector of Origin
Figure 87: Spain Export and Import Value & Volume, 2018-2019 ($)
Figure 88: Denmark Medical Pendant Market Value & Volume, 2021-2026 ($)
Figure 89: Denmark GDP and Population, 2018-2019 ($)
Figure 90: Denmark GDP – Composition of 2018, By Sector of Origin
Figure 91: Denmark Export and Import Value & Volume, 2018-2019 ($)
Figure 92: APAC Medical Pendant Market Value & Volume, 2021-2026 ($)
Figure 93: China Medical Pendant MarketValue & Volume, 2021-2026
Figure 94: China GDP and Population, 2018-2019 ($)
Figure 95: China GDP – Composition of 2018, By Sector of Origin
Figure 96: China Export and Import Value & Volume, 2018-2019 ($)Medical Pendant Market China Export and Import Value & Volume, 2018-2019 ($)
Figure 97: Australia Medical Pendant Market Value & Volume, 2021-2026 ($)
Figure 98: Australia GDP and Population, 2018-2019 ($)
Figure 99: Australia GDP – Composition of 2018, By Sector of Origin
Figure 100: Australia Export and Import Value & Volume, 2018-2019 ($)
Figure 101: South Korea Medical Pendant Market Value & Volume, 2021-2026 ($)
Figure 102: South Korea GDP and Population, 2018-2019 ($)
Figure 103: South Korea GDP – Composition of 2018, By Sector of Origin
Figure 104: South Korea Export and Import Value & Volume, 2018-2019 ($)
Figure 105: India Medical Pendant Market Value & Volume, 2021-2026 ($)
Figure 106: India GDP and Population, 2018-2019 ($)
Figure 107: India GDP – Composition of 2018, By Sector of Origin
Figure 108: India Export and Import Value & Volume, 2018-2019 ($)
Figure 109: Taiwan Medical Pendant Market Taiwan 3D Printing Market Value & Volume, 2021-2026 ($)
Figure 110: Taiwan GDP and Population, 2018-2019 ($)
Figure 111: Taiwan GDP – Composition of 2018, By Sector of Origin
Figure 112: Taiwan Export and Import Value & Volume, 2018-2019 ($)
Figure 113: Malaysia Medical Pendant Market Malaysia 3D Printing Market Value & Volume, 2021-2026 ($)
Figure 114: Malaysia GDP and Population, 2018-2019 ($)
Figure 115: Malaysia GDP – Composition of 2018, By Sector of Origin
Figure 116: Malaysia Export and Import Value & Volume, 2018-2019 ($)
Figure 117: Hong Kong Medical Pendant Market Hong Kong 3D Printing Market Value & Volume, 2021-2026 ($)
Figure 118: Hong Kong GDP and Population, 2018-2019 ($)
Figure 119: Hong Kong GDP – Composition of 2018, By Sector of Origin
Figure 120: Hong Kong Export and Import Value & Volume, 2018-2019 ($)
Figure 121: Middle East & Africa Medical Pendant Market Middle East & Africa 3D Printing Market Value & Volume, 2021-2026 ($)
Figure 122: Russia Medical Pendant Market Russia 3D Printing Market Value & Volume, 2021-2026 ($)
Figure 123: Russia GDP and Population, 2018-2019 ($)
Figure 124: Russia GDP – Composition of 2018, By Sector of Origin
Figure 125: Russia Export and Import Value & Volume, 2018-2019 ($)
Figure 126: Israel Medical Pendant Market Value & Volume, 2021-2026 ($)
Figure 127: Israel GDP and Population, 2018-2019 ($)
Figure 128: Israel GDP – Composition of 2018, By Sector of Origin
Figure 129: Israel Export and Import Value & Volume, 2018-2019 ($)
Figure 130: Entropy Share, By Strategies, 2018-2019* (%)Medical Pendant Market
Figure 131: Developments, 2018-2019*Medical Pendant Market
Figure 132: Company 1 Medical Pendant Market Net Revenue, By Years, 2018-2019* ($)
Figure 133: Company 1 Medical Pendant Market Net Revenue Share, By Business segments, 2018 (%)
Figure 134: Company 1 Medical Pendant Market Net Sales Share, By Geography, 2018 (%)
Figure 135: Company 2 Medical Pendant Market Net Revenue, By Years, 2018-2019* ($)
Figure 136: Company 2 Medical Pendant Market Net Revenue Share, By Business segments, 2018 (%)
Figure 137: Company 2 Medical Pendant Market Net Sales Share, By Geography, 2018 (%)
Figure 138: Company 3 Medical Pendant Market Net Revenue, By Years, 2018-2019* ($)
Figure 139: Company 3 Medical Pendant Market Net Revenue Share, By Business segments, 2018 (%)
Figure 140: Company 3 Medical Pendant Market Net Sales Share, By Geography, 2018 (%)
Figure 141: Company 4 Medical Pendant Market Net Revenue, By Years, 2018-2019* ($)
Figure 142: Company 4 Medical Pendant Market Net Revenue Share, By Business segments, 2018 (%)
Figure 143: Company 4 Medical Pendant Market Net Sales Share, By Geography, 2018 (%)
Figure 144: Company 5 Medical Pendant Market Net Revenue, By Years, 2018-2019* ($)
Figure 145: Company 5 Medical Pendant Market Net Revenue Share, By Business segments, 2018 (%)
Figure 146: Company 5 Medical Pendant Market Net Sales Share, By Geography, 2018 (%)
Figure 147: Company 6 Medical Pendant Market Net Revenue, By Years, 2018-2019* ($)
Figure 148: Company 6 Medical Pendant Market Net Revenue Share, By Business segments, 2018 (%)
Figure 149: Company 6 Medical Pendant Market Net Sales Share, By Geography, 2018 (%)
Figure 150: Company 7 Medical Pendant Market Net Revenue, By Years, 2018-2019* ($)
Figure 151: Company 7 Medical Pendant Market Net Revenue Share, By Business segments, 2018 (%)
Figure 152: Company 7 Medical Pendant Market Net Sales Share, By Geography, 2018 (%)
Figure 153: Company 8 Medical Pendant Market Net Revenue, By Years, 2018-2019* ($)
Figure 154: Company 8 Medical Pendant Market Net Revenue Share, By Business segments, 2018 (%)
Figure 155: Company 8 Medical Pendant Market Net Sales Share, By Geography, 2018 (%)
Figure 156: Company 9 Medical Pendant Market Net Revenue, By Years, 2018-2019* ($)
Figure 157: Company 9 Medical Pendant Market Net Revenue Share, By Business segments, 2018 (%)
Figure 158: Company 9 Medical Pendant Market Net Sales Share, By Geography, 2018 (%)
Figure 159: Company 10 Medical Pendant Market Net Revenue, By Years, 2018-2019* ($)
Figure 160: Company 10 Medical Pendant Market Net Revenue Share, By Business segments, 2018 (%)
Figure 161: Company 10 Medical Pendant Market Net Sales Share, By Geography, 2018 (%)
Figure 162: Company 11 Medical Pendant Market Net Revenue, By Years, 2018-2019* ($)
Figure 163: Company 11 Medical Pendant Market Net Revenue Share, By Business segments, 2018 (%)
Figure 164: Company 11 Medical Pendant Market Net Sales Share, By Geography, 2018 (%)
Figure 165: Company 12 Medical Pendant Market Net Revenue, By Years, 2018-2019* ($)
Figure 166: Company 12 Medical Pendant Market Net Revenue Share, By Business segments, 2018 (%)
Figure 167: Company 12 Medical Pendant Market Net Sales Share, By Geography, 2018 (%)
Figure 168: Company 13 Medical Pendant Market Net Revenue, By Years, 2018-2019* ($)
Figure 169: Company 13 Medical Pendant Market Net Revenue Share, By Business segments, 2018 (%)
Figure 170: Company 13 Medical Pendant Market Net Sales Share, By Geography, 2018 (%)
Figure 171: Company 14 Medical Pendant Market Net Revenue, By Years, 2018-2019* ($)
Figure 172: Company 14 Medical Pendant Market Net Revenue Share, By Business segments, 2018 (%)
Figure 173: Company 14 Medical Pendant Market Net Sales Share, By Geography, 2018 (%)
Figure 174: Company 15 Medical Pendant Market Net Revenue, By Years, 2018-2019* ($)
Figure 175: Company 15 Medical Pendant Market Net Revenue Share, By Business segments, 2018 (%)
Figure 176: Company 15 Medical Pendant Market Net Sales Share, By Geography, 2018 (%)