 Email
Email Print
Print


Explosive Ordnance Disposal Market - Forecast(2024 - 2030)
Explosive Ordnance Disposal (EOD) can be defined as the tools and equipment used to detect, dispose and provide protection during explosive disposal operations. Explosive Ordnance Disposal equipment is generally used by military, navy and other defense organizations for detecting any potential threat or for law enforcement activities. Globally, increasing terrorism activities is one of the major factors expected to drive the demand for explosive ordnance disposal equipment during the period of study.
Geographically, North America dominated the explosive ordnance disposal market owing to a high importance given to defense and law enforcement activities by the U.S. government. North America has invested heavily in soldier modernization, including through warfare training and the provision of advanced equipment, including explosive ordnance disposal equipment. North America was followed by Asia-Pacific and Europe as second and third largest market for the explosive ordnance disposal market. Asia Pacific is projected to have the fastest growth, owing to increasing spending on defense and law enforcement activities looking at the potential threats from terrorism especially developing nations such as India in this region.
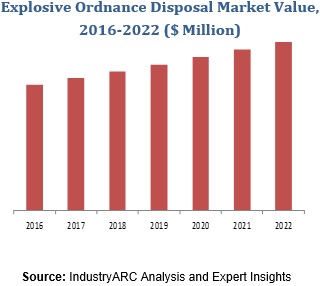
This report identifies the explosive ordnance disposal market size for the years 2014-2016, and forecast of the same till the year 2022. It also highlights the market drivers, restraints, growth indicators, challenges, and other key aspects with respect to the explosive ordnance disposal market.
This report segments the explosive ordnance disposal market on the basis of product, application, and regional market as follows:
This report identifies all the major companies operating in the explosive ordnance disposal market. Some of the major companies’ profiles in detail are as follows:
Geographically, North America dominated the explosive ordnance disposal market owing to a high importance given to defense and law enforcement activities by the U.S. government. North America has invested heavily in soldier modernization, including through warfare training and the provision of advanced equipment, including explosive ordnance disposal equipment. North America was followed by Asia-Pacific and Europe as second and third largest market for the explosive ordnance disposal market. Asia Pacific is projected to have the fastest growth, owing to increasing spending on defense and law enforcement activities looking at the potential threats from terrorism especially developing nations such as India in this region.
This report identifies the explosive ordnance disposal market size for the years 2014-2016, and forecast of the same till the year 2022. It also highlights the market drivers, restraints, growth indicators, challenges, and other key aspects with respect to the explosive ordnance disposal market.
This report segments the explosive ordnance disposal market on the basis of product, application, and regional market as follows:
- Explosive ordnance disposal market research report is classified on the basis of application. Some of the major applications covered in this report are as follows: Defense and Law Enfrocement
- Explosive ordnance disposal market research report is classified on the basis of product industry. Some of the major industries covered in this report are as follows: Portable X-ray Systems, Projected Water Disruptors, Bomb containment chambers, EOD Suits & Blankets, EOD Robots, Explosive Detectors, Search mirrors and Others
- This report has been further segmented into major regions, which includes detailed analysis of each region such as: North America, Europe, Asia-Pacific (APAC), and Rest of the World (RoW) covering all the major country level markets in each of the region
This report identifies all the major companies operating in the explosive ordnance disposal market. Some of the major companies’ profiles in detail are as follows:
- iRobot Corporation
- Safariland, LLC
- Northrop Grumman Corporation
- Scanna Msc Ltd.
- NABCO, Inc..
1. Explosive Ordnance Disposal Market - Overview
1.1. Definitions and Scope
2. Explosive Ordnance Disposal Market - Executive summary
2.1. Market Revenue, Market Size and Key Trends by Company
2.2. Key Trends by type of Application
2.3. Key Trends segmented by Geography
3. Explosive Ordnance Disposal Market
3.1. Comparative analysis
3.1.1. Product Benchmarking - Top 10 companies
3.1.2. Top 5 Financials Analysis
3.1.3. Market Value split by Top 10 companies
3.1.4. Patent Analysis - Top 10 companies
3.1.5. Pricing Analysis
4. Explosive Ordnance Disposal Market – Startup companies Scenario Premium
4.1. Top 10 startup company Analysis by
4.1.1. Investment
4.1.2. Revenue
4.1.3. Market Shares
4.1.4. Market Size and Application Analysis
4.1.5. Venture Capital and Funding Scenario
5. Explosive Ordnance Disposal Market – Industry Market Entry Scenario Premium
5.1. Regulatory Framework Overview
5.2. New Business and Ease of Doing business index
5.3. Case studies of successful ventures
5.4. Customer Analysis – Top 10 companies
6. Explosive Ordnance Disposal Market Forces
6.1. Drivers
6.2. Constraints
6.3. Challenges
6.4. Porters five force model
6.4.1. Bargaining power of suppliers
6.4.2. Bargaining powers of customers
6.4.3. Threat of new entrants
6.4.4. Rivalry among existing players
6.4.5. Threat of substitutes
7. Explosive Ordnance Disposal Market -Strategic analysis
7.1. Value chain analysis
7.2. Opportunities analysis
7.3. Product life cycle
7.4. Suppliers and distributors Market Share
8. Explosive Ordnance Disposal Market – By Application (Market Size -$Million / $Billion)
8.1. Market Size and Market Share Analysis
8.2. Application Revenue and Trend Research
8.3. Product Segment Analysis
8.3.1. Defense
8.3.2. Law Enforcement
9. Explosive Ordnance Disposal Market – By Product (Market Size -$Million / $Billion)
9.1. Portable X-ray Systems
9.2. Projected Water Disruptors
9.3. Bomb containment chambers
9.4. EOD Suits & Blankets
9.5. EOD Robots
9.6. Explosive Detectors
9.7. Search mirrors
9.8. Others
10. Explosive Ordnance Disposal - By Geography (Market Size -$Million / $Billion)
10.1. Explosive Ordnance Disposal Market - North America Segment Research
10.2. North America Market Research (Million / $Billion)
10.2.1. Segment type Size and Market Size Analysis
10.2.2. Revenue and Trends
10.2.3. Application Revenue and Trends by type of Application
10.2.4. Company Revenue and Product Analysis
10.2.5. North America Product type and Application Market Size
10.2.5.1. U.S.
10.2.5.2. Canada
10.2.5.3. Mexico
10.2.5.4. Rest of North America
10.3. Explosive Ordnance Disposal - South America Segment Research
10.4. South America Market Research (Market Size -$Million / $Billion)
10.4.1. Segment type Size and Market Size Analysis
10.4.2. Revenue and Trends
10.4.3. Application Revenue and Trends by type of Application
10.4.4. Company Revenue and Product Analysis
10.4.5. South America Product type and Application Market Size
10.4.5.1. Brazil
10.4.5.2. Venezuela
10.4.5.3. Argentina
10.4.5.4. Ecuador
10.4.5.5. Peru
10.4.5.6. Colombia
10.4.5.7. Costa Rica
10.4.5.8. Rest of South America
10.5. Explosive Ordnance Disposal - Europe Segment Research
10.6. Europe Market Research (Market Size -$Million / $Billion)
10.6.1. Segment type Size and Market Size Analysis
10.6.2. Revenue and Trends
10.6.3. Application Revenue and Trends by type of Application
10.6.4. Company Revenue and Product Analysis
10.6.5. Europe Segment Product type and Application Market Size
10.6.5.1. U.K
10.6.5.2. Germany
10.6.5.3. Italy
10.6.5.4. France
10.6.5.5. Netherlands
10.6.5.6. Belgium
10.6.5.7. Spain
10.6.5.8. Denmark
10.6.5.9. Rest of Europe
10.7. Explosive Ordnance Disposal – APAC Segment Research
10.8. APAC Market Research (Market Size -$Million / $Billion)
10.8.1. Segment type Size and Market Size Analysis
10.8.2. Revenue and Trends
10.8.3. Application Revenue and Trends by type of Application
10.8.4. Company Revenue and Product Analysis
10.8.5. APAC Segment – Product type and Application Market Size
10.8.5.1. China
10.8.5.2. Australia
10.8.5.3. Japan
10.8.5.4. South Korea
10.8.5.5. India
10.8.5.6. Taiwan
10.8.5.7. Malaysia
11. Explosive Ordnance Disposal Market - Entropy
11.1. New product launches
11.2. M&A's, collaborations, JVs and partnerships
12. Explosive Ordnance Disposal Market – Industry / Segment Competition landscape Premium
12.1. Market Share Analysis
12.1.1. Market Share by Country- Top companies
12.1.2. Market Share by Region- Top 10 companies
12.1.3. Market Share by type of Application – Top 10 companies
12.1.4. Market Share by type of Product / Product category- Top 10 companies
12.1.5. Market Share at global level- Top 10 companies
12.1.6. Best Practises for companies
13. Explosive Ordnance Disposal Market – Key Company List by Country Premium
14. Explosive Ordnance Disposal Market Company Analysis
14.1. Market Share, Company Revenue, Products, M&A, Developments
14.2. iRobot Corporation
14.3. Safariland, LLC
14.4. Northrop Grumman Corporation
14.5. Scanna Msc Ltd.
14.6. NABCO, Inc..
14.7. Company 6
14.8. Company 7
14.9. Company 8
14.10. Company 9
14.11. Company 10 and more
"*Financials would be provided on a best efforts basis for private companies"
15. Explosive Ordnance Disposal Market - Appendix
15.1. Abbreviations
15.2. Sources
16. Explosive Ordnance Disposal Market - Methodology
16.1. Research Methodology
16.1.1. Company Expert Interviews
16.1.2. Industry Databases
16.1.3. Associations
16.1.4. Company News
16.1.5. Company Annual Reports
16.1.6. Application Trends
16.1.7. New Products and Product database
16.1.8. Company Transcripts
16.1.9. R&D Trends
16.1.10. Key Opinion Leaders Interviews
16.1.11. Supply and Demand Trends
List of Tables:
Table1 Explosive Ordnance Disposal Market Overview 2021-2026
Table2 Explosive Ordnance Disposal Market Leader Analysis 2018-2019 (US$)
Table3 Explosive Ordnance Disposal MarketProduct Analysis 2018-2019 (US$)
Table4 Explosive Ordnance Disposal MarketEnd User Analysis 2018-2019 (US$)
Table5 Explosive Ordnance Disposal MarketPatent Analysis 2013-2018* (US$)
Table6 Explosive Ordnance Disposal MarketFinancial Analysis 2018-2019 (US$)
Table7 Explosive Ordnance Disposal Market Driver Analysis 2018-2019 (US$)
Table8 Explosive Ordnance Disposal MarketChallenges Analysis 2018-2019 (US$)
Table9 Explosive Ordnance Disposal MarketConstraint Analysis 2018-2019 (US$)
Table10 Explosive Ordnance Disposal Market Supplier Bargaining Power Analysis 2018-2019 (US$)
Table11 Explosive Ordnance Disposal Market Buyer Bargaining Power Analysis 2018-2019 (US$)
Table12 Explosive Ordnance Disposal Market Threat of Substitutes Analysis 2018-2019 (US$)
Table13 Explosive Ordnance Disposal Market Threat of New Entrants Analysis 2018-2019 (US$)
Table14 Explosive Ordnance Disposal Market Degree of Competition Analysis 2018-2019 (US$)
Table15 Explosive Ordnance Disposal MarketValue Chain Analysis 2018-2019 (US$)
Table16 Explosive Ordnance Disposal MarketPricing Analysis 2021-2026 (US$)
Table17 Explosive Ordnance Disposal MarketOpportunities Analysis 2021-2026 (US$)
Table18 Explosive Ordnance Disposal MarketProduct Life Cycle Analysis 2021-2026 (US$)
Table19 Explosive Ordnance Disposal MarketSupplier Analysis 2018-2019 (US$)
Table20 Explosive Ordnance Disposal MarketDistributor Analysis 2018-2019 (US$)
Table21 Explosive Ordnance Disposal Market Trend Analysis 2018-2019 (US$)
Table22 Explosive Ordnance Disposal Market Size 2018 (US$)
Table23 Explosive Ordnance Disposal Market Forecast Analysis 2021-2026 (US$)
Table24 Explosive Ordnance Disposal Market Sales Forecast Analysis 2021-2026 (Units)
Table25 Explosive Ordnance Disposal Market, Revenue & Volume,By Product, 2021-2026 ($)
Table26 Explosive Ordnance Disposal MarketBy Product, Revenue & Volume,By Portable X-ray Systems, 2021-2026 ($)
Table27 Explosive Ordnance Disposal MarketBy Product, Revenue & Volume,By Projected Water Disruptors, 2021-2026 ($)
Table28 Explosive Ordnance Disposal MarketBy Product, Revenue & Volume,By Bomb containment chambers, 2021-2026 ($)
Table29 Explosive Ordnance Disposal MarketBy Product, Revenue & Volume,By EOD Suits & Blankets, 2021-2026 ($)
Table30 Explosive Ordnance Disposal MarketBy Product, Revenue & Volume,By EOD Robots, 2021-2026 ($)
Table31 Explosive Ordnance Disposal Market, Revenue & Volume,By Application, 2021-2026 ($)
Table32 Explosive Ordnance Disposal MarketBy Application, Revenue & Volume,By Defense, 2021-2026 ($)
Table33 Explosive Ordnance Disposal MarketBy Application, Revenue & Volume,By Law Enforcement, 2021-2026 ($)
Table34 North America Explosive Ordnance Disposal Market, Revenue & Volume,By Product, 2021-2026 ($)
Table35 North America Explosive Ordnance Disposal Market, Revenue & Volume,By Application, 2021-2026 ($)
Table36 South america Explosive Ordnance Disposal Market, Revenue & Volume,By Product, 2021-2026 ($)
Table37 South america Explosive Ordnance Disposal Market, Revenue & Volume,By Application, 2021-2026 ($)
Table38 Europe Explosive Ordnance Disposal Market, Revenue & Volume,By Product, 2021-2026 ($)
Table39 Europe Explosive Ordnance Disposal Market, Revenue & Volume,By Application, 2021-2026 ($)
Table40 APAC Explosive Ordnance Disposal Market, Revenue & Volume,By Product, 2021-2026 ($)
Table41 APAC Explosive Ordnance Disposal Market, Revenue & Volume,By Application, 2021-2026 ($)
Table42 Middle East & Africa Explosive Ordnance Disposal Market, Revenue & Volume,By Product, 2021-2026 ($)
Table43 Middle East & Africa Explosive Ordnance Disposal Market, Revenue & Volume,By Application, 2021-2026 ($)
Table44 Russia Explosive Ordnance Disposal Market, Revenue & Volume,By Product, 2021-2026 ($)
Table45 Russia Explosive Ordnance Disposal Market, Revenue & Volume,By Application, 2021-2026 ($)
Table46 Israel Explosive Ordnance Disposal Market, Revenue & Volume,By Product, 2021-2026 ($)
Table47 Israel Explosive Ordnance Disposal Market, Revenue & Volume,By Application, 2021-2026 ($)
Table48 Top Companies 2018 (US$)Explosive Ordnance Disposal Market, Revenue & Volume,,
Table49 Product Launch 2018-2019Explosive Ordnance Disposal Market, Revenue & Volume,,
Table50 Mergers & Acquistions 2018-2019Explosive Ordnance Disposal Market, Revenue & Volume,,
List of Figures:
Figure 1 Overview of Explosive Ordnance Disposal Market 2021-2026
Figure 2 Market Share Analysis for Explosive Ordnance Disposal Market 2018 (US$)
Figure 3 Product Comparison in Explosive Ordnance Disposal Market 2018-2019 (US$)
Figure 4 End User Profile for Explosive Ordnance Disposal Market 2018-2019 (US$)
Figure 5 Patent Application and Grant in Explosive Ordnance Disposal Market 2013-2018* (US$)
Figure 6 Top 5 Companies Financial Analysis in Explosive Ordnance Disposal Market 2018-2019 (US$)
Figure 7 Market Entry Strategy in Explosive Ordnance Disposal Market 2018-2019
Figure 8 Ecosystem Analysis in Explosive Ordnance Disposal Market2018
Figure 9 Average Selling Price in Explosive Ordnance Disposal Market 2021-2026
Figure 10 Top Opportunites in Explosive Ordnance Disposal Market 2018-2019
Figure 11 Market Life Cycle Analysis in Explosive Ordnance Disposal Market
Figure 12 GlobalBy ProductExplosive Ordnance Disposal Market Revenue, 2021-2026 ($)
Figure 13 GlobalBy ApplicationExplosive Ordnance Disposal Market Revenue, 2021-2026 ($)
Figure 14 Global Explosive Ordnance Disposal Market - By Geography
Figure 15 Global Explosive Ordnance Disposal Market Value & Volume, By Geography, 2021-2026 ($)
Figure 16 Global Explosive Ordnance Disposal Market CAGR, By Geography, 2021-2026 (%)
Figure 17 North America Explosive Ordnance Disposal Market Value & Volume, 2021-2026 ($)
Figure 18 US Explosive Ordnance Disposal Market Value & Volume, 2021-2026 ($)
Figure 19 US GDP and Population, 2018-2019 ($)
Figure 20 US GDP – Composition of 2018, By Sector of Origin
Figure 21 US Export and Import Value & Volume, 2018-2019 ($)
Figure 22 Canada Explosive Ordnance Disposal Market Value & Volume, 2021-2026 ($)
Figure 23 Canada GDP and Population, 2018-2019 ($)
Figure 24 Canada GDP – Composition of 2018, By Sector of Origin
Figure 25 Canada Export and Import Value & Volume, 2018-2019 ($)
Figure 26 Mexico Explosive Ordnance Disposal Market Value & Volume, 2021-2026 ($)
Figure 27 Mexico GDP and Population, 2018-2019 ($)
Figure 28 Mexico GDP – Composition of 2018, By Sector of Origin
Figure 29 Mexico Export and Import Value & Volume, 2018-2019 ($)
Figure 30 South America Explosive Ordnance Disposal MarketSouth America 3D Printing Market Value & Volume, 2021-2026 ($)
Figure 31 Brazil Explosive Ordnance Disposal Market Value & Volume, 2021-2026 ($)
Figure 32 Brazil GDP and Population, 2018-2019 ($)
Figure 33 Brazil GDP – Composition of 2018, By Sector of Origin
Figure 34 Brazil Export and Import Value & Volume, 2018-2019 ($)
Figure 35 Venezuela Explosive Ordnance Disposal Market Value & Volume, 2021-2026 ($)
Figure 36 Venezuela GDP and Population, 2018-2019 ($)
Figure 37 Venezuela GDP – Composition of 2018, By Sector of Origin
Figure 38 Venezuela Export and Import Value & Volume, 2018-2019 ($)
Figure 39 Argentina Explosive Ordnance Disposal Market Value & Volume, 2021-2026 ($)
Figure 40 Argentina GDP and Population, 2018-2019 ($)
Figure 41 Argentina GDP – Composition of 2018, By Sector of Origin
Figure 42 Argentina Export and Import Value & Volume, 2018-2019 ($)
Figure 43 Ecuador Explosive Ordnance Disposal Market Value & Volume, 2021-2026 ($)
Figure 44 Ecuador GDP and Population, 2018-2019 ($)
Figure 45 Ecuador GDP – Composition of 2018, By Sector of Origin
Figure 46 Ecuador Export and Import Value & Volume, 2018-2019 ($)
Figure 47 Peru Explosive Ordnance Disposal Market Value & Volume, 2021-2026 ($)
Figure 48 Peru GDP and Population, 2018-2019 ($)
Figure 49 Peru GDP – Composition of 2018, By Sector of Origin
Figure 50 Peru Export and Import Value & Volume, 2018-2019 ($)
Figure 51 Colombia Explosive Ordnance Disposal Market Value & Volume, 2021-2026 ($)
Figure 52 Colombia GDP and Population, 2018-2019 ($)
Figure 53 Colombia GDP – Composition of 2018, By Sector of Origin
Figure 54 Colombia Export and Import Value & Volume, 2018-2019 ($)
Figure 55 Costa Rica Explosive Ordnance Disposal MarketCosta Rica 3D Printing Market Value & Volume, 2021-2026 ($)
Figure 56 Costa Rica GDP and Population, 2018-2019 ($)
Figure 57 Costa Rica GDP – Composition of 2018, By Sector of Origin
Figure 58 Costa Rica Export and Import Value & Volume, 2018-2019 ($)
Figure 59 Europe Explosive Ordnance Disposal Market Value & Volume, 2021-2026 ($)
Figure 60 U.K Explosive Ordnance Disposal Market Value & Volume, 2021-2026 ($)
Figure 61 U.K GDP and Population, 2018-2019 ($)
Figure 62 U.K GDP – Composition of 2018, By Sector of Origin
Figure 63 U.K Export and Import Value & Volume, 2018-2019 ($)
Figure 64 Germany Explosive Ordnance Disposal Market Value & Volume, 2021-2026 ($)
Figure 65 Germany GDP and Population, 2018-2019 ($)
Figure 66 Germany GDP – Composition of 2018, By Sector of Origin
Figure 67 Germany Export and Import Value & Volume, 2018-2019 ($)
Figure 68 Italy Explosive Ordnance Disposal Market Value & Volume, 2021-2026 ($)
Figure 69 Italy GDP and Population, 2018-2019 ($)
Figure 70 Italy GDP – Composition of 2018, By Sector of Origin
Figure 71 Italy Export and Import Value & Volume, 2018-2019 ($)
Figure 72 France Explosive Ordnance Disposal Market Value & Volume, 2021-2026 ($)
Figure 73 France GDP and Population, 2018-2019 ($)
Figure 74 France GDP – Composition of 2018, By Sector of Origin
Figure 75 France Export and Import Value & Volume, 2018-2019 ($)
Figure 76 Netherlands Explosive Ordnance Disposal Market Value & Volume, 2021-2026 ($)
Figure 77 Netherlands GDP and Population, 2018-2019 ($)
Figure 78 Netherlands GDP – Composition of 2018, By Sector of Origin
Figure 79 Netherlands Export and Import Value & Volume, 2018-2019 ($)
Figure 80 Belgium Explosive Ordnance Disposal Market Value & Volume, 2021-2026 ($)
Figure 81 Belgium GDP and Population, 2018-2019 ($)
Figure 82 Belgium GDP – Composition of 2018, By Sector of Origin
Figure 83 Belgium Export and Import Value & Volume, 2018-2019 ($)
Figure 84 Spain Explosive Ordnance Disposal Market Value & Volume, 2021-2026 ($)
Figure 85 Spain GDP and Population, 2018-2019 ($)
Figure 86 Spain GDP – Composition of 2018, By Sector of Origin
Figure 87 Spain Export and Import Value & Volume, 2018-2019 ($)
Figure 88 Denmark Explosive Ordnance Disposal Market Value & Volume, 2021-2026 ($)
Figure 89 Denmark GDP and Population, 2018-2019 ($)
Figure 90 Denmark GDP – Composition of 2018, By Sector of Origin
Figure 91 Denmark Export and Import Value & Volume, 2018-2019 ($)
Figure 92 APAC Explosive Ordnance Disposal Market Value & Volume, 2021-2026 ($)
Figure 93 China Explosive Ordnance Disposal MarketValue & Volume, 2021-2026
Figure 94 China GDP and Population, 2018-2019 ($)
Figure 95 China GDP – Composition of 2018, By Sector of Origin
Figure 96 China Export and Import Value & Volume, 2018-2019 ($)Explosive Ordnance Disposal MarketChina Export and Import Value & Volume, 2018-2019 ($)
Figure 97 Australia Explosive Ordnance Disposal Market Value & Volume, 2021-2026 ($)
Figure 98 Australia GDP and Population, 2018-2019 ($)
Figure 99 Australia GDP – Composition of 2018, By Sector of Origin
Figure 100 Australia Export and Import Value & Volume, 2018-2019 ($)
Figure 101 South Korea Explosive Ordnance Disposal Market Value & Volume, 2021-2026 ($)
Figure 102 South Korea GDP and Population, 2018-2019 ($)
Figure 103 South Korea GDP – Composition of 2018, By Sector of Origin
Figure 104 South Korea Export and Import Value & Volume, 2018-2019 ($)
Figure 105 India Explosive Ordnance Disposal Market Value & Volume, 2021-2026 ($)
Figure 106 India GDP and Population, 2018-2019 ($)
Figure 107 India GDP – Composition of 2018, By Sector of Origin
Figure 108 India Export and Import Value & Volume, 2018-2019 ($)
Figure 109 Taiwan Explosive Ordnance Disposal MarketTaiwan 3D Printing Market Value & Volume, 2021-2026 ($)
Figure 110 Taiwan GDP and Population, 2018-2019 ($)
Figure 111 Taiwan GDP – Composition of 2018, By Sector of Origin
Figure 112 Taiwan Export and Import Value & Volume, 2018-2019 ($)
Figure 113 Malaysia Explosive Ordnance Disposal MarketMalaysia 3D Printing Market Value & Volume, 2021-2026 ($)
Figure 114 Malaysia GDP and Population, 2018-2019 ($)
Figure 115 Malaysia GDP – Composition of 2018, By Sector of Origin
Figure 116 Malaysia Export and Import Value & Volume, 2018-2019 ($)
Figure 117 Hong Kong Explosive Ordnance Disposal MarketHong Kong 3D Printing Market Value & Volume, 2021-2026 ($)
Figure 118 Hong Kong GDP and Population, 2018-2019 ($)
Figure 119 Hong Kong GDP – Composition of 2018, By Sector of Origin
Figure 120 Hong Kong Export and Import Value & Volume, 2018-2019 ($)
Figure 121 Middle East & Africa Explosive Ordnance Disposal MarketMiddle East & Africa 3D Printing Market Value & Volume, 2021-2026 ($)
Figure 122 Russia Explosive Ordnance Disposal MarketRussia 3D Printing Market Value & Volume, 2021-2026 ($)
Figure 123 Russia GDP and Population, 2018-2019 ($)
Figure 124 Russia GDP – Composition of 2018, By Sector of Origin
Figure 125 Russia Export and Import Value & Volume, 2018-2019 ($)
Figure 126 Israel Explosive Ordnance Disposal Market Value & Volume, 2021-2026 ($)
Figure 127 Israel GDP and Population, 2018-2019 ($)
Figure 128 Israel GDP – Composition of 2018, By Sector of Origin
Figure 129 Israel Export and Import Value & Volume, 2018-2019 ($)
Figure 130 Entropy Share, By Strategies, 2018-2019* (%)Explosive Ordnance Disposal Market
Figure 131 Developments, 2018-2019*Explosive Ordnance Disposal Market
Figure 132 Company 1 Explosive Ordnance Disposal Market Net Revenue, By Years, 2018-2019* ($)
Figure 133 Company 1 Explosive Ordnance Disposal Market Net Revenue Share, By Business segments, 2018 (%)
Figure 134 Company 1 Explosive Ordnance Disposal Market Net Sales Share, By Geography, 2018 (%)
Figure 135 Company 2 Explosive Ordnance Disposal Market Net Revenue, By Years, 2018-2019* ($)
Figure 136 Company 2 Explosive Ordnance Disposal Market Net Revenue Share, By Business segments, 2018 (%)
Figure 137 Company 2 Explosive Ordnance Disposal Market Net Sales Share, By Geography, 2018 (%)
Figure 138 Company 3Explosive Ordnance Disposal Market Net Revenue, By Years, 2018-2019* ($)
Figure 139 Company 3Explosive Ordnance Disposal Market Net Revenue Share, By Business segments, 2018 (%)
Figure 140 Company 3Explosive Ordnance Disposal Market Net Sales Share, By Geography, 2018 (%)
Figure 141 Company 4 Explosive Ordnance Disposal Market Net Revenue, By Years, 2018-2019* ($)
Figure 142 Company 4 Explosive Ordnance Disposal Market Net Revenue Share, By Business segments, 2018 (%)
Figure 143 Company 4 Explosive Ordnance Disposal Market Net Sales Share, By Geography, 2018 (%)
Figure 144 Company 5 Explosive Ordnance Disposal Market Net Revenue, By Years, 2018-2019* ($)
Figure 145 Company 5 Explosive Ordnance Disposal Market Net Revenue Share, By Business segments, 2018 (%)
Figure 146 Company 5 Explosive Ordnance Disposal Market Net Sales Share, By Geography, 2018 (%)
Figure 147 Company 6 Explosive Ordnance Disposal Market Net Revenue, By Years, 2018-2019* ($)
Figure 148 Company 6 Explosive Ordnance Disposal Market Net Revenue Share, By Business segments, 2018 (%)
Figure 149 Company 6 Explosive Ordnance Disposal Market Net Sales Share, By Geography, 2018 (%)
Figure 150 Company 7 Explosive Ordnance Disposal Market Net Revenue, By Years, 2018-2019* ($)
Figure 151 Company 7 Explosive Ordnance Disposal Market Net Revenue Share, By Business segments, 2018 (%)
Figure 152 Company 7 Explosive Ordnance Disposal Market Net Sales Share, By Geography, 2018 (%)
Figure 153 Company 8 Explosive Ordnance Disposal Market Net Revenue, By Years, 2018-2019* ($)
Figure 154 Company 8 Explosive Ordnance Disposal Market Net Revenue Share, By Business segments, 2018 (%)
Figure 155 Company 8 Explosive Ordnance Disposal Market Net Sales Share, By Geography, 2018 (%)
Figure 156 Company 9 Explosive Ordnance Disposal Market Net Revenue, By Years, 2018-2019* ($)
Figure 157 Company 9 Explosive Ordnance Disposal Market Net Revenue Share, By Business segments, 2018 (%)
Figure 158 Company 9 Explosive Ordnance Disposal Market Net Sales Share, By Geography, 2018 (%)
Figure 159 Company 10 Explosive Ordnance Disposal Market Net Revenue, By Years, 2018-2019* ($)
Figure 160 Company 10 Explosive Ordnance Disposal Market Net Revenue Share, By Business segments, 2018 (%)
Figure 161 Company 10 Explosive Ordnance Disposal Market Net Sales Share, By Geography, 2018 (%)
Figure 162 Company 11 Explosive Ordnance Disposal Market Net Revenue, By Years, 2018-2019* ($)
Figure 163 Company 11 Explosive Ordnance Disposal Market Net Revenue Share, By Business segments, 2018 (%)
Figure 164 Company 11 Explosive Ordnance Disposal Market Net Sales Share, By Geography, 2018 (%)
Figure 165 Company 12 Explosive Ordnance Disposal Market Net Revenue, By Years, 2018-2019* ($)
Figure 166 Company 12 Explosive Ordnance Disposal Market Net Revenue Share, By Business segments, 2018 (%)
Figure 167 Company 12 Explosive Ordnance Disposal Market Net Sales Share, By Geography, 2018 (%)
Figure 168 Company 13Explosive Ordnance Disposal Market Net Revenue, By Years, 2018-2019* ($)
Figure 169 Company 13Explosive Ordnance Disposal Market Net Revenue Share, By Business segments, 2018 (%)
Figure 170 Company 13Explosive Ordnance Disposal Market Net Sales Share, By Geography, 2018 (%)
Figure 171 Company 14 Explosive Ordnance Disposal Market Net Revenue, By Years, 2018-2019* ($)
Figure 172 Company 14 Explosive Ordnance Disposal Market Net Revenue Share, By Business segments, 2018 (%)
Figure 173 Company 14 Explosive Ordnance Disposal Market Net Sales Share, By Geography, 2018 (%)
Figure 174 Company 15 Explosive Ordnance Disposal Market Net Revenue, By Years, 2018-2019* ($)
Figure 175 Company 15 Explosive Ordnance Disposal Market Net Revenue Share, By Business segments, 2018 (%)
Figure 176 Company 15 Explosive Ordnance Disposal Market Net Sales Share, By Geography, 2018 (%)