 Email
Email Print
Print


Intragastric Balloons Market - Forecast(2024 - 2030)
Intragastric Balloon Market Overview:
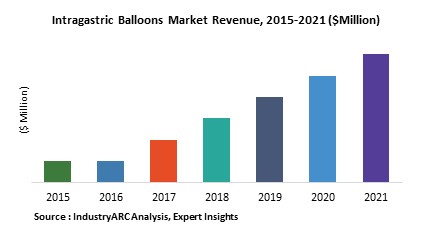
The Intragastric Balloon Market is a very small market from the, market players point of view, having come into the picture actively only since the past few years. There are less than a dozen players in the market of which the leading player is Apollo Endosurgery. The Intragastric balloon market reportedly made a revenue of around $70 million in 2017 and is expected to grow at a CAGR of 25.47% during the forecast period 2018-2023.
Intragastric Balloon Market Outlook:
Intragastric Balloons are inflatable balloon like sacs that are primarily used for weight loss procedures, when other traditional methods of dieting and exercise haven’t worked. They work by being placed inside the stomach walls either by a minimally invasive surgery or by non-surgical procedures, once placed they are inflated by being filled with either a liquid saline solution or air, due to which they occupy a large volume within the stomach. This gives the patient a feeling of satiety, and with the help of a controlled diet and exercise the patient can reduce eating portions and lose weight. The balloons are kept within the stomach for only 6 months and are either removed by endoscopy or they deflate automatically and pass through the digestive system. With the rise in obesity levels and aging population globally a non-surgical bariatric procedure seems to hold an advantage over the scarring ones due to which the market for Intragastric Balloons is expected to see a good growth level.
Intragastric Balloon Market Growth drivers:
Major drivers for the Intragastric Balloons is the fact that it is a non-surgical procedure, the balloon is placed either by an oral pill or by an endoscopic procedure, and takes only around 30 minutes to be setup. The idea of not leaving any scars is an extremely inviting one. This has been a major growth driver for the market of Intragastric Balloons.
Another major factor has been the rise in obesity levels globally and especially in the US, where around 40% of the population is reported to be obese. Obesity has a lot of adverse effects, which also leads to comorbid diagnosis. This growing trend in the health and lifestyle of people is a major avenue for the product to inculcate a healthy lifestyle in the population.
Intragastric Balloon Market Challenges:
Challenges faced by the market pertain to that not every patient can undergo this procedure. The patient’s Body Mass Index (BMI) needs to be in between 30 to 40, cannot be used on patients who have had any sort of previous gastro surgery and cannot be used by patients having drugs or alcohol addiction. This forms a major constraint on the market size.
Another challenge also faced by the market is the side effects with the procedure where, up to 2 weeks after the placement of the balloon device the patient can have nausea, vomiting, stomach cramps, reflux and other symptoms. It also depends on the psychology of the patients and his readiness with having a foreign object placed inside his body.
Intragastric Balloon Market Research Scope:
The base year of the study is 2017, with forecast done up to 2023. The study presents a thorough analysis of the competitive landscape, taking into account the market shares of the leading companies. It also provides information on unit shipments. These provide the key market participants with the necessary business intelligence and help them understand the future of the Intragastric Balloon Market. The assessment includes the forecast, an overview of the competitive structure, the market shares of the competitors, as well as the market trends, market demands, market drivers, market challenges, and product analysis. The market drivers and restraints have been assessed to fathom their impact over the forecast period. This report further identifies the key opportunities for growth while also detailing the key challenges and possible threats. The key areas of focus include the types of plastics in the electric vehicle market, and their specific applications in different types of vehicles.
Intragastric Balloon (SAP) Market Report: Industry Coverage
Intragastric Balloon Market– By Filler Material: Saline filled and Air filled.
Intragastric Balloon Market– By Implanting Procedure: Surgical and Non-Surgical.
Intragastric Balloon Market – By Type: Single Intragastric Balloon and Double Intragastric Balloon.
Intragastric Balloon Market– By Application Areas: Obesity, Diabetes, Diet Control, Weight-loss, Pre-operative Weight Reduction and others.
Intragastric Balloon Market – By End User Industry: Medical and Health care Industry: Hospitals and Clinics.
The Intragastric Balloon Market report also analyzes the major geographic regions for the market as well as the major countries for the market in these regions. The regions and countries covered in the study include:
- North America: The U.S., Canada, Mexico
- South America: Brazil, Venezuela, Argentina, Ecuador, Peru, Colombia, Costa Rica
- Europe: The U.K., Germany, Italy, France, The Netherlands, Belgium, Spain, Denmark
- APAC: China, Japan, Australia, South Korea, India, Taiwan, Malaysia, Hong Kong
- Middle East and Africa: Israel, South Africa, Saudi Arabia
Intragastric Balloon Market Key Players Perspective:
Some of the Key players in this market that have been studied for this report include: Apollo Endosurgery, Obalaon therapeutics, ReShape, Spartz Medical, Allurion, Medsil, Medicone, Silimed, Endalis and Districlass among others .
Market Research and Market Trends of Intragastric Balloon Market
- One increasing trend that is noticed in the market is the approval from regulatory bodies such as the FDA in the US for this medical device and its related procedure followed by the accepting nod by the American Society for Metabolic and Bariatric surgery. These approvals are sure to be replicated in other countries as well which will be a positive factor for the market of Intragastric Balloons as its application becomes more standardized.
- Another global trend that is seen is the increase in obesity level in the population. According to the World Health Organization (WHO) global obesity levels have triples since the 1975. In 2016, around 40% of the adults above the age of 18 were overweight and 13% were obese. Obesity also leads to other comorbid diagnosis, like ischemic strokes and diabetes among other diseases, and hence this trend can positively push the market for Intragastric Balloons as a non-scarring non-surgical procedure for weight loss.
- The many research reports also showcasing the positive effects of the Intragastric Balloons also points towards a trend of increasing acceptance of this not very old procedure. Tis reflects positively on the market and points towards a higher recommendation and usage of this procedure for weight loss.
1. Intragastric Balloon Market - Overview
1.1. Definitions and Scope
2. Intragastric Balloon Market - Executive summary
2.1. Market Revenue, Market Size and Key Trends by Company
2.2. Key Trends by type of Application
2.3. Key Trends segmented by Geography
3. Intragastric Balloon Market
3.1. Comparative analysis
3.1.1. Product Benchmarking - Top 10 companies
3.1.2. Top 5 Financials Analysis
3.1.3. Market Value split by Top 10 companies
3.1.4. Patent Analysis - Top 10 companies
3.1.5. Pricing Analysis
4. Intragastric Balloon Market – Startup companies Scenario Premium
4.1. Top 10 startup company Analysis by
4.1.1. Investment
4.1.2. Revenue
4.1.3. Market Shares
4.1.4. Market Size and Application Analysis
4.1.5. Venture Capital and Funding Scenario
5. Intragastric Balloon Market – Industry Market Entry Scenario Premium
5.1. Regulatory Framework Overview
5.2. New Business and Ease of Doing business index
5.3. Case studies of successful ventures
5.4. Customer Analysis – Top 10 companies
6. Intragastric Balloon Market Forces
6.1. Drivers
6.2. Constraints
6.3. Challenges
6.4. Porters five force model
6.4.1. Bargaining power of suppliers
6.4.2. Bargaining powers of customers
6.4.3. Threat of new entrants
6.4.4. Rivalry among existing players
6.4.5. Threat of substitutes
7. Intragastric Balloon Market -Strategic analysis
7.1. Value chain analysis
7.2. Opportunities analysis
7.3. Product life cycle
8. Intragastric Balloon Market– By Filler Material (Market Size -$Million / $Billion)
8.1. Segment type Size and Market Share Analysis
8.2. Application Revenue and Trends by type of Application
8.3. Application Segment Analysis by Type
8.3.1. Saline filled
8.3.2. Air filled
8.3.3. Others
9. Title Market – By Implanting Procedure (Market Size -$Million / $Billion)
9.1. Surgical
9.2. Non-Surgical
9.2.1. Oral Pill
9.2.2. Endoscopic Placement
9.3. Others
10. Title Market – By Type (Market Size -$Million / $Billion)
10.1. Single Intragastric Balloon
10.2. Double Intragastric Balloon
11. Title Market – By Application Areas (Market Size -$Million / $Billion)
11.1. Obesity
11.2. Diabetes
11.3. Diet Control
11.4. Weight-loss
11.5. Pre-operative Weight Reduction
11.6. Others
12. Intragastric Balloon Market – By End User Industry (Market Size -$Million / $Billion)
12.1. Market Size and Market Share Analysis
12.2. Application Revenue and Trend Research
12.3. Product Segment Analysis
12.3.1. Medical and Health care Industry
12.3.1.1. Hospitals
12.3.1.2. Clinics
12.3.2. Others
13. Intragastric Balloon Market- By Geography (Market Size -$Million / $Billion)
13.1. Intragastric Balloon Market - North America Segment Research
13.2. North America Market Research (Million / $Billion)
13.2.1. Segment type Size and Market Size Analysis
13.2.2. Revenue and Trends
13.2.3. Application Revenue and Trends by type of Application
13.2.4. Company Revenue and Product Analysis
13.2.5. North America Product type and Application Market Size
13.2.5.1. U.S.
13.2.5.2. Canada
13.2.5.3. Mexico
13.2.5.4. Rest of North America
13.3. Intragastric Balloon Market- South America Segment Research
13.4. South America Market Research (Market Size -$Million / $Billion)
13.4.1. Segment type Size and Market Size Analysis
13.4.2. Revenue and Trends
13.4.3. Application Revenue and Trends by type of Application
13.4.4. Company Revenue and Product Analysis
13.4.5. South America Product type and Application Market Size
13.4.5.1. Brazil
13.4.5.2. Venezuela
13.4.5.3. Argentina
13.4.5.4. Ecuador
13.4.5.5. Peru
13.4.5.6. Colombia
13.4.5.7. Costa Rica
13.4.5.8. Rest of South America
13.5. Intragastric Balloon Market- Europe Segment Research
13.6. Europe Market Research (Market Size -$Million / $Billion)
13.6.1. Segment type Size and Market Size Analysis
13.6.2. Revenue and Trends
13.6.3. Application Revenue and Trends by type of Application
13.6.4. Company Revenue and Product Analysis
13.6.5. Europe Segment Product type and Application Market Size
13.6.5.1. U.K
13.6.5.2. Germany
13.6.5.3. Italy
13.6.5.4. France
13.6.5.5. Netherlands
13.6.5.6. Belgium
13.6.5.7. Spain
13.6.5.8. Denmark
13.6.5.9. Rest of Europe
13.7. Intragastric Balloon Market– APAC Segment Research
13.8. APAC Market Research (Market Size -$Million / $Billion)
13.8.1. Segment type Size and Market Size Analysis
13.8.2. Revenue and Trends
13.8.3. Application Revenue and Trends by type of Application
13.8.4. Company Revenue and Product Analysis
13.8.5. APAC Segment – Product type and Application Market Size
13.8.5.1. China
13.8.5.2. Australia
13.8.5.3. Japan
13.8.5.4. South Korea
13.8.5.5. India
13.8.5.6. Taiwan
13.8.5.7. Malaysia
13.8.5.8. Hong Kong
13.8.5.9. Rest of APAC
13.9. Intragastric Balloon Market– Middle East Segment and Africa Segment Research
13.10. Middle East & Africa Market Research (Market Size -$Million / $Billion)
13.10.1. Segment type Size and Market Size Analysis
13.10.2. Revenue and Trend Analysis
13.10.3. Application Revenue and Trends by type of Application
13.10.4. Company Revenue and Product Analysis
13.10.5. Middle East Segment Product type and Application Market Size
13.10.5.1. Israel
13.10.5.2. Saudi Arabia
13.10.5.3. UAE
13.10.6. Africa Segment Analysis
13.10.6.1. South Africa
13.10.6.2. Rest of Middle East & Africa
14. Intragastric Balloon Market - Entropy
14.1. New product launches
14.2. M&A's, collaborations, JVs and partnerships
15. Intragastric Balloon Market – Industry / Segment Competition landscape Premium
15.1. Market Share Analysis
15.1.1. Market Share by Country- Top companies
15.1.2. Market Share by Region- Top 10 companies
15.1.3. Market Share by type of Application – Top 10 companies
15.1.4. Market Share by type of Product / Product category- Top 10 companies
15.1.5. Market Share at global level- Top 10 companies
15.1.6. Best Practices for companies
16. Intragastric Balloon Market – Key Company List by Country Premium
17. Intragastric Balloon Market Company Analysis
17.1. Market Share, Company Revenue, Products, M&A, Developments
17.2. Apollo Endosurgery
17.3. Obalaon therapeutics
17.4. ReShape
17.5. Spartz Medical
17.6. Allurion
17.7. Medsil
17.8. Medicone
17.9. Silimed
17.10. Endalis
17.11. Districlass
17.12. Company 10
17.13. Company 11
17.14. Company 12 and more
"*Financials would be provided on a best efforts basis for private companies"
18. Intragastric Balloon Market -Appendix
18.1. Abbreviations
18.2. Sources
19. Intragastric Balloon Market -Methodology Premium
19.1. Research Methodology
19.1.1. Company Expert Interviews
19.1.2. Industry Databases
19.1.3. Associations
19.1.4. Company News
19.1.5. Company Annual Reports
19.1.6. Application Trends
19.1.7. New Products and Product database
19.1.8. Company Transcripts
19.1.9. R&D Trends
19.1.10. Key Opinion Leaders Interviews
19.1.11. Supply and Demand Trends
List of Tables:
Table 1: Intragastric Balloons Market Overview 2021-2026
Table 2: Intragastric Balloons Market Leader Analysis 2018-2019 (US$)
Table 3: Intragastric Balloons Market Product Analysis 2018-2019 (US$)
Table 4: Intragastric Balloons Market End User Analysis 2018-2019 (US$)
Table 5: Intragastric Balloons Market Patent Analysis 2013-2018* (US$)
Table 6: Intragastric Balloons Market Financial Analysis 2018-2019 (US$)
Table 7: Intragastric Balloons Market Driver Analysis 2018-2019 (US$)
Table 8: Intragastric Balloons Market Challenges Analysis 2018-2019 (US$)
Table 9: Intragastric Balloons Market Constraint Analysis 2018-2019 (US$)
Table 10: Intragastric Balloons Market Supplier Bargaining Power Analysis 2018-2019 (US$)
Table 11: Intragastric Balloons Market Buyer Bargaining Power Analysis 2018-2019 (US$)
Table 12: Intragastric Balloons Market Threat of Substitutes Analysis 2018-2019 (US$)
Table 13: Intragastric Balloons Market Threat of New Entrants Analysis 2018-2019 (US$)
Table 14: Intragastric Balloons Market Degree of Competition Analysis 2018-2019 (US$)
Table 15: Intragastric Balloons Market Value Chain Analysis 2018-2019 (US$)
Table 16: Intragastric Balloons Market Pricing Analysis 2021-2026 (US$)
Table 17: Intragastric Balloons Market Opportunities Analysis 2021-2026 (US$)
Table 18: Intragastric Balloons Market Product Life Cycle Analysis 2021-2026 (US$)
Table 19: Intragastric Balloons Market Supplier Analysis 2018-2019 (US$)
Table 20: Intragastric Balloons Market Distributor Analysis 2018-2019 (US$)
Table 21: Intragastric Balloons Market Trend Analysis 2018-2019 (US$)
Table 22: Intragastric Balloons Market Size 2018 (US$)
Table 23: Intragastric Balloons Market Forecast Analysis 2021-2026 (US$)
Table 24: Intragastric Balloons Market Sales Forecast Analysis 2021-2026 (Units)
Table 25: Intragastric Balloons Market , Revenue & Volume, By Filling Material, 2021-2026 ($)
Table 26: Intragastric Balloons Market By Filling Material, Revenue & Volume, By Fluid filled, 2021-2026 ($)
Table 27: Intragastric Balloons Market By Filling Material, Revenue & Volume, By Air filled, 2021-2026 ($)
Table 28: Intragastric Balloons Market , Revenue & Volume, By Type, 2021-2026 ($)
Table 29: Intragastric Balloons Market By Type, Revenue & Volume, By Single intragastric Balloon, 2021-2026 ($)
Table 30: Intragastric Balloons Market By Type, Revenue & Volume, By Double Intragastric Balloon, 2021-2026 ($)
Table 31: Intragastric Balloons Market By Type, Revenue & Volume, By Triple Intragastric Balloon, 2021-2026 ($)
Table 32: Intragastric Balloons Market , Revenue & Volume, By End User, 2021-2026 ($)
Table 33: Intragastric Balloons Market By End User, Revenue & Volume, By Hospitals, 2021-2026 ($)
Table 34: Intragastric Balloons Market By End User, Revenue & Volume, By Surgery Centers, 2021-2026 ($)
Table 35: Intragastric Balloons Market By End User, Revenue & Volume, By Clinics, 2021-2026 ($)
Table 36: North America Intragastric Balloons Market , Revenue & Volume, By Filling Material, 2021-2026 ($)
Table 37: North America Intragastric Balloons Market , Revenue & Volume, By Type, 2021-2026 ($)
Table 38: North America Intragastric Balloons Market , Revenue & Volume, By End User, 2021-2026 ($)
Table 39: South america Intragastric Balloons Market , Revenue & Volume, By Filling Material, 2021-2026 ($)
Table 40: South america Intragastric Balloons Market , Revenue & Volume, By Type, 2021-2026 ($)
Table 41: South america Intragastric Balloons Market , Revenue & Volume, By End User, 2021-2026 ($)
Table 42: Europe Intragastric Balloons Market , Revenue & Volume, By Filling Material, 2021-2026 ($)
Table 43: Europe Intragastric Balloons Market , Revenue & Volume, By Type, 2021-2026 ($)
Table 44: Europe Intragastric Balloons Market , Revenue & Volume, By End User, 2021-2026 ($)
Table 45: APAC Intragastric Balloons Market , Revenue & Volume, By Filling Material, 2021-2026 ($)
Table 46: APAC Intragastric Balloons Market , Revenue & Volume, By Type, 2021-2026 ($)
Table 47: APAC Intragastric Balloons Market , Revenue & Volume, By End User, 2021-2026 ($)
Table 48: Middle East & Africa Intragastric Balloons Market , Revenue & Volume, By Filling Material, 2021-2026 ($)
Table 49: Middle East & Africa Intragastric Balloons Market , Revenue & Volume, By Type, 2021-2026 ($)
Table 50: Middle East & Africa Intragastric Balloons Market , Revenue & Volume, By End User, 2021-2026 ($)
Table 51: Russia Intragastric Balloons Market , Revenue & Volume, By Filling Material, 2021-2026 ($)
Table 52: Russia Intragastric Balloons Market , Revenue & Volume, By Type, 2021-2026 ($)
Table 53: Russia Intragastric Balloons Market , Revenue & Volume, By End User, 2021-2026 ($)
Table 54: Israel Intragastric Balloons Market , Revenue & Volume, By Filling Material, 2021-2026 ($)
Table 55: Israel Intragastric Balloons Market , Revenue & Volume, By Type, 2021-2026 ($)
Table 56: Israel Intragastric Balloons Market , Revenue & Volume, By End User, 2021-2026 ($)
Table 57: Top Companies 2018 (US$) Intragastric Balloons Market , Revenue & Volume
Table 58: Product Launch 2018-2019 Intragastric Balloons Market , Revenue & Volume
Table 59: Mergers & Acquistions 2018-2019 Intragastric Balloons Market , Revenue & Volume
List of Figures:
Figure 1: Overview of Intragastric Balloons Market 2021-2026
Figure 2: Market Share Analysis for Intragastric Balloons Market 2018 (US$)
Figure 3: Product Comparison in Intragastric Balloons Market 2018-2019 (US$)
Figure 4: End User Profile for Intragastric Balloons Market 2018-2019 (US$)
Figure 5: Patent Application and Grant in Intragastric Balloons Market 2013-2018* (US$)
Figure 6: Top 5 Companies Financial Analysis in Intragastric Balloons Market 2018-2019 (US$)
Figure 7: Market Entry Strategy in Intragastric Balloons Market 2018-2019
Figure 8: Ecosystem Analysis in Intragastric Balloons Market 2018
Figure 9: Average Selling Price in Intragastric Balloons Market 2021-2026
Figure 10: Top Opportunites in Intragastric Balloons Market 2018-2019
Figure 11: Market Life Cycle Analysis in Intragastric Balloons Market
Figure 12: GlobalBy Filling Material Intragastric Balloons Market Revenue, 2021-2026 ($)
Figure 13: GlobalBy Type Intragastric Balloons Market Revenue, 2021-2026 ($)
Figure 14: GlobalBy End User Intragastric Balloons Market Revenue, 2021-2026 ($)
Figure 15: Global Intragastric Balloons Market - By Geography
Figure 16: Global Intragastric Balloons Market Value & Volume, By Geography, 2021-2026 ($)
Figure 17: Global Intragastric Balloons Market CAGR, By Geography, 2021-2026 (%)
Figure 18: North America Intragastric Balloons Market Value & Volume, 2021-2026 ($)
Figure 19: US Intragastric Balloons Market Value & Volume, 2021-2026 ($)
Figure 20: US GDP and Population, 2018-2019 ($)
Figure 21: US GDP – Composition of 2018, By Sector of Origin
Figure 22: US Export and Import Value & Volume, 2018-2019 ($)
Figure 23: Canada Intragastric Balloons Market Value & Volume, 2021-2026 ($)
Figure 24: Canada GDP and Population, 2018-2019 ($)
Figure 25: Canada GDP – Composition of 2018, By Sector of Origin
Figure 26: Canada Export and Import Value & Volume, 2018-2019 ($)
Figure 27: Mexico Intragastric Balloons Market Value & Volume, 2021-2026 ($)
Figure 28: Mexico GDP and Population, 2018-2019 ($)
Figure 29: Mexico GDP – Composition of 2018, By Sector of Origin
Figure 30: Mexico Export and Import Value & Volume, 2018-2019 ($)
Figure 31: South America Intragastric Balloons Market Value & Volume, 2021-2026 ($)
Figure 32: Brazil Intragastric Balloons Market Value & Volume, 2021-2026 ($)
Figure 33: Brazil GDP and Population, 2018-2019 ($)
Figure 34: Brazil GDP – Composition of 2018, By Sector of Origin
Figure 35: Brazil Export and Import Value & Volume, 2018-2019 ($)
Figure 36: Venezuela Intragastric Balloons Market Value & Volume, 2021-2026 ($)
Figure 37: Venezuela GDP and Population, 2018-2019 ($)
Figure 38: Venezuela GDP – Composition of 2018, By Sector of Origin
Figure 39: Venezuela Export and Import Value & Volume, 2018-2019 ($)
Figure 40: Argentina Intragastric Balloons Market Value & Volume, 2021-2026 ($)
Figure 41: Argentina GDP and Population, 2018-2019 ($)
Figure 42: Argentina GDP – Composition of 2018, By Sector of Origin
Figure 43: Argentina Export and Import Value & Volume, 2018-2019 ($)
Figure 44: Ecuador Intragastric Balloons Market Value & Volume, 2021-2026 ($)
Figure 45: Ecuador GDP and Population, 2018-2019 ($)
Figure 46: Ecuador GDP – Composition of 2018, By Sector of Origin
Figure 47: Ecuador Export and Import Value & Volume, 2018-2019 ($)
Figure 48: Peru Intragastric Balloons Market Value & Volume, 2021-2026 ($)
Figure 49: Peru GDP and Population, 2018-2019 ($)
Figure 50: Peru GDP – Composition of 2018, By Sector of Origin
Figure 51: Peru Export and Import Value & Volume, 2018-2019 ($)
Figure 52: Colombia Intragastric Balloons Market Value & Volume, 2021-2026 ($)
Figure 53: Colombia GDP and Population, 2018-2019 ($)
Figure 54: Colombia GDP – Composition of 2018, By Sector of Origin
Figure 55: Colombia Export and Import Value & Volume, 2018-2019 ($)
Figure 56: Costa Rica Intragastric Balloons Market Value & Volume, 2021-2026 ($)
Figure 57: Costa Rica GDP and Population, 2018-2019 ($)
Figure 58: Costa Rica GDP – Composition of 2018, By Sector of Origin
Figure 59: Costa Rica Export and Import Value & Volume, 2018-2019 ($)
Figure 60: Europe Intragastric Balloons Market Value & Volume, 2021-2026 ($)
Figure 61: U.K Intragastric Balloons Market Value & Volume, 2021-2026 ($)
Figure 62: U.K GDP and Population, 2018-2019 ($)
Figure 63: U.K GDP – Composition of 2018, By Sector of Origin
Figure 64: U.K Export and Import Value & Volume, 2018-2019 ($)
Figure 65: Germany Intragastric Balloons Market Value & Volume, 2021-2026 ($)
Figure 66: Germany GDP and Population, 2018-2019 ($)
Figure 67: Germany GDP – Composition of 2018, By Sector of Origin
Figure 68: Germany Export and Import Value & Volume, 2018-2019 ($)
Figure 69: Italy Intragastric Balloons Market Value & Volume, 2021-2026 ($)
Figure 70: Italy GDP and Population, 2018-2019 ($)
Figure 71: Italy GDP – Composition of 2018, By Sector of Origin
Figure 72: Italy Export and Import Value & Volume, 2018-2019 ($)
Figure 73: France Intragastric Balloons Market Value & Volume, 2021-2026 ($)
Figure 74: France GDP and Population, 2018-2019 ($)
Figure 75: France GDP – Composition of 2018, By Sector of Origin
Figure 76: France Export and Import Value & Volume, 2018-2019 ($)
Figure 77: Netherlands Intragastric Balloons Market Value & Volume, 2021-2026 ($)
Figure 78: Netherlands GDP and Population, 2018-2019 ($)
Figure 79: Netherlands GDP – Composition of 2018, By Sector of Origin
Figure 80: Netherlands Export and Import Value & Volume, 2018-2019 ($)
Figure 81: Belgium Intragastric Balloons Market Value & Volume, 2021-2026 ($)
Figure 82: Belgium GDP and Population, 2018-2019 ($)
Figure 83: Belgium GDP – Composition of 2018, By Sector of Origin
Figure 84: Belgium Export and Import Value & Volume, 2018-2019 ($)
Figure 85: Spain Intragastric Balloons Market Value & Volume, 2021-2026 ($)
Figure 86: Spain GDP and Population, 2018-2019 ($)
Figure 87: Spain GDP – Composition of 2018, By Sector of Origin
Figure 88: Spain Export and Import Value & Volume, 2018-2019 ($)
Figure 89: Denmark Intragastric Balloons Market Value & Volume, 2021-2026 ($)
Figure 90: Denmark GDP and Population, 2018-2019 ($)
Figure 91: Denmark GDP – Composition of 2018, By Sector of Origin
Figure 92: Denmark Export and Import Value & Volume, 2018-2019 ($)
Figure 93: APAC Intragastric Balloons Market Value & Volume, 2021-2026 ($)
Figure 94: China Intragastric Balloons Market Value & Volume, 2021-2026
Figure 95: China GDP and Population, 2018-2019 ($)
Figure 96: China GDP – Composition of 2018, By Sector of Origin
Figure 97: China Export and Import Value & Volume, 2018-2019 ($) Intragastric Balloons Market China Export and Import Value & Volume, 2018-2019 ($)
Figure 98: Australia Intragastric Balloons Market Value & Volume, 2021-2026 ($)
Figure 99: Australia GDP and Population, 2018-2019 ($)
Figure 100: Australia GDP – Composition of 2018, By Sector of Origin
Figure 101: Australia Export and Import Value & Volume, 2018-2019 ($)
Figure 102: South Korea Intragastric Balloons Market Value & Volume, 2021-2026 ($)
Figure 103: South Korea GDP and Population, 2018-2019 ($)
Figure 104: South Korea GDP – Composition of 2018, By Sector of Origin
Figure 105: South Korea Export and Import Value & Volume, 2018-2019 ($)
Figure 106: India Intragastric Balloons Market Value & Volume, 2021-2026 ($)
Figure 107: India GDP and Population, 2018-2019 ($)
Figure 108: India GDP – Composition of 2018, By Sector of Origin
Figure 109: India Export and Import Value & Volume, 2018-2019 ($)
Figure 110: Taiwan Intragastric Balloons Market Value & Volume, 2021-2026 ($)
Figure 111: Taiwan GDP and Population, 2018-2019 ($)
Figure 112: Taiwan GDP – Composition of 2018, By Sector of Origin
Figure 113: Taiwan Export and Import Value & Volume, 2018-2019 ($)
Figure 114: Malaysia Intragastric Balloons Market Value & Volume, 2021-2026 ($)
Figure 115: Malaysia GDP and Population, 2018-2019 ($)
Figure 116: Malaysia GDP – Composition of 2018, By Sector of Origin
Figure 117: Malaysia Export and Import Value & Volume, 2018-2019 ($)
Figure 118: Hong Kong Intragastric Balloons Market Value & Volume, 2021-2026 ($)
Figure 119: Hong Kong GDP and Population, 2018-2019 ($)
Figure 120: Hong Kong GDP – Composition of 2018, By Sector of Origin
Figure 121: Hong Kong Export and Import Value & Volume, 2018-2019 ($)
Figure 122: Middle East & Africa Intragastric Balloons Market Middle East & Africa 3D Printing Market Value & Volume, 2021-2026 ($)
Figure 123: Russia Intragastric Balloons Market Value & Volume, 2021-2026 ($)
Figure 124: Russia GDP and Population, 2018-2019 ($)
Figure 125: Russia GDP – Composition of 2018, By Sector of Origin
Figure 126: Russia Export and Import Value & Volume, 2018-2019 ($)
Figure 127: Israel Intragastric Balloons Market Value & Volume, 2021-2026 ($)
Figure 128: Israel GDP and Population, 2018-2019 ($)
Figure 129: Israel GDP – Composition of 2018, By Sector of Origin
Figure 130: Israel Export and Import Value & Volume, 2018-2019 ($)
Figure 131: Entropy Share, By Strategies, 2018-2019* (%) Intragastric Balloons Market
Figure 132: Developments, 2018-2019* Intragastric Balloons Market
Figure 133: Company 1 Intragastric Balloons Market Net Revenue, By Years, 2018-2019* ($)
Figure 134: Company 1 Intragastric Balloons Market Net Revenue Share, By Business segments, 2018 (%)
Figure 135: Company 1 Intragastric Balloons Market Net Sales Share, By Geography, 2018 (%)
Figure 136: Company 2 Intragastric Balloons Market Net Revenue, By Years, 2018-2019* ($)
Figure 137: Company 2 Intragastric Balloons Market Net Revenue Share, By Business segments, 2018 (%)
Figure 138: Company 2 Intragastric Balloons Market Net Sales Share, By Geography, 2018 (%)
Figure 139: Company 3 Intragastric Balloons Market Net Revenue, By Years, 2018-2019* ($)
Figure 140: Company 3 Intragastric Balloons Market Net Revenue Share, By Business segments, 2018 (%)
Figure 141: Company 3 Intragastric Balloons Market Net Sales Share, By Geography, 2018 (%)
Figure 142: Company 4 Intragastric Balloons Market Net Revenue, By Years, 2018-2019* ($)
Figure 143: Company 4 Intragastric Balloons Market Net Revenue Share, By Business segments, 2018 (%)
Figure 144: Company 4 Intragastric Balloons Market Net Sales Share, By Geography, 2018 (%)
Figure 145: Company 5 Intragastric Balloons Market Net Revenue, By Years, 2018-2019* ($)
Figure 146: Company 5 Intragastric Balloons Market Net Revenue Share, By Business segments, 2018 (%)
Figure 147: Company 5 Intragastric Balloons Market Net Sales Share, By Geography, 2018 (%)
Figure 148: Company 6 Intragastric Balloons Market Net Revenue, By Years, 2018-2019* ($)
Figure 149: Company 6 Intragastric Balloons Market Net Revenue Share, By Business segments, 2018 (%)
Figure 150: Company 6 Intragastric Balloons Market Net Sales Share, By Geography, 2018 (%)
Figure 151: Company 7 Intragastric Balloons Market Net Revenue, By Years, 2018-2019* ($)
Figure 152: Company 7 Intragastric Balloons Market Net Revenue Share, By Business segments, 2018 (%)
Figure 153: Company 7 Intragastric Balloons Market Net Sales Share, By Geography, 2018 (%)
Figure 154: Company 8 Intragastric Balloons Market Net Revenue, By Years, 2018-2019* ($)
Figure 155: Company 8 Intragastric Balloons Market Net Revenue Share, By Business segments, 2018 (%)
Figure 156: Company 8 Intragastric Balloons Market Net Sales Share, By Geography, 2018 (%)
Figure 157: Company 9 Intragastric Balloons Market Net Revenue, By Years, 2018-2019* ($)
Figure 158: Company 9 Intragastric Balloons Market Net Revenue Share, By Business segments, 2018 (%)
Figure 159: Company 9 Intragastric Balloons Market Net Sales Share, By Geography, 2018 (%)
Figure 160: Company 10 Intragastric Balloons Market Net Revenue, By Years, 2018-2019* ($)
Figure 161: Company 10 Intragastric Balloons Market Net Revenue Share, By Business segments, 2018 (%)
Figure 162: Company 10 Intragastric Balloons Market Net Sales Share, By Geography, 2018 (%)
Figure 163: Company 11 Intragastric Balloons Market Net Revenue, By Years, 2018-2019* ($)
Figure 164: Company 11 Intragastric Balloons Market Net Revenue Share, By Business segments, 2018 (%)
Figure 165: Company 11 Intragastric Balloons Market Net Sales Share, By Geography, 2018 (%)
Figure 166: Company 12 Intragastric Balloons Market Net Revenue, By Years, 2018-2019* ($)
Figure 167: Company 12 Intragastric Balloons Market Net Revenue Share, By Business segments, 2018 (%)
Figure 168: Company 12 Intragastric Balloons Market Net Sales Share, By Geography, 2018 (%)
Figure 169: Company 13 Intragastric Balloons Market Net Revenue, By Years, 2018-2019* ($)
Figure 170: Company 13 Intragastric Balloons Market Net Revenue Share, By Business segments, 2018 (%)
Figure 171: Company 13 Intragastric Balloons Market Net Sales Share, By Geography, 2018 (%)
Figure 172: Company 14 Intragastric Balloons Market Net Revenue, By Years, 2018-2019* ($)
Figure 173: Company 14 Intragastric Balloons Market Net Revenue Share, By Business segments, 2018 (%)
Figure 174: Company 14 Intragastric Balloons Market Net Sales Share, By Geography, 2018 (%)
Figure 175: Company 15 Intragastric Balloons Market Net Revenue, By Years, 2018-2019* ($)
Figure 176: Company 15 Intragastric Balloons Market Net Revenue Share, By Business segments, 2018 (%)
Figure 177: Company 15 Intragastric Balloons Market Net Sales Share, By Geography, 2018 (%)