 Email
Email Print
Print


Millet and Sorghum Ancient Grains Market - Forecast(2024 - 2030)
Millet and Sorghum Ancient Grains Market Overview
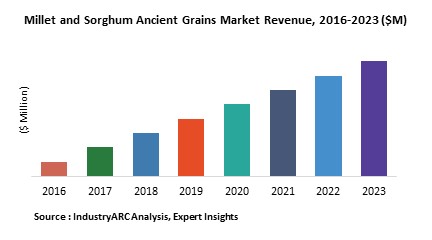
The global Millet Ancient Grains market is estimated to surpass $9.3 billion by 2022, declining at a CAGR of 1.8% during the forecast period. The global sorghum market, on the other hand, is poised to witness significant growth owing to the change in lifestyles of consumers coupled with the rise in demand for healthy and nutritious food. The RoW region evolved as the largest market for millet and sorghum ancient grains as the market is more prevalent in the African region.
Millet and Sorghum Ancient Grains Market Outlook
Ancient grains are defined as grains that have largely remained unchanged over several hundred years. Millet is one of the earliest cultivated crops and is a staple crop in Africa, China, and India. Millet is high in magnesium. Whole cooked millet can be served as a side dish or added to soups. When popped, it can be eaten as a snack. Millet flour can be used in baking. Sorghum is a staple crop in Asia and West Africa and is grown in many countries including the U.S., India, and Nigeria. It is the world’s fifth most important cereal crop. Nutritionally, Sorghum is high in fiber, protein, and b-complex vitamins.
Increasing innovations in value-added products prepared from sorghum and millet is one of the key factors that is driving the millet and sorghum ancient grains market. The growing demand for gluten-free products in emerging countries such as china, India, and others is propelling the global millet and sorghum ancient grains market. Rise in developments and applications of ancient grains in brewing and starch industries are expected to create opportunities for the global millet and sorghum ancient grains market during the forecast period.
This report provides an in-depth analysis of the millet and sorghum ancient grains market by ancient grain type, application, and geography.
The millet ancient grains market in RoW was valued at $4.78 billion in 2017 and is estimated to reach $3.88 billion by 2022, declining at a CAGR of 4.1% during the forecast period. In some countries of the Middle East region, millet is sown as a catch crop when sowing conditions for the main crop are unfavorable. However, even in such situations, millet is sometimes left unharvested and the area simply grazed by livestock. The sorghum ancient grains market in RoW, on the other hand, was valued at $9.24 billion in 2017 and is projected to reach $9.94 billion by 2022, growing at a CAGR of 1.5% during the forecast period.
Millet and Sorghum Ancient Grains Market Growth Drivers
The demand for ancient grains is gaining traction owing to their health benefits and richness in proteins. Rapid urbanization and increase in health consciousness among consumers are expected to surge the demand for millet and sorghum flour during the forecast period. Ancient grains such as millet and sorghum are safe to eat for those who are suffering from Celiac disease and other chronic diseases. Low cost requirements for the farming of millets and sorghum are also set to drive the market. The demand for dry land crop residues such as millets and sorghum is increasing the market value globally.
Millet and Sorghum Ancient Grains Market Challenges
- Global climatic changes and land degradation problems are hindering the growth of the market
- Poor outreach in terms of sorghum and millet among customers
- High transportation costs and large variability of tradable volumes
- Non-availability of ready to use or easy to cook foods from millets in the market
Millet and Sorghum Ancient Grains Market Research Scope
The base year of the study is 2017, with forecast done up to 2023. The study presents a thorough analysis of the competitive landscape, taking into account the market shares of the leading companies. It also provides information on unit shipments. These provide the key market participants with the necessary business intelligence and help them understand the future of the grains in millet and sorghum ancient grains market. The assessment includes the forecast, an overview of the competitive structure, the market shares of the competitors, as well as the market trends, market demands, market drivers, market challenges, and product analysis. The market drivers and restraints have been assessed to fathom their impact over the forecast period. This report further identifies the key opportunities for growth while also detailing the key challenges and possible threats. The key areas of focus include the types of millet and sorghum ancient grains, and their specific applications in different industries.
Millet and Sorghum Ancient Grains Market Report: Industry Coverage
Ancient Grain Type of Millet and Sorghum Ancient Grains: Millet and sorghum
Applications of Millet and Sorghum Ancient Grains: Bakery & confectionary, sports nutrition, infant formula, cereals, animal feed, and others
Millet and Sorghum Ancient Grains market report also analyzes the major geographic regions for the market as well as the major countries for the market in these regions. The regions and countries covered in the study include:
- Americas: The U.S., Canada, Mexico, Brazil, Venezuela, Argentina, and Rest of Americas
- Europe: The U.K., Germany, Italy, France, Spain, Russia, Ukraine and Rest of Europe
- APAC: China, Australia, South Korea, India and Rest of APAC
- Rest of the World: The Middle East and Africa
Millet and Sorghum Ancient Grains Market Key Players Perspective
Some of the key players mentioned in this report are Cargill Inc., Bunge Limited, CHS Inc., Archer Daniels Midland Company, and Louis Dreyfus Company.
Millet and Sorghum Ancient Grains Market Trends
- Rising promotion of sorghum and millets usage in the biofuel sector provides significant opportunities for the growth of the millet and sorghum ancient grains market.
- Innovative value added products prepared from sorghum and millet grains are set to provide new opportunities for food product manufacturers.
- Growing developments and applications of sorghum and millet in beer brewing and starch preparations to provide opportunities in coming future.
- Increasing demand for niche gluten free products is providing opportunities for millet and sorghum providers.
1. Millet and Sorghum Ancient Grains Market - Overview
1.1. Definitions and Scope
2. Millet and Sorghum Ancient Grains Market - Executive summary
2.1. Market Revenue, Market Size and Key Trends by Company
2.2. Key Trends by type of Application
2.3. Key Trends segmented by Geography
3. Millet and Sorghum Ancient Grains Market
3.1. Comparative analysis
3.1.1. Product Benchmarking - Top 10 companies
3.1.2. Top 5 Financials Analysis
3.1.3. Market Value split by Top 10 companies
3.1.4. Patent Analysis - Top 10 companies
3.1.5. Pricing Analysis
4. Millet and Sorghum Ancient Grains Market – Startup companies Scenario Premium
4.1. Top 10 startup company Analysis by
4.1.1. Investment
4.1.2. Revenue
4.1.3. Market Shares
4.1.4. Market Size and Application Analysis
4.1.5. Venture Capital and Funding Scenario
5. Millet and Sorghum Ancient Grains Market – Industry Market Entry Scenario Premium
5.1. Regulatory Framework Overview
5.2. New Business and Ease of Doing business index
5.3. Case studies of successful ventures
5.4. Customer Analysis – Top 10 companies
6. Millet and Sorghum Ancient Grains Market Forces
6.1. Drivers
6.2. Constraints
6.3. Challenges
6.4. Porters five force model
6.4.1. Bargaining power of suppliers
6.4.2. Bargaining powers of customers
6.4.3. Threat of new entrants
6.4.4. Rivalry among existing players
6.4.5. Threat of substitutes
7. Millet and Sorghum Ancient Grains Market -Strategic analysis
7.1. Value chain analysis
7.2. Opportunities analysis
7.3. Product life cycle
7.4. Suppliers and distributors Market Share
8. Millet and Sorghum Ancient Grains Market – By Ancient Grain Type (Market Size -$Million / $Billion)
8.1. Market Size and Market Share Analysis
8.2. Application Revenue and Trend Research
8.3. Product Segment Analysis
8.3.1. Millet
8.3.2. Sorghum
9. Millet and Sorghum Ancient Grains Market – By Application (Market Size -$Million / $Billion)
9.1. Bakery & Confectionary
9.2. Sports Nutrition
9.3. Infant Formula
9.4. Cereals
9.5. Animal Feed
9.6. Others
10. Millet and Sorghum Ancient Grains - By Geography (Market Size -$Million / $Billion)
10.1. Millet and Sorghum Ancient Grains Market - North America Segment Research
10.2. North America Market Research (Million / $Billion)
10.2.1. Segment type Size and Market Size Analysis
10.2.2. Revenue and Trends
10.2.3. Application Revenue and Trends by type of Application
10.2.4. Company Revenue and Product Analysis
10.2.5. North America Product type and Application Market Size
10.2.5.1. U.S.
10.2.5.2. Canada
10.2.5.3. Mexico
10.2.5.4. Rest of North America
10.3. Millet and Sorghum Ancient Grains - South America Segment Research
10.4. South America Market Research (Market Size -$Million / $Billion)
10.4.1. Segment type Size and Market Size Analysis
10.4.2. Revenue and Trends
10.4.3. Application Revenue and Trends by type of Application
10.4.4. Company Revenue and Product Analysis
10.4.5. South America Product type and Application Market Size
10.4.5.1. Brazil
10.4.5.2. Venezuela
10.4.5.3. Argentina
10.4.5.4. Ecuador
10.4.5.5. Peru
10.4.5.6. Colombia
10.4.5.7. Costa Rica
10.4.5.8. Rest of South America
10.5. Millet and Sorghum Ancient Grains - Europe Segment Research
10.6. Europe Market Research (Market Size -$Million / $Billion)
10.6.1. Segment type Size and Market Size Analysis
10.6.2. Revenue and Trends
10.6.3. Application Revenue and Trends by type of Application
10.6.4. Company Revenue and Product Analysis
10.6.5. Europe Segment Product type and Application Market Size
10.6.5.1. U.K
10.6.5.2. Germany
10.6.5.3. Italy
10.6.5.4. France
10.6.5.5. Netherlands
10.6.5.6. Belgium
10.6.5.7. Spain
10.6.5.8. Denmark
10.6.5.9. Rest of Europe
10.7. Millet and Sorghum Ancient Grains – APAC Segment Research
10.8. APAC Market Research (Market Size -$Million / $Billion)
10.8.1. Segment type Size and Market Size Analysis
10.8.2. Revenue and Trends
10.8.3. Application Revenue and Trends by type of Application
10.8.4. Company Revenue and Product Analysis
10.8.5. APAC Segment – Product type and Application Market Size
10.8.5.1. China
10.8.5.2. Australia
10.8.5.3. Japan
10.8.5.4. South Korea
10.8.5.5. India
10.8.5.6. Taiwan
10.8.5.7. Malaysia
11. Millet and Sorghum Ancient Grains Market - Entropy
11.1. New product launches
11.2. M&A's, collaborations, JVs and partnerships
12. Millet and Sorghum Ancient Grains Market – Industry / Segment Competition landscape Premium
12.1. Market Share Analysis
12.1.1. Market Share by Country- Top companies
12.1.2. Market Share by Region- Top 10 companies
12.1.3. Market Share by type of Application – Top 10 companies
12.1.4. Market Share by type of Product / Product category- Top 10 companies
12.1.5. Market Share at global level- Top 10 companies
12.1.6. Best Practises for companies
13. Millet and Sorghum Ancient Grains Market – Key Company List by Country Premium
14. Millet and Sorghum Ancient Grains Market Company Analysis
14.1. Market Share, Company Revenue, Products, M&A, Developments
14.2. Cargill Inc.
14.3. Bunge Limited
14.4. CHS Inc.
14.5. Archer Daniels Midland Company
14.6. Louis Dreyfus Company
14.7. Company 6
14.8. Company 7
14.9. Company 8
14.10. Company 9
14.11. Company 10 and more
"*Financials would be provided on a best efforts basis for private companies"
15. Millet and Sorghum Ancient Grains Market -Appendix
15.1. Abbreviations
15.2. Sources
16. Millet and Sorghum Ancient Grains Market -Methodology Premium
16.1. Research Methodology
16.1.1. Company Expert Interviews
16.1.2. Industry Databases
16.1.3. Associations
16.1.4. Company News
16.1.5. Company Annual Reports
16.1.6. Application Trends
16.1.7. New Products and Product database
16.1.8. Company Transcripts
16.1.9. R&D Trends
16.1.10. Key Opinion Leaders Interviews
16.1.11. Supply and Demand Trends
List of Tables:
Table 1: Sorghum Harvested Area, By Country, 2014 (ha)
Table 2: Millet Area Harvested Area, By Country, 2014 (ha)
Table 3: Margin for Stakeholders of Millet and Sorghum Ancient Grains Market (%)
Table 4: Sorghum: Ancient Grains Market Revenue, By Application, 2016-2022 ($Million)
Table 5: Sorghum: Ancient Grains Market Volume, By Application, 2016-2022 (000' Metric Tons)
Table 6: Millet: Ancient Grains Market Revenue, By Application, 2016-2022 ($Million)
Table 7: Millet: Ancient Grains Market Volume, By Application, 2016-2022 (000' Metric Tons)
Table 8: Sorghum: Ancient Grains Market Revenue, By Geography, 2016-2022 ($Million)
Table 9: Sorghum: Ancient Grains Market Volume, By Geography, 2016-2022 (000' Metric Tons)
Table 10: Millet: Ancient Grains Market Revenue, By Geography, 2016-2022 ($Million)
Table 11: Millet: Ancient Grains Market Volume, By Geography, 2016-2022 (000' Metric Tons)
Table 12: Sorghum: Americas Ancient Grains Market Revenue, By Country, 2016-2022 ($Million)
Table 13: Sorghum: Americas Ancient Grains Market Volume, By Country, 2016-2022 (000' Metric Tons)
Table 14: Millet: Americas Ancient Grains Market Revenue, By Country, 2016-2022 ($Million)
Table 15: Millet: Americas Ancient Grains Market Volume, By Country, 2016-2022 (000' Metric Tons)
Table 16: U.S.: GDP – Composition of 2015, By End Use
Table 17: Mexico: GDP – Composition of 2015, By End Use
Table 18: Sorghum: U.S. Ancient Grains Market Revenue, By Application, 2016-2022 ($Million)
Table 19: Sorghum: U.S. Ancient Grains Market Volume, By Application, 2016-2022 (000' Metric Tons)
Table 20: Millet: U.S. Ancient Grains Market Revenue, By Application, 2016-2022 ($Million)
Table 21: Millet: U.S. Ancient Grains Market Volume, By Application, 2016-2022 (000' Metric Tons)
Table 22: Sorghum: Mexico Ancient Grains Market Revenue, By Application, 2016-2022 ($Million)
Table 23: Sorghum: Mexico Ancient Grains Market Volume, By Application, 2016-2022 (000' Metric Tons)
Table 24: Millet: Mexico Ancient Grains Market Revenue, By Application, 2016-2022 ($Million)
Table 25: Millet: Mexico Ancient Grains Market Volume, By Application, 2016-2022 (000' Metric Tons)
Table 26: Sorghum: South America Ancient Grains Market Revenue, By Application, 2016-2022 ($Million)
Table 27: Sorghum: South America Ancient Grains Market Volume, By Application, 2016-2022 (000' Metric Tons)
Table 28: Millet: South America Ancient Grains Market Revenue, By Application, 2016-2022 ($Million)
Table 29: Millet: South America Ancient Grains Market Volume, By Application, 2016-2022 (000' Metric Tons)
Table 30: Millet: Canada Ancient Grains Market Revenue, By Application, 2016-2022 ($Million)
Table 31: Millet: Canada Ancient Grains Market Volume, By Application, 2016-2022 (000' Metric Tons)
Table 32: Sorghum: Europe Ancient Grains Market Revenue, By Country, 2016-2022 ($Million)
Table 33: Sorghum: Europe Ancient Grains Market Volume, By Country, 2016-2022 (000' Metric Tons)
Table 34: Millet: Europe Ancient Grains Market Revenue, By Country, 2016-2022 ($Million)
Table 35: Millet: Europe Ancient Grains Market Volume, By Country, 2016-2022 (000' Metric Tons)
Table 36: U.K.: GDP – Composition of 2015, By End Use
Table 37: Germany: GDP – Composition of 2015, By End Use
Table 38: Italy: GDP – Composition of 2015, By End Use
Table 39: Spain: GDP – Composition of 2015, By End Use
Table 40: France: GDP – Composition of 2015, By End Use
Table 41: GDP – Composition of 2015, By End Use
Table 42: Sorghum: U.K. Ancient Grains Market Revenue, By Application, 2016-2022 (000' $)
Table 43: Sorghum: U.K. Ancient Grains Market Volume, By Application, 2016-2022 (Metric Tons)
Table 44: Sorghum: Germany Ancient Grains Market Revenue, By Application, 2016-2022 (000' $)
Table 45: Sorghum: Germany Ancient Grains Market Volume, By Application, 2016-2022 (Metric Tons)
Table 46: Sorghum: Spain Ancient Grains Market Revenue, By Application, 2016-2022 ($Million)
Table 47: Sorghum: Spain Ancient Grains Market Volume, By Application, 2016-2022 (Metric Tons)
Table 48: Sorghum: Italy Ancient Grains Market Revenue, By Application, 2016-2022 ($Million)
Table 49: Sorghum: Italy Ancient Grains Market Volume, By Application, 2016-2022 (000' Metric Tons)
Table 50: Sorghum: France Ancient Grains Market Revenue, By Application, 2016-2022 (000' $)
Table 51: Sorghum: France Ancient Grains Market Volume, By Application, 2016-2022 (000' Metric Tons)
Table 52: Sorghum: Rest of Europe Ancient Grains Market Revenue, By Application, 2016-2022 (000' $)
Table 53: Sorghum: Rest of Europe Ancient Grains Market Volume, By Application, 2016-2022 (000' Metric Tons)
Table 54: Millet: Russia Ancient Grains Market Revenue, By Application, 2016-2022 ($Million)
Table 55: Millet: Russia Ancient Grains Market Volume, By Application, 2016-2022 (000' Metric Tons)
Table 56: Millet: Ukraine Ancient Grains Market Revenue, By Application, 2016-2022 ($Million)
Table 57: Millet: Ukraine Ancient Grains Market Volume, By Application, 2016-2022 (000' Metric Tons)
Table 58: Sorghum: Asia-Pacific Ancient Grains Market Revenue, By Country, 2016-2022 ($Million)
Table 59: Sorghum: Asia-Pacific Ancient Grains Market Volume, By Country, 2016-2022 (000' Metric Tons)
Table 60: Millet: Asia-Pacific Ancient Grains Market Revenue, By Country, 2016-2022 ($Million)
Table 61: Millet: Asia-Pacific Ancient Grains Market Volume, By Country, 2016-2022 (000' Metric Tons)
Table 62: China: GDP – Composition of 2015, By End Use
Table 63: Japan: GDP – Composition of 2015, By End Use
Table 64: India: GDP – Composition of 2015, By End Use
Table 65: South Korea: GDP – Composition of 2015, By End Use
Table 66: Australia: GDP – Composition of 2015, By End Use
Table 67: Sorghum: China Ancient Grains Market Revenue, By Application, 2016-2022 ($Million)
Table 68: Sorghum: China Ancient Grains Market Volume, By Application, 2016-2022 (000' Metric Tons)
Table 69: Millet: China Ancient Grains Market Revenue, By Application, 2016-2022 ($Million)
Table 70: Millet: China Ancient Grains Market Volume, By Application, 2016-2022 (000' Metric Tons)
Table 71: Sorghum: India Ancient Grains Market Revenue, By Application, 2016-2022 ($Million)
Table 72: Sorghum: India Ancient Grains Market Volume, By Application, 2016-2022 (000' Metric Tons)
Table 73: Millet: India Ancient Grains Market Revenue, By Application, 2016-2022 ($Million)
Table 74: Millet: India Ancient Grains Market Volume, By Application, 2016-2022 (000' Metric Tons)
Table 75: Sorghum: Japan Ancient Grains Market Revenue, By Application, 2016-2022 ($Million)
Table 76: Sorghum: Japan Ancient Grains Market Volume, By Application, 2016-2022 (000' Metric Tons)
Table 77: Sorghum: Australia & New Zealand Ancient Grains Market Revenue, By Application, 2016-2022 ($Million)
Table 78: Sorghum: Australia & New Zealand Ancient Grains Market Volume, By Application, 2016-2022 (000' Metric Tons)
Table 79: Millet: Australia Ancient Grains Market Revenue, By Application, 2016-2022 ($Million)
Table 80: Millet: Australia Ancient Grains Market Volume, By Application, 2016-2022 (000' Metric Tons)
Table 81: Sorghum: South Korea Ancient Grains Market Revenue, By Application, 2016-2022 ($Million)
Table 82: Sorghum: South Korea Ancient Grains Market Volume, By Application, 2016-2022 (000' Metric Tons)
Table 83: Millet: South Korea Ancient Grains Market Revenue, By Application, 2016-2022 (000' $)
Table 84: Millet: South Korea Ancient Grains Market Volume, By Application, 2016-2022 (Metric Tons)
Table 85: Sorghum: Rest of APAC Ancient Grains Market Revenue, By Application, 2016-2022 ($Million)
Table 86: Sorghum: Rest of APAC Ancient Grains Market Volume, By Application, 2016-2022 (000' Metric Tons)
Table 87: Millet: Rest of APAC Ancient Grains Market Revenue, By Application, 2016-2022 ($Million)
Table 88: Millet: Rest of APAC Ancient Grains Market Volume, By Application, 2016-2022 (000' Metric Tons)
Table 89: Sorghum: RoW Ancient Grains Market Revenue, By Region, 2016-2022 ($Million)
Table 90: Sorghum: RoW Ancient Grains Market Volume, By Region, 2016-2022 (000' Metric Tons)
Table 91: Millet: RoW Ancient Grains Market Revenue, By Region, 2016-2022 ($Million)
Table 92: Millet: RoW Ancient Grains Market Volume, By Region, 2016-2022 (000' Metric Tons)
Table 93: Sorghum: Middle East Ancient Grains Market Revenue, By Application, 2016-2022 ($Million)
Table 94: Sorghum: Middle East Ancient Grains Market Volume, By Application, 2016-2022 (000' Metric Tons)
Table 95: Millet: Middle East Ancient Grains Market Revenue, By Application, 2016-2022 ($Million)
Table 96: Millet: Middle East Ancient Grains Market Volume, By Application, 2016-2022 (000' Metric Tons)
Table 97: Sorghum: Africa Ancient Grains Market Revenue, By Application, 2016-2022 ($Million)
Table 98: Sorghum: Africa Ancient Grains Market Volume, By Application, 2016-2022 (000' Metric Tons)
Table 99: Millet: Africa Ancient Grains Market Revenue, By Application, 2016-2022 ($Million)
Table 100: Millet: Africa Ancient Grains Market Volume, By Application, 2016-2022 (000' Metric Tons)
List of Figures:
Figure 1: Global Sorghum & Millet Ancient Grains Market Revenue, 2016-2022 ($Million)
Figure 2: Global Sorghum & Millet Ancient Grains Market Volume, 2016-2022 (000' Metric Tons)
Figure 3: Global Sorghum Ancient Grains Market Revenue, By Application, 2016-2022 ($Million)
Figure 4: Global Millet Ancient Grains Market Revenue, By Application, 2016-2022 ($Million)
Figure 5: Global Sorghum Ancient Grains Market Revenue Share, By Geography, 2016 (%)
Figure 6: Global Millet Ancient Grains Market Revenue Share, By Geography, 2016 (%)
Figure 7: Millet and Sorghum Ancient Grains Market Revenue Share, By Company, 2016 (%)
Figure 8: Archer Daniels Midland Company
Figure 9: Cargill Inc.
Figure 10: Louis Dreyfus Company
Figure 11: CHS Inc.
Figure 12: Bunge Limited
Figure 13: Earnings Per Share ($), By Company
Figure 14: Sorghum Pricing, By Geography, 2016-2022 ($/Ton)
Figure 15: Millet Pricing, By Geography, 2016-2022 ($/Ton)
Figure 16: Sorghum Retail Average Selling Price, By Geography, 2016 ($/Kg)
Figure 17: Millet Retail Average Selling Price, By Geography, 2016 ($/Kg)
Figure 18: Millet and Sorghum Ancient Grains Market Revenue, 2016,2022 ($Million)
Figure 19: Millet: Ancient Grains Market Revenue, 2016-2022 ($Million)
Figure 20: Millet: Ancient Grains Market Volume, 2016-2022 (000' Metric Tons)
Figure 21: Sorghum: Ancient Grains Market Revenue, 2016-2022 ($Million)
Figure 22: Sorghum: Ancient Grains Market Volume, 2016-2022 (000' Metric Tons)
Figure 23: Bakery & Confectionery: Sorghum Ancient Grains Market Revenue, 2016-2022 ($Million)
Figure 24: Bakery & Confectionery: Sorghum Ancient Grains Market Volume, 2016-2022 (000' Metric Tons)
Figure 25: Bakery & Confectionery: Millet Ancient Grains Market Revenue, 2016-2022 ($Million)
Figure 26: Bakery & Confectionery: Millet Ancient Grains Market Volume, 2016-2022 (000' Metric Tons)
Figure 27: Sports Nutrition: Sorghum Ancient Grains Market Revenue, 2016-2022 ($Million)
Figure 28: Sports Nutrition: Sorghum Ancient Grains Market Volume, 2016-2022 (000' Metric Tons)
Figure 29: Sports Nutrition: Millet Ancient Grains Market Revenue, 2016-2022 ($Million)
Figure 30: Sports Nutrition: Millet Ancient Grains Market Volume, 2016-2022 (000' Metric Tons)
Figure 31: Infant Formula: Sorghum Ancient Grains Market Revenue, 2016-2022 ($Million)
Figure 32: Infant Formula: Sorghum Ancient Grains Market Volume, 2016-2022 (000' Metric Tons)
Figure 33: Infant Formula: Millet Ancient Grains Market Revenue, 2016-2022 ($Million)
Figure 34: Infant Formula: Millet Ancient Grains Market Volume, 2016-2022 (000' Metric Tons)
Figure 35: Cereals: Sorghum Ancient Grains Market Revenue, 2016-2022 ($Million)
Figure 36: Cereals: Sorghum Ancient Grains Market Volume, 2016-2022 (000' Metric Tons)
Figure 37: Cereals: Millet Ancient Grains Market Revenue, 2016-2022 ($Million)
Figure 38: Cereals: Millet Ancient Grains Market Volume, 2016-2022 (000' Metric Tons)
Figure 39: Animal Feed: Sorghum Ancient Grains Market Revenue, 2016-2022 ($Million)
Figure 40: Animal Feed: Sorghum Ancient Grains Market Volume, 2016-2022 (000' Metric Tons)
Figure 41: Animal Feed: Millet Ancient Grains Market Revenue, 2016-2022 ($Million)
Figure 42: Animal Feed: Millet Ancient Grains Market Volume, 2016-2022 (000' Metric Tons)
Figure 43: Others: Sorghum Ancient Grains Market Revenue, 2016-2022 ($Million)
Figure 44: Others: Sorghum Ancient Grains Market Volume, 2016-2022 (000' Metric Tons)
Figure 45: Others: Millet Ancient Grains Market Revenue, 2016-2022 ($Million)
Figure 46: Others: Millet Ancient Grains Market Volume, 2016-2022 (000' Metric Tons)
Figure 47: U.S.: GDP and Population, 2012-2015 ($Trillion, Million)
Figure 48: U.S.: GDP – Composition of 2015, By Sector of Origin
Figure 49: U.S.: Export and Import Value, 2012-2015 ($Trillion)
Figure 50: Mexico: GDP and Population, 2012-2015 ($Trillion, Million)
Figure 51: Mexico: GDP – Composition of 2015, By Sector of Origin
Figure 52: Mexico: Export and Import Value, 2012-2015 ($Billion)
Figure 53: Sorghum: U.S. Ancient Grains Market Value, 2016-2022 ($Million)
Figure 54: Sorghum: Mexico Ancient Grains Market Value, 2016-2022 ($Million)
Figure 55: Sorghum: South America Ancient Grains Market Value, 2016-2022 ($Million)
Figure 56: Sorghum: U.S. Ancient Grains Market Volume, 2016-2022 (000' Metric Tons)
Figure 57: Sorghum: Mexico Ancient Grains Market Volume, 2016-2022 (000' Metric Tons)
Figure 58: Sorghum: South America Ancient Grains Market Volume, 2016-2022 (000' Metric Tons)
Figure 59: Millet: U.S. Ancient Grains Market Value, 2016-2022 ($Million)
Figure 60: Millet: Mexico Ancient Grains Market Value, 2016-2022 ($Million)
Figure 61: Millet: Canada Ancient Grains Market Value, 2016-2022 ($Million)
Figure 62: Millet: South America Ancient Grains Market Value, 2016-2022 ($Million)
Figure 63: Millet: U.S. Ancient Grains Market Volume, 2016-2022 (000' Metric Tons)
Figure 64: Millet: Mexico Ancient Grains Market Volume, 2016-2022 (000' Metric Tons)
Figure 65: Millet: Canada Ancient Grains Market Volume, 2016-2022 (000' Metric Tons)
Figure 66: Millet: South America Ancient Grains Market Volume, 2016-2022 (000' Metric Tons)
Figure 67: U.K.: GDP and Population, 2012-2015 ($Trillion, Million)
Figure 68: U.K.: GDP – Composition of 2015, By Sector of Origin
Figure 69: U.K.: Export and Import Value, 2012-2015 ($Billion)
Figure 70: Germany: GDP and Population, 2012-2015 ($Trillion, Million)
Figure 71: Germany: GDP – Composition of 2015, By Sector of Origin
Figure 72: Germany: Export and Import Value, 2012-2015 ($Billion)
Figure 73: Italy: GDP and Population, 2012-2015 ($Trillion, Million)
Figure 74: Italy: GDP – Composition of 2015, By Sector of Origin
Figure 75: Italy: Export and Import Value, 2012-2015 ($Billion)
Figure 76: Spain: GDP and Population, 2012-2015 ($Trillion, Million)
Figure 77: Spain: GDP – Composition of 2015, By Sector of Origin
Figure 78: Spain: Export and Import Value, 2012-2015 ($Billion)
Figure 79: France: GDP and Population, 2012-2015 ($Trillion, Million)
Figure 80: France: GDP – Composition of 2015, By Sector of Origin
Figure 81: France: Export and Import Value, 2012-2015 ($Billion)
Figure 82: GDP, 2011-2015 ($Trillion)
Figure 83: GDP – Composition of 2015, By Sector of Origin
Figure 84: Export and Import Value, 2012-2015 (%)
Figure 85: Sorghum: U.K. Ancient Grains Market Value, 2016-2022 ($Million)
Figure 86: Sorghum: Germany Ancient Grains Market Value, 2016-2022 ($Million)
Figure 87: Sorghum: Italy Ancient Grains Market Value, 2016-2022 ($Million)
Figure 88: Sorghum: France Ancient Grains Market Value, 2016-2022 ($Million)
Figure 89: Sorghum: Spain Ancient Grains Market Value, 2016-2022 ($Million)
Figure 90: Sorghum: Rest of Europe Ancient Grains Market Value, 2016-2022 ($Million)
Figure 91: Sorghum: U.K. Ancient Grains Market Volume, 2016-2022 (000' Metric Tons)
Figure 92: Sorghum: Germany Ancient Grains Market Volume, 2016-2022 (000' Metric Tons)
Figure 93: Sorghum: Italy Ancient Grains Market Volume, 2016-2022 (000' Metric Tons)
Figure 94: Sorghum: France Ancient Grains Market Volume, 2016-2022 (000' Metric Tons)
Figure 95: Sorghum: Spain Ancient Grains Market Volume, 2016-2022 (000' Metric Tons)
Figure 96: Sorghum: Rest of Europe Ancient Grains Market Volume, 2016-2022 (000' Metric Tons)
Figure 97: Millet: Russia Ancient Grains Market Value, 2016-2022 ($Million)
Figure 98: Millet: Ukraine Ancient Grains Market Value, 2016-2022 ($Million)
Figure 99: Millet: Russia Ancient Grains Market Volume, 2016-2022 (000' Metric Tons)
Figure 100: Millet: Ukraine Ancient Grains Market Volume, 2016-2022 (000' Metric Tons)
Figure 101: China: GDP and Population, 2012-2015 ($Trillion, Million)
Figure 102: China: GDP – Composition of 2015, By Sector of Origin
Figure 103: China: Export and Import Value, 2012-2015 ($Billion)
Figure 104: Japan: GDP and Population, 2012-2015 ($Trillion, Million)
Figure 105: Japan: GDP – Composition of 2015, By Sector of Origin
Figure 106: Japan: Export and Import Value, 2012-2015 ($Billion)
Figure 107: India: GDP and Population, 2012-2015 ($Trillion, Million)
Figure 108: India: GDP – Composition of 2015, By Sector of Origin
Figure 109: India: Export and Import Value, 2012-2015 ($Billion)
Figure 110: South Korea: GDP and Population, 2012-2015 ($Trillion, Million)
Figure 111: South Korea: GDP – Composition of 2015, By Sector of Origin
Figure 112: South Korea: Export and Import Value, 2012-2015 ($Billion)
Figure 113: Australia: GDP and Population, 2012-2015 ($Trillion, Million)
Figure 114: Australia: GDP – Composition of 2015, By Sector of Origin
Figure 115: Australia: Export and Import Value, 2012-2015 ($Billion)
Figure 116: Sorghum: China Ancient Grains Market Value, 2016-2022 ($Million)
Figure 117: Sorghum: Japan Ancient Grains Market Value, 2016-2022 ($Million)
Figure 118: Sorghum: India Ancient Grains Market Value, 2016-2022 ($Million)
Figure 119: Sorghum: Australia and New Zealand Ancient Grains Market Value, 2016-2022 ($Million)
Figure 120: Sorghum: South Korea Ancient Grains Market Value, 2016-2022 ($Million)
Figure 121: Sorghum: Rest of Asia-Pacific Ancient Grains Market Value, 2016-2022 ($Million)
Figure 122: Sorghum: China Ancient Grains Market Volume, 2016-2022 (000' Metric Tons)
Figure 123: Sorghum: Japan Ancient Grains Market Volume, 2016-2022 (000' Metric Tons)
Figure 124: Sorghum: India Ancient Grains Market Volume, 2016-2022 (000' Metric Tons)
Figure 125: Sorghum: Australia and New Zealand Ancient Grains Market Volume, 2016-2022 (000' Metric Tons)
Figure 126: Sorghum: South Korea Ancient Grains Market Volume, 2016-2022 (000' Metric Tons)
Figure 127: Sorghum: Rest of Asia-Pacific Ancient Grains Market Volume, 2016-2022 (000' Metric Tons)
Figure 128: Millet: China Ancient Grains Market Value, 2016-2022 ($Million)
Figure 129: Millet: Australia Ancient Grains Market Value, 2016-2022 ($Million)
Figure 130: Millet: India Ancient Grains Market Value, 2016-2022 ($Million)
Figure 131: Millet: South Korea Ancient Grains Market Value, 2016-2022 ($Million)
Figure 132: Millet: Rest of Asia-Pacific Ancient Grains Market Value, 2016-2022 ($Million)
Figure 133: Millet: China Ancient Grains Market Volume, 2016-2022 (000' Metric Tons)
Figure 134: Millet: Australia Ancient Grains Market Volume, 2016-2022 (000' Metric Tons)
Figure 135: Millet: India Ancient Grains Market Volume, 2016-2022 (000' Metric Tons)
Figure 136: Millet: South Korea Ancient Grains Market Volume, 2016-2022 (000' Metric Tons)
Figure 137: Millet: Rest of Asia-Pacific Ancient Grains Market Volume, 2016-2022 (000' Metric Tons)
Figure 138: Sorghum: Africa Ancient Grains Market Value, 2016-2022 ($Million)
Figure 139: Sorghum: Middle East Ancient Grains Market Value, 2016-2022 ($Million)
Figure 140: Sorghum: Africa Ancient Grains Market Volume, 2016-2022 (000' Metric Tons)
Figure 141: Sorghum: Middle East Ancient Grains Market Volume, 2016-2022 (000' Metric Tons)
Figure 142: Millet: Africa Ancient Grains Market Value, 2016-2022 ($Million)
Figure 143: Millet: Middle East Ancient Grains Market Value, 2016-2022 ($Million)
Figure 144: Millet: Africa Ancient Grains Market Volume, 2016-2022 (000' Metric Tons)
Figure 145: Millet: Middle East Ancient Grains Market Volume, 2016-2022 (000' Metric Tons)
Figure 146: Millet and Sorghum Ancient Grains Market Entropy Share, By Strategies, 2013-2018 (%)
Figure 147: Millet and Sorghum Ancient Grains Market Entropy, By Total Number of Developments, 2013-2018
Figure 148: Archer Daniels Midland Company Net Revenues, 2014-2016 ($ Bn)
Figure 149: Archer Daniels Midland Company Net Sales Share, By Business segments, 2016 (%)
Figure 150: Archer Daniels Midland Company Net Revenue Share, By Geography, 2016 (%)
Figure 151: Aurora Cooperative Net Sales, 2014-2016 ($Million)
Figure 152: Aurora Cooperative Net Sales Share, By Business segments, 2016 (%)
Figure 153: Bunge Limited Net Sales, 2014-2016 ($ Bn)
Figure 154: Bunge Limited Net Sales Share, By Business segments, 2016 (%)
Figure 155: Bunge Limited Net Revenue Share, By Geography, 2016 (%)
Figure 156: Cargill Inc. Net Revenues, 2014-2016 ($Billion)
Figure 157: Cargill Inc. Net Revenue Share, By Geography, 2016 (%)
Figure 158: CHS Inc. Net Revenues, 2014-2016 ($ Bn)
Figure 159: CHS Inc. Net Revenue Share, By Geography, 2016 (%)
Figure 160: Glencore Net Revenues, 2014-2016 ($ Bn)
Figure 161: Glencore Net Revenue Share, By Geography, 2016 (%)
Figure 162: Louis Dreyfus Company Net Sales, 2014-2016 ($ Bn)
Figure 163: Louis Dreyfus Company Net Sales Share, By Business segments, 2016 (%)
Figure 164: Louis Dreyfus Company Net Revenue Share, By Geography, 2016 (%)
Figure 165: Olam International Net Sales, 2014-2016 ($Million)
Figure 166: Olam International Net Sales Share, By Business segments, 2016 (%)
Figure 167: Olam International Net Revenue Share, By Geography, 2016 (%)