 Email
Email Print
Print


Starch derivatives Market Overview:
The Starch derivatives market is an important market from the industrial perspective as additives in various industries for different applications. The global Starch Derivative Market was valuedestimated to be worth around $55 billion in 2017 and is expected to grow at a CAGR of 5.70% during the forecast period of 2018 to 2023. The market is fragmented by few key players that together occupy more than 50% of the market. These companies include Cargill Inc, Archer Daniel Midland (ADM), Ingredion, Abeve UA and Tate & Lyle PC. End user industry wise the food and beverages sector is the largest market for Starch Derivative with a market share of more than 50% and a revenue of $32 billion generated from it in 2017, followed by the pharmaceutical sector with a revenue generated amounting to $9 billion in 2017. In 2017 the Exports of various starch derivatives amounted to a little more $3 billion, with Thailand being the lead exporter, with an export value of $623 million.
Starch derivatives Market Outlook:
Starch is naturally occurring biopolymer that is found in almost all plants that are grown as an energy source for them. Some of the major sources of starch for industrial production are Maize (Corn), wheat, potatoes and tapioca among many others. Raw starch has limitations in its applications due to its easily decaying and retrograding properties and hence required to be modified either physically, chemically or enzymatically to give it much better properties. Due their safety, bio-degradability, low cost and specific technical properties such as thickening, gelling, film forming, fat mimicking and many more, making starch derivatives a lucrative option for the various industries.
Corn holds the largest market share as raw material for starch due to the high content of starch that is found in it, close to 60% followed by wheat having almost 50% starch content. There are many derivative of Starch that are categorized as Esters, Ethers, cross-linked starches, graft copolymerized starches, converted or modified starches which include – Dextrin, Maltodextrins, pre-gelatinized starches and many more.
They find application in the food and beverage industry as additives for binding, thickening, stabilizing, as a powdering agent and lustering agent and also in cake mix. In the Chemical, agricultural, medical and healthcare industry it used as bulking agents, caking agents, as a culture medium, in shampoos and as dehumidification agents. In the Paper and pulp industry as a wet end additive, surface sizer and coatings binder, layer binder, corrugated paper and remoistenable gummed tape. In printing, warp sizing, spray sizing and finishing and in glass fibers in the textile industry. They are also used in Ceramic fibers, acid picking thickeners, cement retardants, dry cell and various more applications.
Starch derivatives Market Growth drivers:
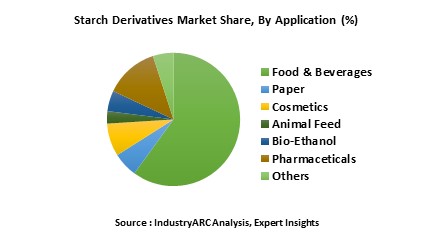
The growing demand for food, due to increasing global population and increase in disposable income levels, and the use of Starch derivatives in the use of Starch derivatives in the food and beverage industries is the most important growth driver for the starch derivatives market. Food and Beverages accounts for 54% of the starch derivatives market, starch derivatives form gelling agents, emulsifiers, thickeners and film forming additives in the food industry. Growing global population and the increase in disposable income held by people is a primary driver that is fueling the food Industry and thus indirectly fuelling the starch derivatives market. Its low production cost, ease of processing, biodegradability, excellent physiochemical properties and high calorific value make it a popular product in the pharmaceutical, paper, textiles and various other sectors.
Starch derivatives Market Challenges:
One of the major challenges faced byor the starch derivatives market is the competition for raw materials availability between various industries. Corn is the major source for the production of starch globally, and is also used in various industries for different applications due to which the availability of corn and its price for the production of starch acts as a major constraint on the market. .
Effects of the climate and other geological and political factors as well have an important impact on the production of thethe raw materials w, such as corn, wheat, tapioca and others, which makes it a volatile factor.
Starch derivatives Market Research Scope:
The base year of the study is 2017, with forecast done up to 2023. The study presents a thorough analysis of the competitive landscape, taking into account the market shares of the leading companies. It also provides information on unit shipments. These provide the key market participants with the necessary business intelligence and help them understand the future of the Starch derivatives Market. The assessment includes the forecast, an overview of the competitive structure, the market shares of the competitors, as well as the market trends, market demands, market drivers, market challenges, and product analysis. The market drivers and restraints have been assessed to fathom their impact over the forecast period. This report further identifies the key opportunities for growth while also detailing the key challenges and possible threats. The key areas of focus include the types of plastics in the electric vehicle market, and their specific applications in different types of vehicles.
Starch derivatives (SAP) Market Report: Industry Coverage
Starch derivatives Market– by Types of Derivatives: Starch Ethers, Cross-linked Starches, Starch Esters, Graft Copolymerized
Starches, Complex Starches, Converted Starches: Dextrin, British gums, Maltodextrins, Oxidized and Thin-boiling starches, Pre-gelatinized Starches, Microbial polysaccharides, Natural Gum Derivatives, and other Modified Starches
Starch derivatives Market– by Raw Material: Wheat, Corn, Potato, Sorghum, Tapioca and others.
Starch derivatives Market – By Method of Application: Binder, Thickener and stabilizer, Cake Mix, Sweetener, Lustering Agent, Powdering agent, Fish Culture Feed, Expanded Feed, Caking agent, Shampoo, Dehumidification Agent, Culture Medium, Wet End additive for Paper, Corrugated Paper, Printing, Glass fiber, Foundry, Color, Ceramic Fiber, Cement retardant, Dry Cell and others.
Starch derivatives Market – By End User Industry: Food and beverage industry, Medical Industry, Agricultural Industry, Chemical Industry, Personal Care and Hygiene Industry, Paper and Pulp Industry, Textile Industry, Manufacturing Industry, Construction Industry and others.
The Starch derivatives Market report also analyzes the major geographic regions for the market as well as the major countries for the market in these regions. The regions and countries covered in the study include:
- North America: The U.S., Canada, Mexico
- South America: Brazil, Venezuela, Argentina, Ecuador, Peru, Colombia, Costa Rica
- Europe: The U.K., Germany, Italy, France, The Netherlands, Belgium, Spain, Denmark
- APAC: China, Japan, Australia, South Korea, India, Taiwan, Malaysia, Hong Kong
- Middle East and Africa: Israel, South Africa, Saudi Arabia
Starch derivatives Market Key Players Perspective:
On 6 July, the EU and Japan signed a political agreement on an Economic Partnership after 4 years of negotiations. Starch Europe welcomes the agreement and looks forward to improved access to the Japanese market for EU starch products.
Reacting to the news of the agreement reached, Jamie Fortescue, Starch Europe Managing Director, said:
‘With customs duties as high as 900 Euros per tonne for some starch products, access to the Japanese market for EU starch producers today is extremely challenging. The political agreement signed on 6 July should pave the way to new export opportunities for many EU starch producers. Starch Europe looks forward to the publication of the details of the concessions granted on EU starch products and hopes the deal will be finalised and implemented with minimum delay. We much appreciate the work of Commissioner Malmström and Commissioner Hogan in achieving this important step for the EU-Japan trade and thank them for their continued commitment to its rapid completion.’
Some of the Key players in this market that have been studied for this report include: Cargill Inc., Tate & Lyle, Avebe, Ciranda, Archer Daniels Midland, Ingredion, NIC Starch Products Ltd., Agrana Group, Emsland Starke Gmbh, Beneo Gmbh and many more.
Market Research and Market Trends of Starch derivatives Market
- Many major key players within the starch Industry, such as Avebe and Ingredion have invested heavily in product capacity expansions and setting up new plants as a result of the growing demand from the food and beverages industry, pharmaceutical industry and many more. ADM has acquired Chamtor, a French wheat processing company, in 2017 thus boosting its starch production capabilities as well.
- There is Research being done in Nigeria, an importer of $200 million worth starch, for finding alternative sources for the production of starch and its derivatives, instead of Tapioca, a staple food in Nigeria, so as to compete in a the global market. The research done so far by the Raw material and Research and Development Council has shown that Tacca involucrate, a non-staple resource, is the most plausible alternative for starch production.
- There is an upsurge in the experimentation within the food and beverages industry of introducing new textures and feels for the consumers within the food and beverages industry. This is a growth factor for the starch additives markets as starch additives make up the texturants for the food and beverages industry.
- A major trend that is seen in the related market is the increasing number of companies that are also coming up with products that are Non-GMO verified so as to supply to the increasing demand for these products from the USA and Europe.
1. Starch derivatives Market - Overview
1.1. Definitions and Scope
2. Starch derivatives Market - Executive summary
2.1. Market Revenue, Market Size and Key Trends by Company
2.2. Key Trends by type of Application
2.3. Key Trends segmented by Geography
3. Starch derivatives Market
3.1. Comparative analysis
3.1.1. Product Benchmarking - Top 10 companies
3.1.2. Top 5 Financials Analysis
3.1.3. Market Value split by Top 10 companies
3.1.4. Patent Analysis - Top 10 companies
3.1.5. Pricing Analysis
4. Starch derivatives Market Forces
4.1. Drivers
4.2. Constraints
4.3. Challenges
4.4. Porters five force model
4.4.1. Bargaining power of suppliers
4.4.2. Bargaining powers of customers
4.4.3. Threat of new entrants
4.4.4. Rivalry among existing players
4.4.5. Threat of substitutes
5. Starch derivatives Market -Strategic analysis
5.1. Value chain analysis
5.2. Opportunities analysis
5.3. Product life cycle
6. Starch derivatives Market– By Types of Derivatives (Market Size -$Million / $Billion)
6.1. Segment type Size and Market Share Analysis
6.2. Application Revenue and Trends
6.3. Application Segment Analysis by Type
6.3.1. Starch Ethers
6.3.1.1. Carboxymethyl Starches
6.3.1.2. Hydroxyalkyl Starches
6.3.1.3. Cationic Starches
6.3.1.4. Amphoteric Starches
6.3.2. Cross-linked Starches
6.3.3. Starch Esters
6.3.3.1. Starch Acetates
6.3.3.2. Starch Phosphates
6.3.3.3. Starch Octenyl Succinates
6.3.4. Graft Copolymerized Starches
6.3.5. Complex Starches
6.3.5.1. Cross-linked Starch Ether
6.3.5.2. Cross-linked starch Ester
6.3.6. Converted Starches
6.3.6.1. Dextrin
6.3.6.1.1. Pyrodextrins
6.3.6.1.1.1. White Dextrin
6.3.6.1.1.2. Yellow Dextrin
6.3.6.1.2. British gums
6.3.6.1.3. Maltodextrins
6.3.6.2. Oxidized and Thin-boiling starches
6.3.6.2.1. Oxidized Starches
6.3.6.2.2. Oxidized Starch Esters
6.3.6.2.3. Oxidized Starch Ethers
6.3.7. Pre-gelatinized Starches
6.3.7.1. Modified
6.3.7.2. Unmodified
6.3.8. Others
6.3.8.1. Microbial polysaccharides
6.3.8.2. Natural Gum Derivatives
6.3.8.3. Other Modified Starches
7. Starch derivatives Market– By Raw Material (Market Size -$Million / $Billion)
7.1. Wheat
7.2. Corn
7.3. Potato
7.4. Sorghum
7.5. Tapioca
7.6. others
8. Starch derivatives Market – By Method of Application (Market Size -$Million / $Billion)
8.1. Binder
8.2. Thickener and stabilizer
8.3. Cake Mix
8.4. Sweetener
8.5. Lustering Agent
8.6. Powdering agent
8.7. Fish Culture Feed
8.8. Expanded Feed
8.9. Caking agent
8.10. Shampoo
8.11. Dehumidification Agent
8.12. Culture Medium
8.13. Wet End additive for Paper
8.14. Corrugated Paper
8.15. Printing
8.16. Glass fiber
8.17. Foundry
8.18. Color
8.19. Ceramic Fiber
8.20. Cement retardant
8.21. Dry Cell
8.22. Others
9. Starch derivatives Market – By End User Industry (Market Size -$Million / $Billion)
9.1. Market Size and Market Share Analysis
9.2. Application Revenue and Trend Research
9.3. Product Segment Analysis
9.3.1. Food and beverage industry
9.3.2. Medical Industry
9.3.3. Agricultural Industry
9.3.4. Chemical Industry
9.3.5. Personal Care and Hygiene Industry
9.3.6. Paper and Pulp Industry
9.3.7. Textile Industry
9.3.8. Manufacturing Industry
9.3.9. Construction Industry
9.3.10. Others
10. Starch derivatives Market- By Geography (Market Size -$Million / $Billion)
10.1. Starch derivatives Market - North America Segment Research
10.2. North America Market Research (Million / $Billion)
10.2.1. Segment type Size and Market Size Analysis
10.2.2. Revenue and Trends
10.2.3. Application Revenue and Trends by type of Application
10.2.4. Company Revenue and Product Analysis
10.2.5. North America Product type and Application Market Size
10.2.5.1. U.S.
10.2.5.2. Canada
10.2.5.3. Mexico
10.2.5.4. Rest of North America
10.3. Starch derivatives Market- South America Segment Research
10.4. South America Market Research (Market Size -$Million / $Billion)
10.4.1. Segment type Size and Market Size Analysis
10.4.2. Revenue and Trends
10.4.3. Application Revenue and Trends by type of Application
10.4.4. Company Revenue and Product Analysis
10.4.5. South America Product type and Application Market Size
10.4.5.1. Brazil
10.4.5.2. Venezuela
10.4.5.3. Argentina
10.4.5.4. Ecuador
10.4.5.5. Peru
10.4.5.6. Colombia
10.4.5.7. Costa Rica
10.4.5.8. Rest of South America
10.5. Starch derivatives Market- Europe Segment Research
10.6. Europe Market Research (Market Size -$Million / $Billion)
10.6.1. Segment type Size and Market Size Analysis
10.6.2. Revenue and Trends
10.6.3. Application Revenue and Trends by type of Application
10.6.4. Company Revenue and Product Analysis
10.6.5. Europe Segment Product type and Application Market Size
10.6.5.1. U.K
10.6.5.2. Germany
10.6.5.3. Italy
10.6.5.4. France
10.6.5.5. Netherlands
10.6.5.6. Belgium
10.6.5.7. Spain
10.6.5.8. Denmark
10.6.5.9. Rest of Europe
10.7. Starch derivatives Market– APAC Segment Research
10.8. APAC Market Research (Market Size -$Million / $Billion)
10.8.1. Segment type Size and Market Size Analysis
10.8.2. Revenue and Trends
10.8.3. Application Revenue and Trends by type of Application
10.8.4. Company Revenue and Product Analysis
10.8.5. APAC Segment – Product type and Application Market Size
10.8.5.1. China
10.8.5.2. Australia
10.8.5.3. Japan
10.8.5.4. South Korea
10.8.5.5. India
10.8.5.6. Taiwan
10.8.5.7. Malaysia
10.8.5.8. Hong Kong
10.8.5.9. Rest of APAC
10.9. Starch derivatives Market– Middle East Segment and Africa Segment Research
10.10. Middle East & Africa Market Research (Market Size -$Million / $Billion)
10.10.1. Segment type Size and Market Size Analysis
10.10.2. Revenue and Trend Analysis
10.10.3. Application Revenue and Trends by type of Application
10.10.4. Company Revenue and Product Analysis
10.10.5. Middle East Segment Product type and Application Market Size
10.10.5.1. Israel
10.10.5.2. Saudi Arabia
10.10.5.3. UAE
10.10.6. Africa Segment Analysis
10.10.6.1. South Africa
10.10.6.2. Rest of Middle East & Africa
11. Starch derivatives Market - Entropy
11.1. New product launches
11.2. M&A's, collaborations, JVs and partnerships
12. Starch derivatives Market – Industry / Segment Competition landscape Premium
12.1. Market Share Analysis
12.1.1. Market Share by Country- Top companies
12.1.2. Market Share by Region- Top 10 companies
12.1.3. Market Share by type of Application – Top 10 companies
12.1.4. Market Share by type of Product / Product category- Top 10 companies
12.1.5. Market Share at global level- Top 10 companies
12.1.6. Best Practices for companies
13. Starch derivatives Market – Key Company List by Country Premium
14. Starch derivatives Market Company Analysis
14.1. Market Share, Company Revenue, Products, M&A, Developments
14.2. Cargill Inc.
14.3. Tate & Lyle
14.4. Avebe
14.5. Ciranda
14.6. Archer Daniels Midland
14.7. Ingredion
14.8. NIC Starch Products Ltd.
14.9. Agrana Group
14.10. Emsland Starke Gmbh
14.11. Beneo Gmbh
14.12. Company 11
14.13. Company 12
14.14. Company 13 and more
"*Financials would be provided on a best efforts basis for private companies"
15. Starch derivatives Market -Appendix
15.1. Abbreviations
15.2. Sources
16. Starch derivatives Market -Methodology Premium
16.1. Research Methodology
16.1.1. Company Expert Interviews
16.1.2. Industry Databases
16.1.3. Associations
16.1.4. Company News
16.1.5. Company Annual Reports
16.1.6. Application Trends
16.1.7. New Products and Product database
16.1.8. Company Transcripts
16.1.9. R&D Trends
16.1.10. Key Opinion Leaders Interviews
16.1.11. Supply and Demand Trends
List of Tables
Table 1: Starch Derivatives Market Overview 2021-2026
Table 2: Starch Derivatives Market Leader Analysis 2018-2019 (US$)
Table 3: Starch Derivatives Market Product Analysis 2018-2019 (US$)
Table 4: Starch Derivatives Market End User Analysis 2018-2019 (US$)
Table 5: Starch Derivatives Market Patent Analysis 2013-2018* (US$)
Table 6: Starch Derivatives Market Financial Analysis 2018-2019 (US$)
Table 7: Starch Derivatives Market Driver Analysis 2018-2019 (US$)
Table 8: Starch Derivatives Market Challenges Analysis 2018-2019 (US$)
Table 9: Starch Derivatives Market Constraint Analysis 2018-2019 (US$)
Table 10: Starch Derivatives Market Supplier Bargaining Power Analysis 2018-2019 (US$)
Table 11: Starch Derivatives Market Buyer Bargaining Power Analysis 2018-2019 (US$)
Table 12: Starch Derivatives Market Threat of Substitutes Analysis 2018-2019 (US$)
Table 13: Starch Derivatives Market Threat of New Entrants Analysis 2018-2019 (US$)
Table 14: Starch Derivatives Market Degree of Competition Analysis 2018-2019 (US$)
Table 15: Starch Derivatives Market Value Chain Analysis 2018-2019 (US$)
Table 16: Starch Derivatives Market Pricing Analysis 2021-2026 (US$)
Table 17: Starch Derivatives Market Opportunities Analysis 2021-2026 (US$)
Table 18: Starch Derivatives Market Product Life Cycle Analysis 2021-2026 (US$)
Table 19: Starch Derivatives Market Supplier Analysis 2018-2019 (US$)
Table 20: Starch Derivatives Market Distributor Analysis 2018-2019 (US$)
Table 21: Starch Derivatives Market Trend Analysis 2018-2019 (US$)
Table 22: Starch Derivatives Market Size 2018 (US$)
Table 23: Starch Derivatives Market Forecast Analysis 2021-2026 (US$)
Table 24: Starch Derivatives Market Sales Forecast Analysis 2021-2026 (Units)
Table 25: Starch Derivatives Market, Revenue & Volume, By Type, 2021-2026 ($)
Table 26: Starch Derivatives Market By Type, Revenue & Volume, By Maltodextrins, 2021-2026 ($)
Table 27: Starch Derivatives Market By Type, Revenue & Volume, By Cyclodextrins, 2021-2026 ($)
Table 28: Starch Derivatives Market By Type, Revenue & Volume, By Glucose Syrup, 2021-2026 ($)
Table 29: Starch Derivatives Market By Type, Revenue & Volume, By Hydrolysates, 2021-2026 ($)
Table 30: Starch Derivatives Market By Type, Revenue & Volume, By Modified Starch, 2021-2026 ($)
Table 31: Starch Derivatives Market, Revenue & Volume, By Application, 2021-2026 ($)
Table 32: Starch Derivatives Market By Application, Revenue & Volume, By Food & Beverage, 2021-2026 ($)
Table 33: Starch Derivatives Market By Application, Revenue & Volume, By Cosmetics, 2021-2026 ($)
Table 34: Starch Derivatives Market By Application, Revenue & Volume, By Paper, 2021-2026 ($)
Table 35: Starch Derivatives Market By Application, Revenue & Volume, By Animal Feed, 2021-2026 ($)
Table 36: Starch Derivatives Market By Application, Revenue & Volume, By Bio-Ethanol, 2021-2026 ($)
Table 37: North America Starch Derivatives Market, Revenue & Volume, By Type, 2021-2026 ($)
Table 38: North America Starch Derivatives Market, Revenue & Volume, By Application, 2021-2026 ($)
Table 39: South america Starch Derivatives Market, Revenue & Volume, By Type, 2021-2026 ($)
Table 40: South america Starch Derivatives Market, Revenue & Volume, By Application, 2021-2026 ($)
Table 41: Europe Starch Derivatives Market, Revenue & Volume, By Type, 2021-2026 ($)
Table 42: Europe Starch Derivatives Market, Revenue & Volume, By Application, 2021-2026 ($)
Table 43: APAC Starch Derivatives Market, Revenue & Volume, By Type, 2021-2026 ($)
Table 44: APAC Starch Derivatives Market, Revenue & Volume, By Application, 2021-2026 ($)
Table 45: Middle East & Africa Starch Derivatives Market, Revenue & Volume, By Type, 2021-2026 ($)
Table 46: Middle East & Africa Starch Derivatives Market, Revenue & Volume, By Application, 2021-2026 ($)
Table 47: Russia Starch Derivatives Market, Revenue & Volume, By Type, 2021-2026 ($)
Table 48: Russia Starch Derivatives Market, Revenue & Volume, By Application, 2021-2026 ($)
Table 49: Israel Starch Derivatives Market, Revenue & Volume, By Type, 2021-2026 ($)
Table 50: Israel Starch Derivatives Market, Revenue & Volume, By Application, 2021-2026 ($)
Table 51: Top Companies 2018 (US$)Starch Derivatives Market, Revenue & Volume
Table 52: Product Launch 2018-2019Starch Derivatives Market, Revenue & Volume
Table 53: Mergers & Acquistions 2018-2019Starch Derivatives Market, Revenue & Volume
List of Figures
Figure 1: Overview of Starch Derivatives Market 2021-2026
Figure 2: Market Share Analysis for Starch Derivatives Market 2018 (US$)
Figure 3: Product Comparison in Starch Derivatives Market 2018-2019 (US$)
Figure 4: End User Profile for Starch Derivatives Market 2018-2019 (US$)
Figure 5: Patent Application and Grant in Starch Derivatives Market 2013-2018* (US$)
Figure 6: Top 5 Companies Financial Analysis in Starch Derivatives Market 2018-2019 (US$)
Figure 7: Market Entry Strategy in Starch Derivatives Market 2018-2019
Figure 8: Ecosystem Analysis in Starch Derivatives Market 2018
Figure 9: Average Selling Price in Starch Derivatives Market 2021-2026
Figure 10: Top Opportunites in Starch Derivatives Market 2018-2019
Figure 11: Market Life Cycle Analysis in Starch Derivatives Market
Figure 12: GlobalBy TypeStarch Derivatives Market Revenue, 2021-2026 ($)
Figure 13: GlobalBy ApplicationStarch Derivatives Market Revenue, 2021-2026 ($)
Figure 14: Global Starch Derivatives Market - By Geography
Figure 15: Global Starch Derivatives Market Value & Volume, By Geography, 2021-2026 ($)
Figure 16: Global Starch Derivatives Market CAGR, By Geography, 2021-2026 (%)
Figure 17: North America Starch Derivatives Market Value & Volume, 2021-2026 ($)
Figure 18: US Starch Derivatives Market Value & Volume, 2021-2026 ($)
Figure 19: US GDP and Population, 2018-2019 ($)
Figure 20: US GDP – Composition of 2018, By Sector of Origin
Figure 21: US Export and Import Value & Volume, 2018-2019 ($)
Figure 22: Canada Starch Derivatives Market Value & Volume, 2021-2026 ($)
Figure 23: Canada GDP and Population, 2018-2019 ($)
Figure 24: Canada GDP – Composition of 2018, By Sector of Origin
Figure 25: Canada Export and Import Value & Volume, 2018-2019 ($)
Figure 26: Mexico Starch Derivatives Market Value & Volume, 2021-2026 ($)
Figure 27: Mexico GDP and Population, 2018-2019 ($)
Figure 28: Mexico GDP – Composition of 2018, By Sector of Origin
Figure 29: Mexico Export and Import Value & Volume, 2018-2019 ($)
Figure 30: South America Starch Derivatives Market Value & Volume, 2021-2026 ($)
Figure 31: Brazil Starch Derivatives Market Value & Volume, 2021-2026 ($)
Figure 32: Brazil GDP and Population, 2018-2019 ($)
Figure 33: Brazil GDP – Composition of 2018, By Sector of Origin
Figure 34: Brazil Export and Import Value & Volume, 2018-2019 ($)
Figure 35: Venezuela Starch Derivatives Market Value & Volume, 2021-2026 ($)
Figure 36: Venezuela GDP and Population, 2018-2019 ($)
Figure 37: Venezuela GDP – Composition of 2018, By Sector of Origin
Figure 38: Venezuela Export and Import Value & Volume, 2018-2019 ($)
Figure 39: Argentina Starch Derivatives Market Value & Volume, 2021-2026 ($)
Figure 40: Argentina GDP and Population, 2018-2019 ($)
Figure 41: Argentina GDP – Composition of 2018, By Sector of Origin
Figure 42: Argentina Export and Import Value & Volume, 2018-2019 ($)
Figure 43: Ecuador Starch Derivatives Market Value & Volume, 2021-2026 ($)
Figure 44: Ecuador GDP and Population, 2018-2019 ($)
Figure 45: Ecuador GDP – Composition of 2018, By Sector of Origin
Figure 46: Ecuador Export and Import Value & Volume, 2018-2019 ($)
Figure 47: Peru Starch Derivatives Market Value & Volume, 2021-2026 ($)
Figure 48: Peru GDP and Population, 2018-2019 ($)
Figure 49: Peru GDP – Composition of 2018, By Sector of Origin
Figure 50: Peru Export and Import Value & Volume, 2018-2019 ($)
Figure 51: Colombia Starch Derivatives Market Value & Volume, 2021-2026 ($)
Figure 52: Colombia GDP and Population, 2018-2019 ($)
Figure 53: Colombia GDP – Composition of 2018, By Sector of Origin
Figure 54: Colombia Export and Import Value & Volume, 2018-2019 ($)
Figure 55: Costa Rica Starch Derivatives Market Value & Volume, 2021-2026 ($)
Figure 56: Costa Rica GDP and Population, 2018-2019 ($)
Figure 57: Costa Rica GDP – Composition of 2018, By Sector of Origin
Figure 58: Costa Rica Export and Import Value & Volume, 2018-2019 ($)
Figure 59: Europe Starch Derivatives Market Value & Volume, 2021-2026 ($)
Figure 60: U.K Starch Derivatives Market Value & Volume, 2021-2026 ($)
Figure 61: U.K GDP and Population, 2018-2019 ($)
Figure 62: U.K GDP – Composition of 2018, By Sector of Origin
Figure 63: U.K Export and Import Value & Volume, 2018-2019 ($)
Figure 64: Germany Starch Derivatives Market Value & Volume, 2021-2026 ($)
Figure 65: Germany GDP and Population, 2018-2019 ($)
Figure 66: Germany GDP – Composition of 2018, By Sector of Origin
Figure 67: Germany Export and Import Value & Volume, 2018-2019 ($)
Figure 68: Italy Starch Derivatives Market Value & Volume, 2021-2026 ($)
Figure 69: Italy GDP and Population, 2018-2019 ($)
Figure 70: Italy GDP – Composition of 2018, By Sector of Origin
Figure 71: Italy Export and Import Value & Volume, 2018-2019 ($)
Figure 72: France Starch Derivatives Market Value & Volume, 2021-2026 ($)
Figure 73: France GDP and Population, 2018-2019 ($)
Figure 74: France GDP – Composition of 2018, By Sector of Origin
Figure 75: France Export and Import Value & Volume, 2018-2019 ($)
Figure 76: Netherlands Starch Derivatives Market Value & Volume, 2021-2026 ($)
Figure 77: Netherlands GDP and Population, 2018-2019 ($)
Figure 78: Netherlands GDP – Composition of 2018, By Sector of Origin
Figure 79: Netherlands Export and Import Value & Volume, 2018-2019 ($)
Figure 80: Belgium Starch Derivatives Market Value & Volume, 2021-2026 ($)
Figure 81: Belgium GDP and Population, 2018-2019 ($)
Figure 82: Belgium GDP – Composition of 2018, By Sector of Origin
Figure 83: Belgium Export and Import Value & Volume, 2018-2019 ($)
Figure 84: Spain Starch Derivatives Market Value & Volume, 2021-2026 ($)
Figure 85: Spain GDP and Population, 2018-2019 ($)
Figure 86: Spain GDP – Composition of 2018, By Sector of Origin
Figure 87: Spain Export and Import Value & Volume, 2018-2019 ($)
Figure 88: Denmark Starch Derivatives Market Value & Volume, 2021-2026 ($)
Figure 89: Denmark GDP and Population, 2018-2019 ($)
Figure 90: Denmark GDP – Composition of 2018, By Sector of Origin
Figure 91: Denmark Export and Import Value & Volume, 2018-2019 ($)
Figure 92: APAC Starch Derivatives Market Value & Volume, 2021-2026 ($)
Figure 93: China Starch Derivatives Market Value & Volume, 2021-2026
Figure 94: China GDP and Population, 2018-2019 ($)
Figure 95: China GDP – Composition of 2018, By Sector of Origin
Figure 96: China Export and Import Value & Volume, 2018-2019 ($)Starch Derivatives Market China Export and Import Value & Volume, 2018-2019 ($)
Figure 97: Australia Starch Derivatives Market Value & Volume, 2021-2026 ($)
Figure 98: Australia GDP and Population, 2018-2019 ($)
Figure 99: Australia GDP – Composition of 2018, By Sector of Origin
Figure 100: Australia Export and Import Value & Volume, 2018-2019 ($)
Figure 101: South Korea Starch Derivatives Market Value & Volume, 2021-2026 ($)
Figure 102: South Korea GDP and Population, 2018-2019 ($)
Figure 103: South Korea GDP – Composition of 2018, By Sector of Origin
Figure 104: South Korea Export and Import Value & Volume, 2018-2019 ($)
Figure 105: India Starch Derivatives Market Value & Volume, 2021-2026 ($)
Figure 106: India GDP and Population, 2018-2019 ($)
Figure 107: India GDP – Composition of 2018, By Sector of Origin
Figure 108: India Export and Import Value & Volume, 2018-2019 ($)
Figure 109: Taiwan Starch Derivatives Market Value & Volume, 2021-2026 ($)
Figure 110: Taiwan GDP and Population, 2018-2019 ($)
Figure 111: Taiwan GDP – Composition of 2018, By Sector of Origin
Figure 112: Taiwan Export and Import Value & Volume, 2018-2019 ($)
Figure 113: Malaysia Starch Derivatives Market Value & Volume, 2021-2026 ($)
Figure 114: Malaysia GDP and Population, 2018-2019 ($)
Figure 115: Malaysia GDP – Composition of 2018, By Sector of Origin
Figure 116: Malaysia Export and Import Value & Volume, 2018-2019 ($)
Figure 117: Hong Kong Starch Derivatives Market Value & Volume, 2021-2026 ($)
Figure 118: Hong Kong GDP and Population, 2018-2019 ($)
Figure 119: Hong Kong GDP – Composition of 2018, By Sector of Origin
Figure 120: Hong Kong Export and Import Value & Volume, 2018-2019 ($)
Figure 121: Middle East & Africa Starch Derivatives Market Middle East & Africa 3D Printing Market Value & Volume, 2021-2026 ($)
Figure 122: Russia Starch Derivatives Market Value & Volume, 2021-2026 ($)
Figure 123: Russia GDP and Population, 2018-2019 ($)
Figure 124: Russia GDP – Composition of 2018, By Sector of Origin
Figure 125: Russia Export and Import Value & Volume, 2018-2019 ($)
Figure 126: Israel Starch Derivatives Market Value & Volume, 2021-2026 ($)
Figure 127: Israel GDP and Population, 2018-2019 ($)
Figure 128: Israel GDP – Composition of 2018, By Sector of Origin
Figure 129: Israel Export and Import Value & Volume, 2018-2019 ($)
Figure 130: Entropy Share, By Strategies, 2018-2019* (%)Starch Derivatives Market
Figure 131: Developments, 2018-2019*Starch Derivatives Market
Figure 132: Company 1 Starch Derivatives Market Net Revenue, By Years, 2018-2019* ($)
Figure 133: Company 1 Starch Derivatives Market Net Revenue Share, By Business segments, 2018 (%)
Figure 134: Company 1 Starch Derivatives Market Net Sales Share, By Geography, 2018 (%)
Figure 135: Company 2 Starch Derivatives Market Net Revenue, By Years, 2018-2019* ($)
Figure 136: Company 2 Starch Derivatives Market Net Revenue Share, By Business segments, 2018 (%)
Figure 137: Company 2 Starch Derivatives Market Net Sales Share, By Geography, 2018 (%)
Figure 138: Company 3 Starch Derivatives Market Net Revenue, By Years, 2018-2019* ($)
Figure 139: Company 3 Starch Derivatives Market Net Revenue Share, By Business segments, 2018 (%)
Figure 140: Company 3 Starch Derivatives Market Net Sales Share, By Geography, 2018 (%)
Figure 141: Company 4 Starch Derivatives Market Net Revenue, By Years, 2018-2019* ($)
Figure 142: Company 4 Starch Derivatives Market Net Revenue Share, By Business segments, 2018 (%)
Figure 143: Company 4 Starch Derivatives Market Net Sales Share, By Geography, 2018 (%)
Figure 144: Company 5 Starch Derivatives Market Net Revenue, By Years, 2018-2019* ($)
Figure 145: Company 5 Starch Derivatives Market Net Revenue Share, By Business segments, 2018 (%)
Figure 146: Company 5 Starch Derivatives Market Net Sales Share, By Geography, 2018 (%)
Figure 147: Company 6 Starch Derivatives Market Net Revenue, By Years, 2018-2019* ($)
Figure 148: Company 6 Starch Derivatives Market Net Revenue Share, By Business segments, 2018 (%)
Figure 149: Company 6 Starch Derivatives Market Net Sales Share, By Geography, 2018 (%)
Figure 150: Company 7 Starch Derivatives Market Net Revenue, By Years, 2018-2019* ($)
Figure 151: Company 7 Starch Derivatives Market Net Revenue Share, By Business segments, 2018 (%)
Figure 152: Company 7 Starch Derivatives Market Net Sales Share, By Geography, 2018 (%)
Figure 153: Company 8 Starch Derivatives Market Net Revenue, By Years, 2018-2019* ($)
Figure 154: Company 8 Starch Derivatives Market Net Revenue Share, By Business segments, 2018 (%)
Figure 155: Company 8 Starch Derivatives Market Net Sales Share, By Geography, 2018 (%)
Figure 156: Company 9 Starch Derivatives Market Net Revenue, By Years, 2018-2019* ($)
Figure 157: Company 9 Starch Derivatives Market Net Revenue Share, By Business segments, 2018 (%)
Figure 158: Company 9 Starch Derivatives Market Net Sales Share, By Geography, 2018 (%)
Figure 159: Company 10 Starch Derivatives Market Net Revenue, By Years, 2018-2019* ($)
Figure 160: Company 10 Starch Derivatives Market Net Revenue Share, By Business segments, 2018 (%)
Figure 161: Company 10 Starch Derivatives Market Net Sales Share, By Geography, 2018 (%)
Figure 162: Company 11 Starch Derivatives Market Net Revenue, By Years, 2018-2019* ($)
Figure 163: Company 11 Starch Derivatives Market Net Revenue Share, By Business segments, 2018 (%)
Figure 164: Company 11 Starch Derivatives Market Net Sales Share, By Geography, 2018 (%)
Figure 165: Company 12 Starch Derivatives Market Net Revenue, By Years, 2018-2019* ($)
Figure 166: Company 12 Starch Derivatives Market Net Revenue Share, By Business segments, 2018 (%)
Figure 167: Company 12 Starch Derivatives Market Net Sales Share, By Geography, 2018 (%)
Figure 168: Company 13 Starch Derivatives Market Net Revenue, By Years, 2018-2019* ($)
Figure 169: Company 13 Starch Derivatives Market Net Revenue Share, By Business segments, 2018 (%)
Figure 170: Company 13 Starch Derivatives Market Net Sales Share, By Geography, 2018 (%)
Figure 171: Company 14 Starch Derivatives Market Net Revenue, By Years, 2018-2019* ($)
Figure 172: Company 14 Starch Derivatives Market Net Revenue Share, By Business segments, 2018 (%)
Figure 173: Company 14 Starch Derivatives Market Net Sales Share, By Geography, 2018 (%)
Figure 174: Company 15 Starch Derivatives Market Net Revenue, By Years, 2018-2019* ($)
Figure 175: Company 15 Starch Derivatives Market Net Revenue Share, By Business segments, 2018 (%)
Figure 176: Company 15 Starch Derivatives Market Net Sales Share, By Geography, 2018 (%)