 Email
Email Print
Print


Overview
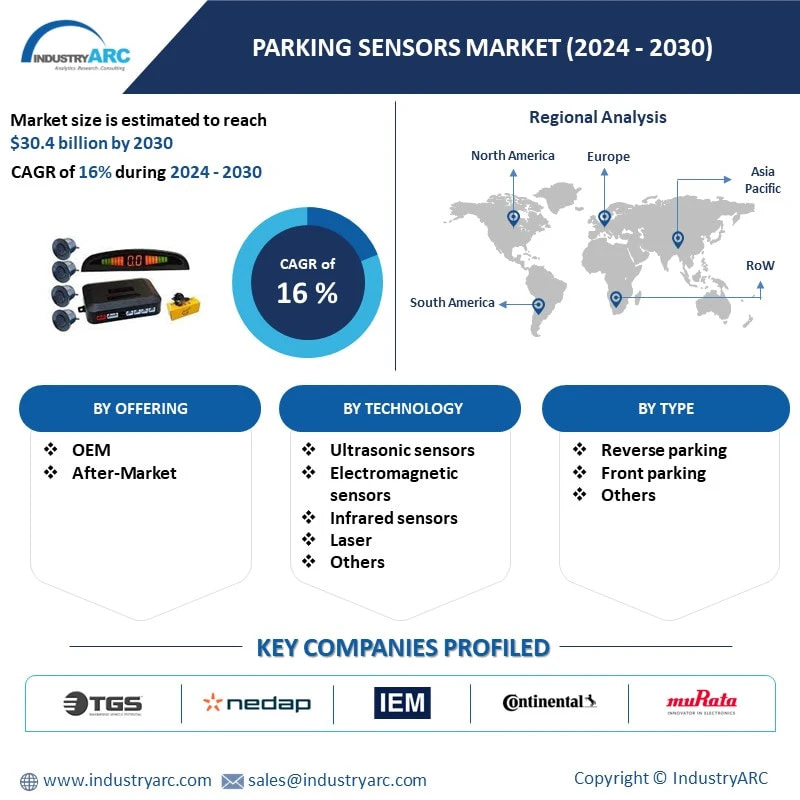
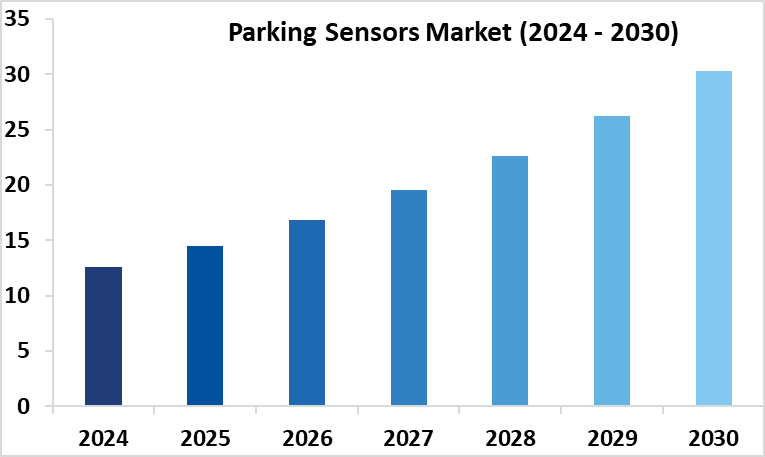
Parking Sensors Market size is forecast to reach USD 30.4 billion by 2030, after growing at a CAGR of 16% during the forecast period 2024-2030. Parking sensors have become indispensable components in modern vehicle technology, revolutionizing the way drivers perceive and manage parking spaces. Parking sensors are increasingly incorporating advanced technologies such as ultrasonic, electromagnetic, and camera-based systems to enhance accuracy and reliability. These technologies enable vehicles to detect obstacles more efficiently, reducing the risk of accidents and property damage. The emergence of smart parking solutions utilizing sensors enables drivers to locate available parking spots quickly and efficiently. Smart parking systems leverage sensor data to provide real-time information on parking availability, optimizing traffic flow and enhancing the overall parking experience.
Parking sensors are increasingly being integrated with Internet of Things (IoT) technology and connectivity features, allowing seamless communication between vehicles and parking infrastructure. This integration enables functionalities such as remote monitoring, automated payments, and reservation systems, streamlining the parking process for both drivers and parking operators. Manufacturers are focusing on enhancing the safety features of parking sensors by integrating them with collision avoidance systems and autonomous driving technologies. These enhancements aim to mitigate the risk of accidents during parking maneuvers and improve overall vehicle safety standards. Parking sensors are integral to the development of smart parking solutions, which optimize parking space utilization, reduce traffic congestion, and enhance overall urban mobility. These solutions leverage sensor data to provide real-time parking availability information to drivers, leading to more efficient parking management.
Market Snapshot:
Report Coverage
The report “Parking Sensors Market – Forecast (2024-2030)”, by IndustryARC, covers an in-depth analysis of the following segments of the Parking Sensors Market.
By Type: Reverse parking, Front parking and Others
By Technology: Ultrasonic sensors, Electromagnetic sensors and Infrared sensors, Laser and Others.
By Offering: Original Equipment Manufacturing, After-market.
By Components: Displays, Control modules, Sensors and others.
By Vehicle Type: Passenger vehicles, Light commercial vehicles and Heavy commercial vehicles.
By Geography: North America (U.S, Canada, Mexico), Europe (Germany, UK, France, Italy, Spain, Russia, Netherlands and Others), APAC (China, Japan India, South Korea, Australia & New Zealand, Indonesia, Malaysia, Taiwan and Others), South America (Brazil, Argentina, Chile, Colombia and others), and RoW (Middle East and Africa).
Key Takeaways
• Europe held the largest market share with 41.1% in 2023. European cities are characterized by high population densities and limited parking spaces. As urbanization continues, the demand for efficient parking solutions rises exponentially. Parking sensors offer a practical solution to optimize parking space utilization and alleviate congestion in densely populated urban areas.
• The demand for ultrasonic sensors in the Parking Sensors Market is experiencing significant growth due to several key factors. Ultrasonic sensors offer unparalleled accuracy and reliability in detecting obstacles and measuring distances, crucial for efficient parking management systems.
• The rising urbanization and the proliferation of vehicles have amplified the need for efficient parking management solutions. Ultrasonic sensors facilitate real-time monitoring of parking spaces, optimizing usage and reducing congestion, aligning with the demand for smart parking systems.
By Technology - Segment Analysis
Ultrasonic Sensors dominated the Parking Sensors Market in 2023. The demand for ultrasonic sensors in the Parking Sensors Market is experiencing significant growth due to several key factors. Ultrasonic sensors offer unparalleled accuracy and reliability in detecting obstacles and measuring distances, crucial for efficient parking management systems. As urbanization and vehicle ownership rates increase, the need for effective parking solutions intensifies, driving the adoption of ultrasonic sensors. Moreover, regulatory requirements mandating the integration of parking assistance technologies in vehicles further propel the demand for ultrasonic sensors. These sensors enhance safety by assisting drivers in maneuvering vehicles into parking spaces, reducing the risk of accidents and collisions. Additionally, advancements in sensor technology have led to cost efficiencies and scalability, making ultrasonic sensors accessible for a wide range of parking applications, further fueling their demand in the market.
By Vehicle Type - Segment Analysis
Passenger vehicles dominated the Parking Sensors Market in 2023. As consumers increasingly prioritize safety and convenience features in their vehicles, parking sensors have become a crucial component. Passenger vehicles equipped with parking sensors offer drivers enhanced visibility and assistance when maneuvering into parking spaces, reducing the risk of collisions and alleviating parking-related stress. With rapid urbanization, city streets and parking lots are becoming more congested. As a result, drivers seek vehicles equipped with parking sensors to facilitate smoother parking experiences in tight urban environments where parking space is limited. The convenience offered by parking sensors in passenger vehicles appeals to urban dwellers facing parking challenges on a daily basis. Stringent safety regulations and mandates imposed by governments and regulatory bodies have prompted automakers to integrate advanced safety features, including parking sensors, into passenger vehicles. Compliance with safety standards and the desire to meet consumer expectations for modern safety features drive the adoption of parking sensors in the passenger vehicle segment. In a competitive automotive market, manufacturers seek to differentiate their vehicles by offering advanced technology features. Parking sensors contribute to enhancing the overall value proposition of passenger vehicles, attracting consumers seeking modern amenities and technological innovation in their vehicle purchases.
By Geography - Segment Analysis
Europe held the largest share of approximately 41.1% of the total share in 2023. European cities are characterized by high population densities and limited parking spaces. As urbanization continues, the demand for efficient parking solutions rises exponentially. Parking sensors offer a practical solution to optimize parking space utilization and alleviate congestion in densely populated urban areas. European countries have stringent regulations and safety standards concerning vehicle emissions, road safety, and parking infrastructure. Authorities impose strict requirements for parking facilities to enhance safety, reduce accidents, and minimize environmental impact. Parking sensors aid in compliance with these regulations by providing real-time monitoring and guidance to drivers, ensuring safe and efficient parking maneuvers. With increasing environmental awareness and sustainability initiatives, there is a growing emphasis on reducing traffic congestion and emissions in European cities. Parking sensors enable efficient parking management, leading to reduced idling times and fuel consumption, contributing to environmental conservation efforts across Europe is also anticipated to drive market growth.
Drivers – Parking Sensors Market
• The increasing regulations by the government towards passengers safety
The emphasis on passenger safety prompts continuous innovation in parking sensor technology. Manufacturers invest in research and development to enhance sensor accuracy, reliability, and functionality, aligning with stringent regulatory standards. For instance, the U.S. Department of Transportation has extended the comment period for its proposed rule on Airline Ticket Refunds and Consumer Protections until December 16, 2022. Both Airlines for America and the International Air Transport Association, along with other petitioners, seek clarifications on various issues raised in the NPRM. With increasing awareness of safety concerns, consumers demand vehicles equipped with advanced safety features. Parking sensors, mandated by government regulations, address consumer expectations for enhanced safety measures in automobiles. Governments prioritize reducing road accidents and associated liabilities. By enforcing regulations that mandate the installation of parking sensors, authorities aim to mitigate the risks of collisions and enhance overall road safety. Governments prioritize reducing road accidents and associated liabilities. By enforcing regulations that mandate the installation of parking sensors, authorities aim to mitigate the risks of collisions and enhance overall road safety.
• Rising adoption of parking sensor for various applications
Parking sensors contribute significantly to enhancing safety by providing drivers with real-time assistance in maneuvering their vehicles into parking spaces. By detecting obstacles and providing alerts, parking sensors help prevent accidents and mitigate potential damages to vehicles and surrounding structures. In urban environments where parking space is limited, the efficient utilization of available parking spots is crucial. Parking sensors enable drivers to locate vacant spaces quickly and guide them to optimal parking spots, reducing congestion and maximizing parking capacity in busy areas. The integration of advanced technologies such as ultrasonic sensors, LiDAR, and radar into parking sensor systems enhances user experience and convenience. Drivers benefit from seamless parking assistance, streamlined parking processes, and reduced stress associated with finding parking spaces in crowded areas. The rise of smart parking solutions and IoT technologies has accelerated the adoption of parking sensors. Integration with smart parking platforms allows for centralized monitoring, management, and optimization of parking facilities, leading to improved operational efficiency and cost savings for parking operators.
Challenges – Parking Sensors Market
High cost associated with parking sensor raw materials
Many parking sensor raw materials, such as rare earth metals and advanced polymers, are subject to scarcity and price fluctuations in the global market. Limited availability and geopolitical tensions can lead to sudden spikes in material costs, impacting the profitability and affordability of parking sensor production. Developing innovative parking sensor technologies requires substantial investment in research and development. Companies must allocate resources to explore alternative materials and manufacturing processes that offer cost-effective solutions without compromising sensor performance and reliability. Disruptions in the supply chain, such as transportation delays, trade restrictions, and natural disasters, can disrupt the availability of parking sensor raw materials. These disruptions not only increase procurement costs but also disrupt production schedules, leading to potential delays in product launches and fulfillment. These limitations are projected to limit market revenue growth.
Market Landscape
Technology launches, acquisitions, and R&D activities are key strategies adopted by players in the Parking Sensors Market. in 2023, The major players in the Parking Sensors Market are TGS Group, Nedap N.V., IEM SA, Continental AG, Murata Manufacturing Co. Ltd., NXP Semiconductors N.V, Robert Bosch GmbH, Valeo, Xvision Ltd, Quanzhou Minpn Electronic Co., Ltd and Others.
Developments:
In May 2022, Jieshun introduced a new ultrasonic parking sensor with a comprehensive guidance solution, collecting real-time parking space data. Upon detecting parked cars, the sensor alters indicators from green to red, with the main controller processing and displaying available parking spots for efficient parking management.
1. Parking Sensors Market- Overview
1.1. Definitions and Scope
2. Parking Sensors Market- Executive Summary
2.1. Key trends by Type
2.2. Key trends by Technology
2.3. Key trends by Offering
2.4. Key trends by Components
2.5. Key trends by Vehicle Type
2.6. Key trends by Geography
3. Parking Sensors Market- Comparative Analysis
3.1. Company Benchmarking - Key Companies
3.2. Global Financial Analysis - Key Companies
3.3. Market Share Analysis - Key Companies
3.4. Patent Analysis
3.5. Pricing Analysis
4. Parking Sensors Market- Start-up Companies Scenario
4.1. Key Start-up Company Analysis by
4.1.1. Investment
4.1.2. Revenue
4.1.3. Venture Capital and Funding Scenario
5. Parking Sensors Market– Market Entry Scenario Premium
5.1. Regulatory Framework Overview
5.2. New Business and Ease of Doing Business Index
5.3. Case Studies of Successful Ventures
6. Parking Sensors Market- Forces
6.1. Market Drivers
6.2. Market Constraints
6.3. Market Challenges
6.4. Porter's Five Force Model
6.4.1. Bargaining Power of Suppliers
6.4.2. Bargaining Powers of Customers
6.4.3. Threat of New Entrants
6.4.4. Rivalry Among Existing Players
6.4.5. Threat of Substitutes
7. Parking Sensors Market– Strategic Analysis
7.1. Value Chain Analysis
7.2. Opportunities Analysis
7.3. Market Life Cycle
8. Parking Sensors Market– by Type (Market Size – $Million/$Billion)
8.1. Reverse parking
8.2. Front parking
8.3. Others
9. Parking Sensors Market– by Technology (Market Size – $Million/$Billion)
9.1. Ultrasonic sensors
9.2. Electromagnetic sensors
9.3. Infrared sensors
9.4. Laser
9.5. Others
10. Parking Sensors Market– by Offering (Market Size – $Million/$Billion)
10.1. OEM
10.2. After-Market
11. Parking Sensors Market– by Components (Market Size – $Million/$Billion)
11.1. Displays
11.2. Control modules
11.3. Sensors
11.4. Others
12. Parking Sensors Market– by Vehicle Type (Market Size – $Million/$Billion)
12.1. Passenger cars
12.1.1. Small car
12.1.2. Sedan
12.1.3. SUV
12.1.4. Others
12.2. Light Commercial Vehicles
12.2.1. Carrier trucks
12.2.2. Utility Vehicle
12.2.3. Others
12.3. Heavy Commercial Vehicles
13. Parking Sensors Market – by Geography (Market Size – $Million/$Billion)
13.1. North America
13.1.1. U.S
13.1.2. Canada
13.1.3. Mexico
13.2. Europe
13.2.1. Germany
13.2.2. France
13.2.3. UK
13.2.4. Italy
13.2.5. Spain
13.2.6. Belgium
13.2.7. Netherlands
13.2.8. Rest of Europe
13.3. Asia-Pacific
13.3.1. China
13.3.2. Japan
13.3.3. South Korea
13.3.4. India
13.3.5. Australia & New Zealand
13.3.6. Indonesia
13.3.7. Malaysia
13.3.8. Taiwan
13.3.9. Rest of Asia-Pacific
13.4. South America
13.4.1. Brazil
13.4.2. Argentina
13.4.3. Chile
13.4.4. Colombia
13.4.5. Rest of South America
13.5. Rest of The World
13.5.1. Middle East
13.5.2. Africa
14. Parking Sensors Market– Entropy
15. Parking Sensors Market– Industry/Segment Competition Landscape
15.1. Market Share Analysis
15.1.1. Market Share by Product Type – Key Companies
15.1.2. Market Share by Region – Key Companies
15.1.3. Market Share by Country – Key Companies
15.2. Competition Matrix
15.3. Best Practices for Companies
16. Parking Sensors Market– Key Company List by Country Premium
17. Parking Sensors Market- Company Analysis
17.1. TGS Group
17.2. Nedap N.V.
17.3. IEM SA
17.4. Continental AG
17.5. Murata Manufacturing Co. Ltd.
17.6. NXP Semiconductors N.V
17.7. Robert Bosch GmbH
17.8. Valeo
17.9. Xvision Ltd
17.10. Quanzhou Minpn Electronic Co., Ltd
"Financials to the Private Companies would be provided on best-effort basis."
List of Tables
Table 1: Parking Sensors Market Overview 2021-2026
Table 2: Parking Sensors Market Leader Analysis 2018-2019 (US$)
Table 3: Parking Sensors Market Product Analysis 2018-2019 (US$)
Table 4: Parking Sensors Market End User Analysis 2018-2019 (US$)
Table 5: Parking Sensors Market Patent Analysis 2013-2018* (US$)
Table 6: Parking Sensors Market Financial Analysis 2018-2019 (US$)
Table 7: Parking Sensors Market Driver Analysis 2018-2019 (US$)
Table 8: Parking Sensors Market Challenges Analysis 2018-2019 (US$)
Table 9: Parking Sensors Market Constraint Analysis 2018-2019 (US$)
Table 10: Parking Sensors Market Supplier Bargaining Power Analysis 2018-2019 (US$)
Table 11: Parking Sensors Market Buyer Bargaining Power Analysis 2018-2019 (US$)
Table 12: Parking Sensors Market Threat of Substitutes Analysis 2018-2019 (US$)
Table 13: Parking Sensors Market Threat of New Entrants Analysis 2018-2019 (US$)
Table 14: Parking Sensors Market Degree of Competition Analysis 2018-2019 (US$)
Table 15: Parking Sensors Market Value Chain Analysis 2018-2019 (US$)
Table 16: Parking Sensors Market Pricing Analysis 2021-2026 (US$)
Table 17: Parking Sensors Market Opportunities Analysis 2021-2026 (US$)
Table 18: Parking Sensors Market Product Life Cycle Analysis 2021-2026 (US$)
Table 19: Parking Sensors Market Supplier Analysis 2018-2019 (US$)
Table 20: Parking Sensors Market Distributor Analysis 2018-2019 (US$)
Table 21: Parking Sensors Market Trend Analysis 2018-2019 (US$)
Table 22: Parking Sensors Market Size 2018 (US$)
Table 23: Parking Sensors Market Forecast Analysis 2021-2026 (US$)
Table 24: Parking Sensors Market Sales Forecast Analysis 2021-2026 (Units)
Table 25: Parking Sensors Market, Revenue & Volume, By Fitment Type, 2021-2026 ($)
Table 26: Parking Sensors Market By Fitment Type, Revenue & Volume, By OEM, 2021-2026 ($)
Table 27: Parking Sensors Market By Fitment Type, Revenue & Volume, By After-Market, 2021-2026 ($)
Table 28: Parking Sensors Market, Revenue & Volume, By Technology, 2021-2026 ($)
Table 29: Parking Sensors Market By Technology, Revenue & Volume, By Ultrasonic Sensors, 2021-2026 ($)
Table 30: Parking Sensors Market By Technology, Revenue & Volume, By Electromagnetic Sensors, 2021-2026 ($)
Table 31: North America Parking Sensors Market, Revenue & Volume, By Fitment Type, 2021-2026 ($)
Table 32: North America Parking Sensors Market, Revenue & Volume, By Technology, 2021-2026 ($)
Table 33: South america Parking Sensors Market, Revenue & Volume, By Fitment Type, 2021-2026 ($)
Table 34: South america Parking Sensors Market, Revenue & Volume, By Technology, 2021-2026 ($)
Table 35: Europe Parking Sensors Market, Revenue & Volume, By Fitment Type, 2021-2026 ($)
Table 36: Europe Parking Sensors Market, Revenue & Volume, By Technology, 2021-2026 ($)
Table 37: APAC Parking Sensors Market, Revenue & Volume, By Fitment Type, 2021-2026 ($)
Table 38: APAC Parking Sensors Market, Revenue & Volume, By Technology, 2021-2026 ($)
Table 39: Middle East & Africa Parking Sensors Market, Revenue & Volume, By Fitment Type, 2021-2026 ($)
Table 40: Middle East & Africa Parking Sensors Market, Revenue & Volume, By Technology, 2021-2026 ($)
Table 41: Russia Parking Sensors Market, Revenue & Volume, By Fitment Type, 2021-2026 ($)
Table 42: Russia Parking Sensors Market, Revenue & Volume, By Technology, 2021-2026 ($)
Table 43: Israel Parking Sensors Market, Revenue & Volume, By Fitment Type, 2021-2026 ($)
Table 44: Israel Parking Sensors Market, Revenue & Volume, By Technology, 2021-2026 ($)
Table 45: Top Companies 2018 (US$)Parking Sensors Market, Revenue & Volume
Table 46: Product Launch 2018-2019Parking Sensors Market, Revenue & Volume
Table 47: Mergers & Acquistions 2018-2019Parking Sensors Market, Revenue & Volume
List of Figures
Figure 1: Overview of Parking Sensors Market 2021-2026
Figure 2: Market Share Analysis for Parking Sensors Market 2018 (US$)
Figure 3: Product Comparison in Parking Sensors Market 2018-2019 (US$)
Figure 4: End User Profile for Parking Sensors Market 2018-2019 (US$)
Figure 5: Patent Application and Grant in Parking Sensors Market 2013-2018* (US$)
Figure 6: Top 5 Companies Financial Analysis in Parking Sensors Market 2018-2019 (US$)
Figure 7: Market Entry Strategy in Parking Sensors Market 2018-2019
Figure 8: Ecosystem Analysis in Parking Sensors Market 2018
Figure 9: Average Selling Price in Parking Sensors Market 2021-2026
Figure 10: Top Opportunites in Parking Sensors Market 2018-2019
Figure 11: Market Life Cycle Analysis in Parking Sensors Market
Figure 12: GlobalBy Fitment TypeParking Sensors Market Revenue, 2021-2026 ($)
Figure 13: GlobalBy TechnologyParking Sensors Market Revenue, 2021-2026 ($)
Figure 14: Global Parking Sensors Market - By Geography
Figure 15: Global Parking Sensors Market Value & Volume, By Geography, 2021-2026 ($)
Figure 16: Global Parking Sensors Market CAGR, By Geography, 2021-2026 (%)
Figure 17: North America Parking Sensors Market Value & Volume, 2021-2026 ($)
Figure 18: US Parking Sensors Market Value & Volume, 2021-2026 ($)
Figure 19: US GDP and Population, 2018-2019 ($)
Figure 20: US GDP – Composition of 2018, By Sector of Origin
Figure 21: US Export and Import Value & Volume, 2018-2019 ($)
Figure 22: Canada Parking Sensors Market Value & Volume, 2021-2026 ($)
Figure 23: Canada GDP and Population, 2018-2019 ($)
Figure 24: Canada GDP – Composition of 2018, By Sector of Origin
Figure 25: Canada Export and Import Value & Volume, 2018-2019 ($)
Figure 26: Mexico Parking Sensors Market Value & Volume, 2021-2026 ($)
Figure 27: Mexico GDP and Population, 2018-2019 ($)
Figure 28: Mexico GDP – Composition of 2018, By Sector of Origin
Figure 29: Mexico Export and Import Value & Volume, 2018-2019 ($)
Figure 30: South America Parking Sensors Market Value & Volume, 2021-2026 ($)
Figure 31: Brazil Parking Sensors Market Value & Volume, 2021-2026 ($)
Figure 32: Brazil GDP and Population, 2018-2019 ($)
Figure 33: Brazil GDP – Composition of 2018, By Sector of Origin
Figure 34: Brazil Export and Import Value & Volume, 2018-2019 ($)
Figure 35: Venezuela Parking Sensors Market Value & Volume, 2021-2026 ($)
Figure 36: Venezuela GDP and Population, 2018-2019 ($)
Figure 37: Venezuela GDP – Composition of 2018, By Sector of Origin
Figure 38: Venezuela Export and Import Value & Volume, 2018-2019 ($)
Figure 39: Argentina Parking Sensors Market Value & Volume, 2021-2026 ($)
Figure 40: Argentina GDP and Population, 2018-2019 ($)
Figure 41: Argentina GDP – Composition of 2018, By Sector of Origin
Figure 42: Argentina Export and Import Value & Volume, 2018-2019 ($)
Figure 43: Ecuador Parking Sensors Market Value & Volume, 2021-2026 ($)
Figure 44: Ecuador GDP and Population, 2018-2019 ($)
Figure 45: Ecuador GDP – Composition of 2018, By Sector of Origin
Figure 46: Ecuador Export and Import Value & Volume, 2018-2019 ($)
Figure 47: Peru Parking Sensors Market Value & Volume, 2021-2026 ($)
Figure 48: Peru GDP and Population, 2018-2019 ($)
Figure 49: Peru GDP – Composition of 2018, By Sector of Origin
Figure 50: Peru Export and Import Value & Volume, 2018-2019 ($)
Figure 51: Colombia Parking Sensors Market Value & Volume, 2021-2026 ($)
Figure 52: Colombia GDP and Population, 2018-2019 ($)
Figure 53: Colombia GDP – Composition of 2018, By Sector of Origin
Figure 54: Colombia Export and Import Value & Volume, 2018-2019 ($)
Figure 55: Costa Rica Parking Sensors Market Value & Volume, 2021-2026 ($)
Figure 56: Costa Rica GDP and Population, 2018-2019 ($)
Figure 57: Costa Rica GDP – Composition of 2018, By Sector of Origin
Figure 58: Costa Rica Export and Import Value & Volume, 2018-2019 ($)
Figure 59: Europe Parking Sensors Market Value & Volume, 2021-2026 ($)
Figure 60: U.K Parking Sensors Market Value & Volume, 2021-2026 ($)
Figure 61: U.K GDP and Population, 2018-2019 ($)
Figure 62: U.K GDP – Composition of 2018, By Sector of Origin
Figure 63: U.K Export and Import Value & Volume, 2018-2019 ($)
Figure 64: Germany Parking Sensors Market Value & Volume, 2021-2026 ($)
Figure 65: Germany GDP and Population, 2018-2019 ($)
Figure 66: Germany GDP – Composition of 2018, By Sector of Origin
Figure 67: Germany Export and Import Value & Volume, 2018-2019 ($)
Figure 68: Italy Parking Sensors Market Value & Volume, 2021-2026 ($)
Figure 69: Italy GDP and Population, 2018-2019 ($)
Figure 70: Italy GDP – Composition of 2018, By Sector of Origin
Figure 71: Italy Export and Import Value & Volume, 2018-2019 ($)
Figure 72: France Parking Sensors Market Value & Volume, 2021-2026 ($)
Figure 73: France GDP and Population, 2018-2019 ($)
Figure 74: France GDP – Composition of 2018, By Sector of Origin
Figure 75: France Export and Import Value & Volume, 2018-2019 ($)
Figure 76: Netherlands Parking Sensors Market Value & Volume, 2021-2026 ($)
Figure 77: Netherlands GDP and Population, 2018-2019 ($)
Figure 78: Netherlands GDP – Composition of 2018, By Sector of Origin
Figure 79: Netherlands Export and Import Value & Volume, 2018-2019 ($)
Figure 80: Belgium Parking Sensors Market Value & Volume, 2021-2026 ($)
Figure 81: Belgium GDP and Population, 2018-2019 ($)
Figure 82: Belgium GDP – Composition of 2018, By Sector of Origin
Figure 83: Belgium Export and Import Value & Volume, 2018-2019 ($)
Figure 84: Spain Parking Sensors Market Value & Volume, 2021-2026 ($)
Figure 85: Spain GDP and Population, 2018-2019 ($)
Figure 86: Spain GDP – Composition of 2018, By Sector of Origin
Figure 87: Spain Export and Import Value & Volume, 2018-2019 ($)
Figure 88: Denmark Parking Sensors Market Value & Volume, 2021-2026 ($)
Figure 89: Denmark GDP and Population, 2018-2019 ($)
Figure 90: Denmark GDP – Composition of 2018, By Sector of Origin
Figure 91: Denmark Export and Import Value & Volume, 2018-2019 ($)
Figure 92: APAC Parking Sensors Market Value & Volume, 2021-2026 ($)
Figure 93: China Parking Sensors Market Value & Volume, 2021-2026
Figure 94: China GDP and Population, 2018-2019 ($)
Figure 95: China GDP – Composition of 2018, By Sector of Origin
Figure 96: China Export and Import Value & Volume, 2018-2019 ($)Parking Sensors Market China Export and Import Value & Volume, 2018-2019 ($)
Figure 97: Australia Parking Sensors Market Value & Volume, 2021-2026 ($)
Figure 98: Australia GDP and Population, 2018-2019 ($)
Figure 99: Australia GDP – Composition of 2018, By Sector of Origin
Figure 100: Australia Export and Import Value & Volume, 2018-2019 ($)
Figure 101: South Korea Parking Sensors Market Value & Volume, 2021-2026 ($)
Figure 102: South Korea GDP and Population, 2018-2019 ($)
Figure 103: South Korea GDP – Composition of 2018, By Sector of Origin
Figure 104: South Korea Export and Import Value & Volume, 2018-2019 ($)
Figure 105: India Parking Sensors Market Value & Volume, 2021-2026 ($)
Figure 106: India GDP and Population, 2018-2019 ($)
Figure 107: India GDP – Composition of 2018, By Sector of Origin
Figure 108: India Export and Import Value & Volume, 2018-2019 ($)
Figure 109: Taiwan Parking Sensors Market Value & Volume, 2021-2026 ($)
Figure 110: Taiwan GDP and Population, 2018-2019 ($)
Figure 111: Taiwan GDP – Composition of 2018, By Sector of Origin
Figure 112: Taiwan Export and Import Value & Volume, 2018-2019 ($)
Figure 113: Malaysia Parking Sensors Market Value & Volume, 2021-2026 ($)
Figure 114: Malaysia GDP and Population, 2018-2019 ($)
Figure 115: Malaysia GDP – Composition of 2018, By Sector of Origin
Figure 116: Malaysia Export and Import Value & Volume, 2018-2019 ($)
Figure 117: Hong Kong Parking Sensors Market Value & Volume, 2021-2026 ($)
Figure 118: Hong Kong GDP and Population, 2018-2019 ($)
Figure 119: Hong Kong GDP – Composition of 2018, By Sector of Origin
Figure 120: Hong Kong Export and Import Value & Volume, 2018-2019 ($)
Figure 121: Middle East & Africa Parking Sensors Market Middle East & Africa 3D Printing Market Value & Volume, 2021-2026 ($)
Figure 122: Russia Parking Sensors Market Value & Volume, 2021-2026 ($)
Figure 123: Russia GDP and Population, 2018-2019 ($)
Figure 124: Russia GDP – Composition of 2018, By Sector of Origin
Figure 125: Russia Export and Import Value & Volume, 2018-2019 ($)
Figure 126: Israel Parking Sensors Market Value & Volume, 2021-2026 ($)
Figure 127: Israel GDP and Population, 2018-2019 ($)
Figure 128: Israel GDP – Composition of 2018, By Sector of Origin
Figure 129: Israel Export and Import Value & Volume, 2018-2019 ($)
Figure 130: Entropy Share, By Strategies, 2018-2019* (%)Parking Sensors Market
Figure 131: Developments, 2018-2019*Parking Sensors Market
Figure 132: Company 1 Parking Sensors Market Net Revenue, By Years, 2018-2019* ($)
Figure 133: Company 1 Parking Sensors Market Net Revenue Share, By Business segments, 2018 (%)
Figure 134: Company 1 Parking Sensors Market Net Sales Share, By Geography, 2018 (%)
Figure 135: Company 2 Parking Sensors Market Net Revenue, By Years, 2018-2019* ($)
Figure 136: Company 2 Parking Sensors Market Net Revenue Share, By Business segments, 2018 (%)
Figure 137: Company 2 Parking Sensors Market Net Sales Share, By Geography, 2018 (%)
Figure 138: Company 3 Parking Sensors Market Net Revenue, By Years, 2018-2019* ($)
Figure 139: Company 3 Parking Sensors Market Net Revenue Share, By Business segments, 2018 (%)
Figure 140: Company 3 Parking Sensors Market Net Sales Share, By Geography, 2018 (%)
Figure 141: Company 4 Parking Sensors Market Net Revenue, By Years, 2018-2019* ($)
Figure 142: Company 4 Parking Sensors Market Net Revenue Share, By Business segments, 2018 (%)
Figure 143: Company 4 Parking Sensors Market Net Sales Share, By Geography, 2018 (%)
Figure 144: Company 5 Parking Sensors Market Net Revenue, By Years, 2018-2019* ($)
Figure 145: Company 5 Parking Sensors Market Net Revenue Share, By Business segments, 2018 (%)
Figure 146: Company 5 Parking Sensors Market Net Sales Share, By Geography, 2018 (%)
Figure 147: Company 6 Parking Sensors Market Net Revenue, By Years, 2018-2019* ($)
Figure 148: Company 6 Parking Sensors Market Net Revenue Share, By Business segments, 2018 (%)
Figure 149: Company 6 Parking Sensors Market Net Sales Share, By Geography, 2018 (%)
Figure 150: Company 7 Parking Sensors Market Net Revenue, By Years, 2018-2019* ($)
Figure 151: Company 7 Parking Sensors Market Net Revenue Share, By Business segments, 2018 (%)
Figure 152: Company 7 Parking Sensors Market Net Sales Share, By Geography, 2018 (%)
Figure 153: Company 8 Parking Sensors Market Net Revenue, By Years, 2018-2019* ($)
Figure 154: Company 8 Parking Sensors Market Net Revenue Share, By Business segments, 2018 (%)
Figure 155: Company 8 Parking Sensors Market Net Sales Share, By Geography, 2018 (%)
Figure 156: Company 9 Parking Sensors Market Net Revenue, By Years, 2018-2019* ($)
Figure 157: Company 9 Parking Sensors Market Net Revenue Share, By Business segments, 2018 (%)
Figure 158: Company 9 Parking Sensors Market Net Sales Share, By Geography, 2018 (%)
Figure 159: Company 10 Parking Sensors Market Net Revenue, By Years, 2018-2019* ($)
Figure 160: Company 10 Parking Sensors Market Net Revenue Share, By Business segments, 2018 (%)
Figure 161: Company 10 Parking Sensors Market Net Sales Share, By Geography, 2018 (%)
Figure 162: Company 11 Parking Sensors Market Net Revenue, By Years, 2018-2019* ($)
Figure 163: Company 11 Parking Sensors Market Net Revenue Share, By Business segments, 2018 (%)
Figure 164: Company 11 Parking Sensors Market Net Sales Share, By Geography, 2018 (%)
Figure 165: Company 12 Parking Sensors Market Net Revenue, By Years, 2018-2019* ($)
Figure 166: Company 12 Parking Sensors Market Net Revenue Share, By Business segments, 2018 (%)
Figure 167: Company 12 Parking Sensors Market Net Sales Share, By Geography, 2018 (%)
Figure 168: Company 13 Parking Sensors Market Net Revenue, By Years, 2018-2019* ($)
Figure 169: Company 13 Parking Sensors Market Net Revenue Share, By Business segments, 2018 (%)
Figure 170: Company 13 Parking Sensors Market Net Sales Share, By Geography, 2018 (%)
Figure 171: Company 14 Parking Sensors Market Net Revenue, By Years, 2018-2019* ($)
Figure 172: Company 14 Parking Sensors Market Net Revenue Share, By Business segments, 2018 (%)
Figure 173: Company 14 Parking Sensors Market Net Sales Share, By Geography, 2018 (%)
Figure 174: Company 15 Parking Sensors Market Net Revenue, By Years, 2018-2019* ($)
Figure 175: Company 15 Parking Sensors Market Net Revenue Share, By Business segments, 2018 (%)
Figure 176: Company 15 Parking Sensors Market Net Sales Share, By Geography, 2018 (%)