 Email
Email Print
Print


Ethylene Dichloride Market Overview:
The Ethylene Dichloride Market size is forecast to reach $28.78 Billion by 2030, after growing at a CAGR of 3.7% during 2024-2030. This growth is driven by the versatile applications of ethylene dichloride (EDC) are driving significant market growth as it finds increasing usage in the production of industrial and consumer goods. Its diverse applications span multiple industries, including plastics, textiles, pharmaceuticals, and automotive, among others. EDC serves as a crucial raw material in the manufacturing of various products, reflecting its adaptability to meet evolving industry needs. This trend underscores the integral role of EDC in fulfilling diverse market demands and highlights its importance as a versatile chemical in driving market expansion.
Additionally, the ethylene dichloride (EDC) industry is increasingly prioritizing sustainability and eco-friendly production methods. Research and development efforts are directed towards exploring alternative raw materials and innovative manufacturing processes. This trend reflects the industry's commitment to reducing environmental impact, minimizing waste generation, and meeting regulatory requirements. By embracing sustainable practices and adopting greener technologies, EDC manufacturers aim to enhance operational efficiency, improve product quality, and align with evolving consumer preferences for environmentally responsible products. Such initiatives underscore the industry's proactive approach toward sustainability and its role in driving positive change in the ethylene dichloride market.
Ethylene Dichloride Market - Report Coverage:
The “Ethylene Dichloride Market Report - Forecast (2024-2030)” by IndustryARC, covers an in-depth analysis of the following segments in the Ethylene Dichloride Market.
By Production Process: Direct Chlorination and Oxy Chlorination.
By Application: Vinyl Chloride Monomers, Ethylene Amines, Chlorinated Solvents, Degreasers, Paint Remover, Rubber & Plastics and Others.
By End Use Industry: Automotive (Passenger Vehicles (PVs), Light Commercial Vehicles (LCVs) and Heavy Commercial Vehicles (HCVs)), Building & Construction (Residential, Commercial, Industrial, and Infrastructural), Electrical & Electronics, Oil & Gas (Onshore and Offshore), Medical & Pharmaceuticals, Packaging (Rigid and Flexible), Textiles and Others.
By Geography: North America, South America, Europe, APAC, and RoW.

COVID-19 / Ukraine Crisis - Impact Analysis:
• The COVID-19 pandemic has had a mixed impact on the ethylene dichloride (EDC) market. While initial disruptions in global supply chains and manufacturing activities led to a temporary decline in demand for EDC, the subsequent recovery witnessed a resurgence in demand driven by the gradual reopening of economies and resumption of construction and manufacturing activities. Additionally, the heightened focus on sanitation and hygiene amid the pandemic has bolstered the demand for PVC, a key end-use application of EDC in pipes, packaging, and medical devices. Overall, the pandemic has underscored the resilience of the EDC market, with demand rebounding as economic activities gradually normalize.
• The Russia-Ukraine crisis impacts the ethylene dichloride (EDC) market due to potential disruptions in the supply chain for raw materials such as ethylene and chlorine, essential for EDC production. Both Russia and Ukraine are significant producers of these chemicals. Any supply disruptions could lead to shortages and price volatility, affecting EDC manufacturers and downstream industries reliant on EDC-derived products like polyvinyl chloride (PVC). Geopolitical tensions may also create uncertainty in international trade, influencing market sentiment and investment decisions. Consequently, mitigating geopolitical risks and diversifying supply chains becomes crucial for ensuring stability in the EDC market.
Key Takeaways:
• Asia Pacific is experiencing rapid growth as the highest growing geographic market in the ethylene dichloride (EDC). This growth is propelled by increasing industrialization, urbanization, and construction activities in countries like China and India, driving demand for EDC-derived products such as polyvinyl chloride (PVC).
• Direct chlorination is the fastest-growing production process in the ethylene dichloride (EDC) market. It involves the reaction of ethylene with chlorine gas in the presence of a catalyst to produce EDC. This method offers high yields, cost-effectiveness, and flexibility in feedstock selection, driving its prominence in the industry.
• Vinyl chloride monomer (VCM) emerges as the highest-growing application in the ethylene dichloride market. VCM, derived from ethylene dichloride, is used predominantly in the production of polyvinyl chloride (PVC), a versatile thermoplastic experiencing increasing demand in the construction, automotive, and packaging industries, driving growth in the EDC market.
• The building and construction sector is the fastest-growing end user in the ethylene dichloride (EDC) market. EDC is a key ingredient in the production of polyvinyl chloride (PVC), widely used in construction materials such as pipes, windows, flooring, and insulation, driven by urbanization and infrastructure development.
Ethylene Dichloride Market Segment Analysis – By Production Process
Direct chlorination is the highest-growing production process in the ethylene dichloride (EDC) market with a market share of 61.2% in 2023. This method involves the direct reaction of ethylene with chlorine gas in the presence of a catalyst, typically ferric chloride or cupric chloride, to yield EDC. Its popularity stems from several factors. Firstly, the direct chlorination process offers high yields and relatively low production costs compared to alternative methods like oxychlorination or ethylene oxidation. Secondly, it provides flexibility in feedstock selection, allowing ethylene sourced from various inputs such as ethane, propane, or naphtha, ensuring consistent supply and market competitiveness. Additionally, the direct chlorination process is well-established and widely utilized across the industry, with proven efficiency and reliability. As the demand for EDC continues to grow, fuelled by increasing PVC production for various applications, the direct chlorination process is poised to maintain its prominence and drive further expansion in the EDC market.
Ethylene Dichloride Market Segment Analysis – By Application
Vinyl chloride monomer (VCM) emerges as the highest-growing application with a CAGR of 4.2% in the ethylene dichloride (EDC) market due to its pivotal role in the production of polyvinyl chloride (PVC). As demand for PVC continues to surge across various sectors such as construction, automotive, and packaging, the need for VCM as a precursor intensifies. EDC serves as a crucial raw material in the synthesis of VCM through a process called oxychlorination. The expanding construction industry, driven by infrastructure development and urbanization, fuels the demand for PVC-based products like pipes, fittings, and profiles, propelling the growth of VCM consumption. Moreover, PVC's versatility, cost-effectiveness, and durability contribute to its widespread adoption in various applications. As a result, the increasing demand for PVC drives the growth of VCM production, making it the highest-growing application segment in the ethylene dichloride market.
Ethylene Dichloride Market Segment Analysis – By End Use Industry
The building and construction sector emerges as the highest-growing end user in the ethylene dichloride (EDC) market. EDC is a key precursor in the production of polyvinyl chloride (PVC), a versatile polymer widely used in construction materials such as pipes, fittings, windows, doors, flooring, and insulation. With rapid urbanization, infrastructure development, and construction activities worldwide, the demand for PVC-based products is surging. The inherent properties of PVC, including durability, versatility, and cost-effectiveness, make it a preferred choice in various construction applications. Additionally, stringent building regulations emphasizing energy efficiency and sustainability drive the adoption of PVC-based building materials. As a result, the building and construction industry plays a pivotal role in propelling the growth of the EDC market, creating significant opportunities for EDC manufacturers and suppliers catering to the evolving needs of the construction sector.
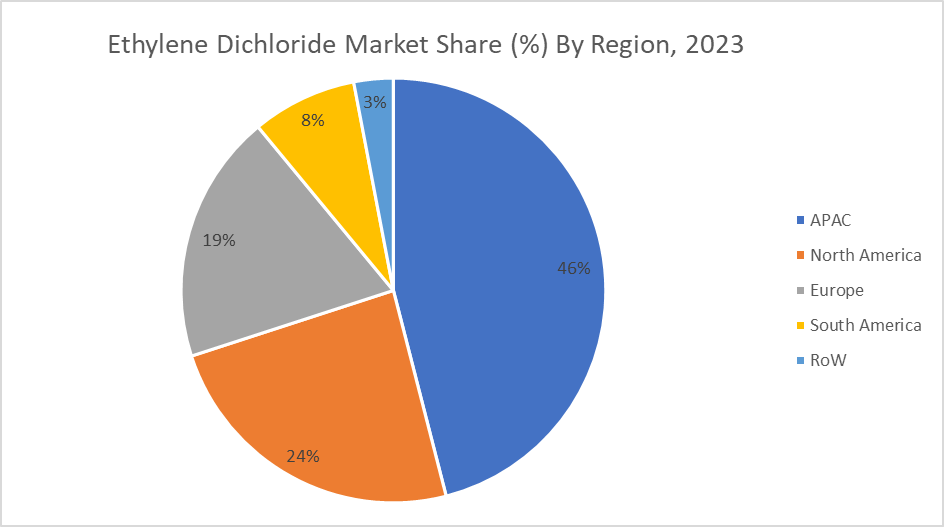
Ethylene Dichloride Market Segment Analysis – By Geography
Asia Pacific emerges as the highest-growing geographic market in the ethylene dichloride (EDC) with a CAGR of 4.8% during forecast period 2024-2030. Rapid industrialization, urbanization, and infrastructure development in countries like China, India, and Southeast Asian nations drive the demand for EDC, a key raw material in the production of polyvinyl chloride (PVC). The construction sector, in particular, fuels the growth of EDC consumption in Asia Pacific, as PVC finds extensive applications in pipes, profiles, and fittings. Moreover, the region's expanding automotive, packaging, and consumer goods industries further contribute to the rising demand for PVC and, consequently, EDC. Additionally, supportive government policies promoting industrialization, coupled with a favorable investment climate and increasing investments in chemical manufacturing infrastructure, bolster the growth of the EDC market in Asia Pacific. As a result, Asia Pacific continues to represent a lucrative market opportunity for EDC manufacturers and suppliers looking to capitalize on the region's dynamic growth prospects.
For More Details on This Report - Request for Sample
Ethylene Dichloride Market Drivers
Bolstering Growth of Automotive Industry
The automotive industry's burgeoning growth serves as a prominent market driver in the ethylene dichloride (EDC) market. EDC is a vital component in the production of polyvinyl chloride (PVC), which finds extensive application in automotive interiors, wiring harnesses, piping, and sealants. As the automotive sector experiences robust expansion driven by rising consumer demand, technological advancements, and regulatory requirements for lightweight and durable materials, the demand for PVC, and consequently EDC, is escalating. Moreover, the increasing adoption of electric vehicles (EVs) further amplifies the need for PVC-based components in battery enclosures and insulation materials. Consequently, the automotive industry's sustained growth fuels the demand for EDC, propelling market growth and prompting manufacturers to expand production capacities to meet the evolving needs of the automotive sector.
Flourishing Growth of the Oil & Gas Sector
The flourishing growth of the oil and gas sector serves as a significant market driver in the ethylene dichloride (EDC) market. EDC is a key intermediate chemical derived from ethylene, which is primarily obtained through the cracking of ethane, a natural gas derivative, or naphtha, a crude oil derivative. As the demand for oil and gas products continues to rise globally, driven by industrialization, urbanization, and transportation needs, the production of ethylene, and subsequently EDC, experiences a corresponding increase. EDC is a crucial raw material in the manufacturing of polyvinyl chloride (PVC), a widely used thermoplastic in the construction, automotive, and packaging industries. Therefore, the growth trajectory of the oil and gas sector directly influences the demand for EDC, making it intricately linked to the overall expansion of the ethylene dichloride market.
Ethylene Dichloride Market Challenges
Adverse Hazards of Ethylene Dichloride
Adverse hazards associated with ethylene dichloride (EDC) pose significant challenges in the ethylene dichloride market. EDC is classified as a hazardous chemical with potential health risks, including skin and eye irritation, respiratory issues, and long-term exposure effects such as liver and kidney damage. Moreover, EDC is flammable and can release toxic fumes when exposed to high temperatures, posing fire and explosion hazards in industrial settings. Environmental concerns arise from EDC's toxicity and potential for groundwater contamination, especially during storage, transportation, and accidental spills. Regulatory compliance and safety protocols are stringent, requiring companies to invest in robust safety measures, employee training, and environmental protection initiatives. Mitigating these hazards through proper handling, storage, and disposal practices is essential to ensure worker safety, minimize environmental impact, and maintain public health, thus presenting a significant challenge for stakeholders in the ethylene dichloride market.
Market Landscape
Product/Service launches, approvals, patents and events, acquisitions, partnerships and collaborations are key strategies adopted by players in the Ethylene Dichloride Market. The top 10 companies in this industry are: Dow Inc., Formosa Plastics Corporation, Occidental Petroleum Corporation, BASF SE, Westlake Chemical Corporation, Tosoh Corporation, INEOS Group Holdings S.A., Olin Corporation, Reliance Industries Limited, Vinythai Public Company Limited
Developments:
Dow INC., In March 2023, launched a new digital platform, DOW Paint Vision, to streamline paint formulation in Asia Pacific. Last year, they showcased advancements in material science for electric vehicles and sustainable data center cooling with DOWSIL immersion technology in September 2022. They also unveiled bio-based ingredients for cosmetics in April 2022.
BASF continues to focus on innovation in agriculture. In 2023, they launched Liberty® ULTRA herbicide, a new seed treatment (Poncho® Votivo® Precise), and a new seed variety placement technology (xarvio® SeedSelect). They're also developing digital farming solutions through their joint venture with Bosch (ONE SMART SPRAY) and improving their digital agronomic advice offerings.
For more Chemicals and Materials Market reports, please click here
1. Ethylene Dichloride Market - Market Overview
1.1 Definitions and Scope
2. Ethylene Dichloride Market - Executive Summary
2.1 Key Trends by Production Process
2.2 Key Trends by Application
2.3 Key Trends by End-use Industry
2.4 Key Trends by Geography
3. Ethylene Dichloride Market – Comparative analysis
3.1 Market Share Analysis - Major Companies
3.2 Product Benchmarking - Major Companies
3.3 Top 5 Financials Analysis
3.4 Patent Analysis - Major Companies
3.5 Pricing Analysis (ASPs will be provided)
4. Ethylene Dichloride Market - Startup companies Scenario Premium Premium
4.1 Major startup company analysis:
4.1.1 Investment
4.1.2 Revenue
4.1.3 Product portfolio
4.1.4 Venture Capital and Funding Scenario
5. Ethylene Dichloride Market – Industry Market Entry Scenario Premium Premium
5.1 Regulatory Framework Overview
5.2 New Business and Ease of Doing Business Index
5.3 Successful Venture Profiles
5.4 Customer Analysis – Major companies
6. Ethylene Dichloride Market - Market Forces
6.1 Market Drivers
6.2 Market Constraints
6.3 Porter's Five Force Model
6.3.1 Bargaining Power of Suppliers
6.3.2 Bargaining Powers of Buyers
6.3.3 Threat of New Entrants
6.3.4 Competitive Rivalry
6.3.5 Threat of Substitutes
7. Ethylene Dichloride Market – Strategic Analysis
7.1 Value/Supply Chain Analysis
7.2 Opportunity Analysis
7.3 Product/Market Life Cycle
7.4 Distributor Analysis – Major Companies
8. Ethylene Dichloride Market – by Production Process (Market size – US$ Million/Billion)
8.1 Direct Chlorination
8.2 Oxy Chlorination
9. Ethylene Dichloride Market - by Application (Market Size - US$ Million/Billion)
9.1 Vinyl Chloride Monomers
9.2 Ethylene Amines
9.3 Chlorinated Solvents
9.4 Degreaser
9.5 Paint Remover
9.6 Rubber & Plastics
9.7 Others
10. Ethylene Dichloride Market - by End-use Industry (Market Size - US$ Million/Billion)
10.1 Automotive
10.1.1 Passenger Vehicles (PVs)
10.1.2 Light Commercial Vehicles (LCVs)
10.1.3 Heavy Commercial Vehicles (HCVs)
10.2 Building & Construction
10.2.1 Residential
10.2.2 Commercial
10.2.3 Industrial
10.2.4 Infrastructural
10.3 Electrical & Electronics
10.4 Oil & Gas
10.4.1 Onshore
10.4.2 Offshore
10.5 Medical & Pharmaceuticals
10.6 Packaging
10.6.1 Rigid
10.6.2 Flexible
10.7 Textiles
10.8 Others
11. Ethylene Dichloride Market - by Geography (Market Size - US$ Million/Billion)
11.1 North America
11.1.1 the USA
11.1.2 Canada
11.1.3 Mexico
11.2 Europe
11.2.1 the UK
11.2.2 Germany
11.2.3 France
11.2.4 Italy
11.2.5 the Netherlands
11.2.6 Spain
11.2.7 Belgium
11.2.8 Rest of Europe
11.3 Asia-Pacific
11.3.1 China
11.3.2 Japan
11.3.3 India
11.3.4 South Korea
11.3.5 Australia and New Zeeland
11.3.6 Indonesia
11.3.7 Taiwan
11.3.8 Malaysia
11.3.9 Rest of APAC
11.4 South America
11.4.1 Brazil
11.4.2 Argentina
11.4.3 Colombia
11.4.4 Chile
11.4.5 Rest of South America
11.5 Rest of the World
11.5.1 Middle-East
11.5.1.1 Saudi Arabia
11.5.1.2 UAE
11.5.1.3 Israel
11.5.1.4 Rest of the Middle-East
11.5.2 Africa
11.5.2.1 South Africa
11.5.2.2 Nigeria
11.5.2.3 Rest of Africa
12. Ethylene Dichloride Market – Entropy
12.1 New Product Launches
12.2 M&As, Collaborations, JVs and Partnerships
13. Ethylene Dichloride Market – Industry/Competition Segment Analysis Premium
13.1 Company Benchmarking Matrix – Major Companies
13.2 Market Share at Global Level - Major companies
13.3 Market Share by Key Region - Major companies
13.4 Market Share by Key Country - Major companies
13.5 Market Share by Key Application - Major companies
13.6 Market Share by Key Product Type/Product category - Major companies
14. Ethylene Dichloride Market – Key Company List by Country Premium Premium
15. Ethylene Dichloride Market Company Analysis - Business Overview, Product Portfolio, Financials and Developments
15.1 Dow Inc.
15.2 Formosa Plastics Corporation
15.3 Occidental Petroleum Corporation
15.4 BASF SE
15.5 Westlake Chemical Corporation
15.6 Tosoh Corporation
15.7 INEOS Group Holdings S.A.
15.8 Olin Corporation
15.9 Reliance Industries Limited
15.10 Vinythai Public Company Limited
* "Financials would be provided to private companies on best-efforts basis."
Connect with our experts to get customized reports that best suit your requirements. Our reports include global-level data, niche markets and competitive landscape.
List of Tables:
Table 1: Ethylene Dichloride Market Overview 2021-2026
Table 2: Ethylene Dichloride Market Leader Analysis 2018-2019 (US$)
Table 3: Ethylene Dichloride Market Product Analysis 2018-2019 (US$)
Table 4: Ethylene Dichloride Market End User Analysis 2018-2019 (US$)
Table 5: Ethylene Dichloride Market Patent Analysis 2013-2018* (US$)
Table 6: Ethylene Dichloride Market Financial Analysis 2018-2019 (US$)
Table 7: Ethylene Dichloride Market Driver Analysis 2018-2019 (US$)
Table 8: Ethylene Dichloride Market Challenges Analysis 2018-2019 (US$)
Table 9: Ethylene Dichloride Market Constraint Analysis 2018-2019 (US$)
Table 10: Ethylene Dichloride Market Supplier Bargaining Power Analysis 2018-2019 (US$)
Table 11: Ethylene Dichloride Market Buyer Bargaining Power Analysis 2018-2019 (US$)
Table 12: Ethylene Dichloride Market Threat of Substitutes Analysis 2018-2019 (US$)
Table 13: Ethylene Dichloride Market Threat of New Entrants Analysis 2018-2019 (US$)
Table 14: Ethylene Dichloride Market Degree of Competition Analysis 2018-2019 (US$)
Table 15: Ethylene Dichloride Market Value Chain Analysis 2018-2019 (US$)
Table 16: Ethylene Dichloride Market Pricing Analysis 2021-2026 (US$)
Table 17: Ethylene Dichloride Market Opportunities Analysis 2021-2026 (US$)
Table 18: Ethylene Dichloride Market Product Life Cycle Analysis 2021-2026 (US$)
Table 19: Ethylene Dichloride Market Supplier Analysis 2018-2019 (US$)
Table 20: Ethylene Dichloride Market Distributor Analysis 2018-2019 (US$)
Table 21: Ethylene Dichloride Market Trend Analysis 2018-2019 (US$)
Table 22: Ethylene Dichloride Market Size 2018 (US$)
Table 23: Ethylene Dichloride Market Forecast Analysis 2021-2026 (US$)
Table 24: Ethylene Dichloride Market Sales Forecast Analysis 2021-2026 (Units)
Table 25: Ethylene Dichloride Market, Revenue & Volume, By Raw Material, 2021-2026 ($)
Table 26: Ethylene Dichloride Market By Raw Material, Revenue & Volume, By Ethylene, 2021-2026 ($)
Table 27: Ethylene Dichloride Market By Raw Material, Revenue & Volume, By Chlorine, 2021-2026 ($)
Table 28: Ethylene Dichloride Market, Revenue & Volume, By Application, 2021-2026 ($)
Table 29: Ethylene Dichloride Market By Application, Revenue & Volume, By Vinyl Chloride Monomer, 2021-2026 ($)
Table 30: Ethylene Dichloride Market By Application, Revenue & Volume, By Tetra Ethylene Pentamine, 2021-2026 ($)
Table 31: North America Ethylene Dichloride Market, Revenue & Volume, By Raw Material, 2021-2026 ($)
Table 32: North America Ethylene Dichloride Market, Revenue & Volume, By Application, 2021-2026 ($)
Table 33: South america Ethylene Dichloride Market, Revenue & Volume, By Raw Material, 2021-2026 ($)
Table 34: South america Ethylene Dichloride Market, Revenue & Volume, By Application, 2021-2026 ($)
Table 35: Europe Ethylene Dichloride Market, Revenue & Volume, By Raw Material, 2021-2026 ($)
Table 36: Europe Ethylene Dichloride Market, Revenue & Volume, By Application, 2021-2026 ($)
Table 37: APAC Ethylene Dichloride Market, Revenue & Volume, By Raw Material, 2021-2026 ($)
Table 38: APAC Ethylene Dichloride Market, Revenue & Volume, By Application, 2021-2026 ($)
Table 39: Middle East & Africa Ethylene Dichloride Market, Revenue & Volume, By Raw Material, 2021-2026 ($)
Table 40: Middle East & Africa Ethylene Dichloride Market, Revenue & Volume, By Application, 2021-2026 ($)
Table 41: Russia Ethylene Dichloride Market, Revenue & Volume, By Raw Material, 2021-2026 ($)
Table 42: Russia Ethylene Dichloride Market, Revenue & Volume, By Application, 2021-2026 ($)
Table 43: Israel Ethylene Dichloride Market, Revenue & Volume, By Raw Material, 2021-2026 ($)
Table 44: Israel Ethylene Dichloride Market, Revenue & Volume, By Application, 2021-2026 ($)
Table 45: Top Companies 2018 (US$) Ethylene Dichloride Market, Revenue & Volume
Table 46: Product Launch 2018-2019 Ethylene Dichloride Market, Revenue & Volume
Table 47: Mergers & Acquistions 2018-2019 Ethylene Dichloride Market, Revenue & Volume
List of Figures:
Figure 1: Overview of Ethylene Dichloride Market 2021-2026
Figure 2: Market Share Analysis for Ethylene Dichloride Market 2018 (US$)
Figure 3: Product Comparison in Ethylene Dichloride Market 2018-2019 (US$)
Figure 4: End User Profile for Ethylene Dichloride Market 2018-2019 (US$)
Figure 5: Patent Application and Grant in Ethylene Dichloride Market 2013-2018* (US$)
Figure 6: Top 5 Companies Financial Analysis in Ethylene Dichloride Market 2018-2019 (US$)
Figure 7: Market Entry Strategy in Ethylene Dichloride Market 2018-2019
Figure 8: Ecosystem Analysis in Ethylene Dichloride Market 2018
Figure 9: Average Selling Price in Ethylene Dichloride Market 2021-2026
Figure 10: Top Opportunites in Ethylene Dichloride Market 2018-2019
Figure 11: Market Life Cycle Analysis in Ethylene Dichloride Market
Figure 12: GlobalBy Raw Material Ethylene Dichloride Market Revenue, 2021-2026 ($)
Figure 13: GlobalBy Application Ethylene Dichloride Market Revenue, 2021-2026 ($)
Figure 14: Global Ethylene Dichloride Market - By Geography
Figure 15: Global Ethylene Dichloride Market Value & Volume, By Geography, 2021-2026 ($)
Figure 16: Global Ethylene Dichloride Market CAGR, By Geography, 2021-2026 (%)
Figure 17: North America Ethylene Dichloride Market Value & Volume, 2021-2026 ($)
Figure 18: US Ethylene Dichloride Market Value & Volume, 2021-2026 ($)
Figure 19: US GDP and Population, 2018-2019 ($)
Figure 20: US GDP – Composition of 2018, By Sector of Origin
Figure 21: US Export and Import Value & Volume, 2018-2019 ($)
Figure 22: Canada Ethylene Dichloride Market Value & Volume, 2021-2026 ($)
Figure 23: Canada GDP and Population, 2018-2019 ($)
Figure 24: Canada GDP – Composition of 2018, By Sector of Origin
Figure 25: Canada Export and Import Value & Volume, 2018-2019 ($)
Figure 26: Mexico Ethylene Dichloride Market Value & Volume, 2021-2026 ($)
Figure 27: Mexico GDP and Population, 2018-2019 ($)
Figure 28: Mexico GDP – Composition of 2018, By Sector of Origin
Figure 29: Mexico Export and Import Value & Volume, 2018-2019 ($)
Figure 30: South America Ethylene Dichloride Market Value & Volume, 2021-2026 ($)
Figure 31: Brazil Ethylene Dichloride Market Value & Volume, 2021-2026 ($)
Figure 32: Brazil GDP and Population, 2018-2019 ($)
Figure 33: Brazil GDP – Composition of 2018, By Sector of Origin
Figure 34: Brazil Export and Import Value & Volume, 2018-2019 ($)
Figure 35: Venezuela Ethylene Dichloride Market Value & Volume, 2021-2026 ($)
Figure 36: Venezuela GDP and Population, 2018-2019 ($)
Figure 37: Venezuela GDP – Composition of 2018, By Sector of Origin
Figure 38: Venezuela Export and Import Value & Volume, 2018-2019 ($)
Figure 39: Argentina Ethylene Dichloride Market Value & Volume, 2021-2026 ($)
Figure 40: Argentina GDP and Population, 2018-2019 ($)
Figure 41: Argentina GDP – Composition of 2018, By Sector of Origin
Figure 42: Argentina Export and Import Value & Volume, 2018-2019 ($)
Figure 43: Ecuador Ethylene Dichloride Market Value & Volume, 2021-2026 ($)
Figure 44: Ecuador GDP and Population, 2018-2019 ($)
Figure 45: Ecuador GDP – Composition of 2018, By Sector of Origin
Figure 46: Ecuador Export and Import Value & Volume, 2018-2019 ($)
Figure 47: Peru Ethylene Dichloride Market Value & Volume, 2021-2026 ($)
Figure 48: Peru GDP and Population, 2018-2019 ($)
Figure 49: Peru GDP – Composition of 2018, By Sector of Origin
Figure 50: Peru Export and Import Value & Volume, 2018-2019 ($)
Figure 51: Colombia Ethylene Dichloride Market Value & Volume, 2021-2026 ($)
Figure 52: Colombia GDP and Population, 2018-2019 ($)
Figure 53: Colombia GDP – Composition of 2018, By Sector of Origin
Figure 54: Colombia Export and Import Value & Volume, 2018-2019 ($)
Figure 55: Costa Rica Ethylene Dichloride Market Value & Volume, 2021-2026 ($)
Figure 56: Costa Rica GDP and Population, 2018-2019 ($)
Figure 57: Costa Rica GDP – Composition of 2018, By Sector of Origin
Figure 58: Costa Rica Export and Import Value & Volume, 2018-2019 ($)
Figure 59: Europe Ethylene Dichloride Market Value & Volume, 2021-2026 ($)
Figure 60: U.K Ethylene Dichloride Market Value & Volume, 2021-2026 ($)
Figure 61: U.K GDP and Population, 2018-2019 ($)
Figure 62: U.K GDP – Composition of 2018, By Sector of Origin
Figure 63: U.K Export and Import Value & Volume, 2018-2019 ($)
Figure 64: Germany Ethylene Dichloride Market Value & Volume, 2021-2026 ($)
Figure 65: Germany GDP and Population, 2018-2019 ($)
Figure 66: Germany GDP – Composition of 2018, By Sector of Origin
Figure 67: Germany Export and Import Value & Volume, 2018-2019 ($)
Figure 68: Italy Ethylene Dichloride Market Value & Volume, 2021-2026 ($)
Figure 69: Italy GDP and Population, 2018-2019 ($)
Figure 70: Italy GDP – Composition of 2018, By Sector of Origin
Figure 71: Italy Export and Import Value & Volume, 2018-2019 ($)
Figure 72: France Ethylene Dichloride Market Value & Volume, 2021-2026 ($)
Figure 73: France GDP and Population, 2018-2019 ($)
Figure 74: France GDP – Composition of 2018, By Sector of Origin
Figure 75: France Export and Import Value & Volume, 2018-2019 ($)
Figure 76: Netherlands Ethylene Dichloride Market Value & Volume, 2021-2026 ($)
Figure 77: Netherlands GDP and Population, 2018-2019 ($)
Figure 78: Netherlands GDP – Composition of 2018, By Sector of Origin
Figure 79: Netherlands Export and Import Value & Volume, 2018-2019 ($)
Figure 80: Belgium Ethylene Dichloride Market Value & Volume, 2021-2026 ($)
Figure 81: Belgium GDP and Population, 2018-2019 ($)
Figure 82: Belgium GDP – Composition of 2018, By Sector of Origin
Figure 83: Belgium Export and Import Value & Volume, 2018-2019 ($)
Figure 84: Spain Ethylene Dichloride Market Value & Volume, 2021-2026 ($)
Figure 85: Spain GDP and Population, 2018-2019 ($)
Figure 86: Spain GDP – Composition of 2018, By Sector of Origin
Figure 87: Spain Export and Import Value & Volume, 2018-2019 ($)
Figure 88: Denmark Ethylene Dichloride Market Value & Volume, 2021-2026 ($)
Figure 89: Denmark GDP and Population, 2018-2019 ($)
Figure 90: Denmark GDP – Composition of 2018, By Sector of Origin
Figure 91: Denmark Export and Import Value & Volume, 2018-2019 ($)
Figure 92: APAC Ethylene Dichloride Market Value & Volume, 2021-2026 ($)
Figure 93: China Ethylene Dichloride Market Value & Volume, 2021-2026
Figure 94: China GDP and Population, 2018-2019 ($)
Figure 95: China GDP – Composition of 2018, By Sector of Origin
Figure 96: China Export and Import Value & Volume, 2018-2019 ($) Ethylene Dichloride Market China Export and Import Value & Volume, 2018-2019 ($)
Figure 97: Australia Ethylene Dichloride Market Value & Volume, 2021-2026 ($)
Figure 98: Australia GDP and Population, 2018-2019 ($)
Figure 99: Australia GDP – Composition of 2018, By Sector of Origin
Figure 100: Australia Export and Import Value & Volume, 2018-2019 ($)
Figure 101: South Korea Ethylene Dichloride Market Value & Volume, 2021-2026 ($)
Figure 102: South Korea GDP and Population, 2018-2019 ($)
Figure 103: South Korea GDP – Composition of 2018, By Sector of Origin
Figure 104: South Korea Export and Import Value & Volume, 2018-2019 ($)
Figure 105: India Ethylene Dichloride Market Value & Volume, 2021-2026 ($)
Figure 106: India GDP and Population, 2018-2019 ($)
Figure 107: India GDP – Composition of 2018, By Sector of Origin
Figure 108: India Export and Import Value & Volume, 2018-2019 ($)
Figure 109: Taiwan Ethylene Dichloride Market Value & Volume, 2021-2026 ($)
Figure 110: Taiwan GDP and Population, 2018-2019 ($)
Figure 111: Taiwan GDP – Composition of 2018, By Sector of Origin
Figure 112: Taiwan Export and Import Value & Volume, 2018-2019 ($)
Figure 113: Malaysia Ethylene Dichloride Market Value & Volume, 2021-2026 ($)
Figure 114: Malaysia GDP and Population, 2018-2019 ($)
Figure 115: Malaysia GDP – Composition of 2018, By Sector of Origin
Figure 116: Malaysia Export and Import Value & Volume, 2018-2019 ($)
Figure 117: Hong Kong Ethylene Dichloride Market Value & Volume, 2021-2026 ($)
Figure 118: Hong Kong GDP and Population, 2018-2019 ($)
Figure 119: Hong Kong GDP – Composition of 2018, By Sector of Origin
Figure 120: Hong Kong Export and Import Value & Volume, 2018-2019 ($)
Figure 121: Middle East & Africa Ethylene Dichloride Market Middle East & Africa 3D Printing Market Value & Volume, 2021-2026 ($)
Figure 122: Russia Ethylene Dichloride Market Value & Volume, 2021-2026 ($)
Figure 123: Russia GDP and Population, 2018-2019 ($)
Figure 124: Russia GDP – Composition of 2018, By Sector of Origin
Figure 125: Russia Export and Import Value & Volume, 2018-2019 ($)
Figure 126: Israel Ethylene Dichloride Market Value & Volume, 2021-2026 ($)
Figure 127: Israel GDP and Population, 2018-2019 ($)
Figure 128: Israel GDP – Composition of 2018, By Sector of Origin
Figure 129: Israel Export and Import Value & Volume, 2018-2019 ($)
Figure 130: Entropy Share, By Strategies, 2018-2019* (%) Ethylene Dichloride Market
Figure 131: Developments, 2018-2019* Ethylene Dichloride Market
Figure 132: Company 1 Ethylene Dichloride Market Net Revenue, By Years, 2018-2019* ($)
Figure 133: Company 1 Ethylene Dichloride Market Net Revenue Share, By Business segments, 2018 (%)
Figure 134: Company 1 Ethylene Dichloride Market Net Sales Share, By Geography, 2018 (%)
Figure 135: Company 2 Ethylene Dichloride Market Net Revenue, By Years, 2018-2019* ($)
Figure 136: Company 2 Ethylene Dichloride Market Net Revenue Share, By Business segments, 2018 (%)
Figure 137: Company 2 Ethylene Dichloride Market Net Sales Share, By Geography, 2018 (%)
Figure 138: Company 3 Ethylene Dichloride Market Net Revenue, By Years, 2018-2019* ($)
Figure 139: Company 3 Ethylene Dichloride Market Net Revenue Share, By Business segments, 2018 (%)
Figure 140: Company 3 Ethylene Dichloride Market Net Sales Share, By Geography, 2018 (%)
Figure 141: Company 4 Ethylene Dichloride Market Net Revenue, By Years, 2018-2019* ($)
Figure 142: Company 4 Ethylene Dichloride Market Net Revenue Share, By Business segments, 2018 (%)
Figure 143: Company 4 Ethylene Dichloride Market Net Sales Share, By Geography, 2018 (%)
Figure 144: Company 5 Ethylene Dichloride Market Net Revenue, By Years, 2018-2019* ($)
Figure 145: Company 5 Ethylene Dichloride Market Net Revenue Share, By Business segments, 2018 (%)
Figure 146: Company 5 Ethylene Dichloride Market Net Sales Share, By Geography, 2018 (%)
Figure 147: Company 6 Ethylene Dichloride Market Net Revenue, By Years, 2018-2019* ($)
Figure 148: Company 6 Ethylene Dichloride Market Net Revenue Share, By Business segments, 2018 (%)
Figure 149: Company 6 Ethylene Dichloride Market Net Sales Share, By Geography, 2018 (%)
Figure 150: Company 7 Ethylene Dichloride Market Net Revenue, By Years, 2018-2019* ($)
Figure 151: Company 7 Ethylene Dichloride Market Net Revenue Share, By Business segments, 2018 (%)
Figure 152: Company 7 Ethylene Dichloride Market Net Sales Share, By Geography, 2018 (%)
Figure 153: Company 8 Ethylene Dichloride Market Net Revenue, By Years, 2018-2019* ($)
Figure 154: Company 8 Ethylene Dichloride Market Net Revenue Share, By Business segments, 2018 (%)
Figure 155: Company 8 Ethylene Dichloride Market Net Sales Share, By Geography, 2018 (%)
Figure 156: Company 9 Ethylene Dichloride Market Net Revenue, By Years, 2018-2019* ($)
Figure 157: Company 9 Ethylene Dichloride Market Net Revenue Share, By Business segments, 2018 (%)
Figure 158: Company 9 Ethylene Dichloride Market Net Sales Share, By Geography, 2018 (%)
Figure 159: Company 10 Ethylene Dichloride Market Net Revenue, By Years, 2018-2019* ($)
Figure 160: Company 10 Ethylene Dichloride Market Net Revenue Share, By Business segments, 2018 (%)
Figure 161: Company 10 Ethylene Dichloride Market Net Sales Share, By Geography, 2018 (%)
Figure 162: Company 11 Ethylene Dichloride Market Net Revenue, By Years, 2018-2019* ($)
Figure 163: Company 11 Ethylene Dichloride Market Net Revenue Share, By Business segments, 2018 (%)
Figure 164: Company 11 Ethylene Dichloride Market Net Sales Share, By Geography, 2018 (%)
Figure 165: Company 12 Ethylene Dichloride Market Net Revenue, By Years, 2018-2019* ($)
Figure 166: Company 12 Ethylene Dichloride Market Net Revenue Share, By Business segments, 2018 (%)
Figure 167: Company 12 Ethylene Dichloride Market Net Sales Share, By Geography, 2018 (%)
Figure 168: Company 13 Ethylene Dichloride Market Net Revenue, By Years, 2018-2019* ($)
Figure 169: Company 13 Ethylene Dichloride Market Net Revenue Share, By Business segments, 2018 (%)
Figure 170: Company 13 Ethylene Dichloride Market Net Sales Share, By Geography, 2018 (%)
Figure 171: Company 14 Ethylene Dichloride Market Net Revenue, By Years, 2018-2019* ($)
Figure 172: Company 14 Ethylene Dichloride Market Net Revenue Share, By Business segments, 2018 (%)
Figure 173: Company 14 Ethylene Dichloride Market Net Sales Share, By Geography, 2018 (%)
Figure 174: Company 15 Ethylene Dichloride Market Net Revenue, By Years, 2018-2019* ($)
Figure 175: Company 15 Ethylene Dichloride Market Net Revenue Share, By Business segments, 2018 (%)
Figure 176: Company 15 Ethylene Dichloride Market Net Sales Share, By Geography, 2018 (%)