 Email
Email Print
Print


Circular Connectors Market Overview:
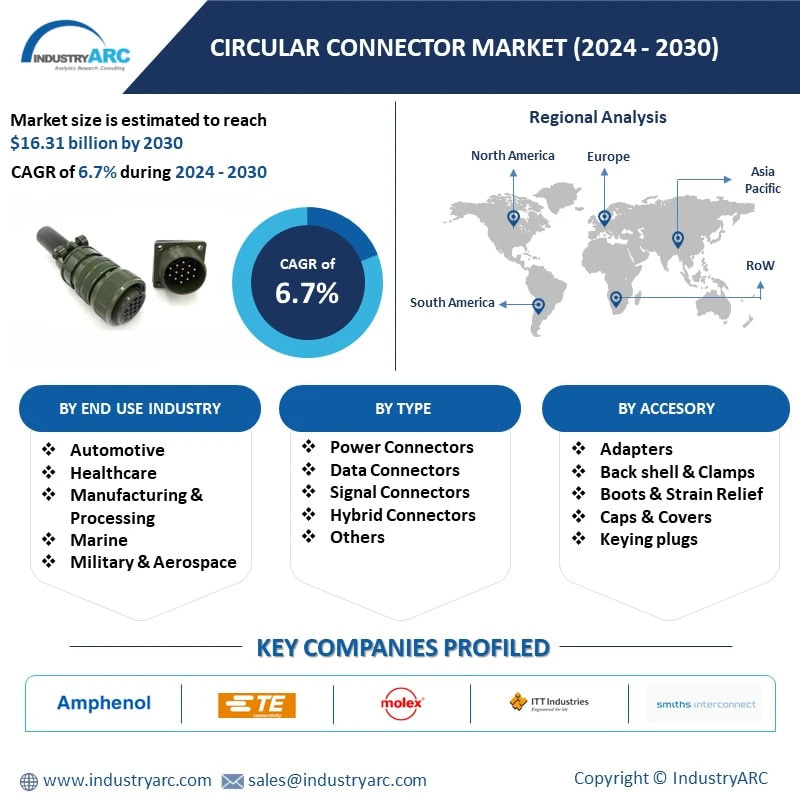
Circular Connectors Market size is forecast to reach $16.31 Billion by 2030, after growing at a CAGR of 6.7% during 2024-2030. This growth is driven as the Circular Connectors market is discerning the rising adoption of automation systems across diverse industries. Circular connectors play a pivotal role in these systems, owing to their versatility, reliability, and compatibility with a broad spectrum of devices and systems. As industries increasingly embrace automation to enhance operational efficiency and productivity, the demand for circular connectors continues to grow steadily. Their ability to facilitate seamless connectivity within automated environments underscores their significance as essential components, driving their widespread adoption and fuelling market growth in the Circular Connectors sector.
Additionally, the Circular Connectors market witnesses a major trend with the robust growth of the renewable energy sector. Circular connectors are indispensable components within renewable energy systems, facilitating essential functions such as power transmission, data communication, and control systems. This trend underscores the increasing reliance on sustainable energy sources and the pivotal role of circular connectors in enabling the efficient operation of renewable energy infrastructure. As the renewable energy sector continues to expand globally, the demand for high-quality circular connectors tailored to the unique requirements of green energy applications is expected to soar, driving significant market growth.
Market Snapshot:
Circular Connectors Market - Report Coverage:
The “Circular Connectors Market Report - Forecast (2024-2030)” by IndustryARC, covers an in-depth analysis of the following segments in the Circular Connectors Market.
By Type: Power Connectors, Data Connectors, Signal Connectors, Hybrid Connectors, Others
By Accessory: Adapters, Backshell & Clamps, Boots & Strain Relief, Caps & Cover, Keying plugs, Seals, Others
By End Use Industry: Automotive, Healthcare, Manufacturing & Processing, Marine, Military & Aerospace, Mining, Oil & Gas, Power & Utilities, Others
By Geography: North America, South America, Europe, APAC, and RoW.
COVID-19 / Ukraine Crisis - Impact Analysis:
• The Covid-19 pandemic significantly impacted the circular connectors market. With disruptions in global supply chains and manufacturing operations, the demand for circular connectors fluctuated. While sectors like healthcare and telecommunications saw increased demand for devices requiring these connectors due to the surge in remote work and healthcare needs, industries like automotive and aerospace experienced slowdowns. Uncertainty and reduced consumer spending further compounded the challenges. However, as economies recover and industries adapt to new norms, the market is expected to stabilize with a gradual rebound in demand.
• The Russia-Ukraine crisis could significantly impact the circular connectors market due to potential disruptions in the global supply chain. Ukraine is a major producer of raw materials such as metals, including those used in manufacturing connectors. Any escalation of conflict or economic sanctions could lead to supply chain disruptions, affecting production schedules and causing price volatility. Moreover, geopolitical tensions may prompt companies to reassess their sourcing strategies, potentially diversifying suppliers or relocating production facilities, leading to shifts in market dynamics and competitive landscapes.
Key Takeaways:
• Asia Pacific emerges as a steadily growing market in the circular connectors sector. The region's rapid industrialization, expanding automotive and electronics sectors, and increasing investments in infrastructure projects drive demand. Countries like China, Japan, South Korea, and India are key contributors to market growth. Additionally, rising adoption of advanced technologies like 5G and electric vehicles further fuels demand for circular connectors in the region, positioning Asia Pacific as a significant market player.
• Hybrid connectors represent the fastest-growing type in the circular connectors market. These connectors integrate multiple functions into a single compact unit, offering enhanced versatility and space savings. With the increasing demand for multifunctional electronic devices across various industries, hybrid connectors are gaining popularity. They facilitate seamless integration of power, signal, and data transmission within a single connector, meeting the evolving needs of modern electronic systems and driving their significant growth in the market.
• The automotive industry stands as the largest growing end-use industry in the circular connectors market. With the rapid evolution of electric vehicles (EVs), autonomous driving technologies, and advanced vehicle electronics, the demand for robust and reliable connectors is soaring. Circular connectors play a critical role in powering, controlling, and communicating within vehicles. As automotive manufacturers focus on innovation and electrification, the demand for circular connectors continues to surge, driving substantial growth in the market.
Circular Connectors Market Segment Analysis – By Type
Hybrid connectors are experiencing steady growth in the circular connectors market with highest CAGR of 7.9% due to their versatility and ability to address diverse connectivity needs. These connectors integrate multiple contact types, such as power, signal, coaxial, fiber optic, and fluidic, within a single housing, offering compact and efficient solutions for complex systems. The demand for hybrid connectors is propelled by various industries, including automotive, aerospace, telecommunications, and medical devices, where there is a growing need for integrated connectivity solutions. For example, in automotive applications, hybrid connectors are used to consolidate various functions like power transmission, data communication, and sensor connections in electric vehicles and advanced driver assistance systems (ADAS). Moreover, the increasing adoption of hybrid and electric vehicles, along with the proliferation of IoT devices and smart infrastructure, further drives the demand for hybrid connectors. As industries continue to demand compact and multifunctional connectivity solutions, hybrid connectors are poised for sustained growth in the circular connectors market, offering enhanced performance, reliability, and efficiency.
Circular Connectors Market Segment Analysis – By Accessory
Adapters are emerging as the highest-growing accessory offering in the circular connectors market with a CAGR of 7.4% in forecast period 2024-2030 due to their versatility and adaptability across various applications. As electronic devices become more diverse and specialized, the demand for adapters to facilitate connectivity between different connector types and standards is rising sharply. Adapters play a crucial role in bridging the gap between incompatible connector interfaces, allowing seamless integration and interoperability within complex systems. Recent trends indicate a surge in demand for adapters in response to the proliferation of new technologies such as USB Type-C, Thunderbolt, and HDMI, which require adapters to connect to legacy interfaces. Moreover, the increasing adoption of high-speed data transmission standards and stringent performance requirements necessitates the use of specialized adapters to maintain signal integrity and reliability. With the rapid evolution of connector technologies and the growing complexity of electronic systems, adapters offer a cost-effective and flexible solution to address compatibility challenges, driving their status as the highest-growing accessory offering in the circular connectors market.
Circular Connectors Market Segment Analysis – By End Use Industry
The automotive industry stands out as one of the highest-growing end-use sectors in the circular connectors market with a market share of 7.6% in 2023. Recent years have witnessed a surge in demand for electronic components and systems within vehicles, driven by trends such as electric vehicles (EVs), autonomous driving technology, and advanced infotainment systems. Circular connectors play a vital role in facilitating the connectivity and reliability of these electronic systems, ensuring seamless communication between various vehicle components. Furthermore, the increasing emphasis on vehicle electrification and sustainability initiatives has led to a greater need for robust and high-performance connectors capable of withstanding the demands of electric powertrains. As automakers continue to prioritize innovation and incorporate more sophisticated electronic features into their vehicles, the demand for circular connectors is expected to further escalate. Additionally, emerging markets in regions like Asia Pacific are witnessing rapid growth in automotive production and sales, further bolstering the demand for circular connectors in the automotive sector.
Circular Connectors Market Segment Analysis – By Geography
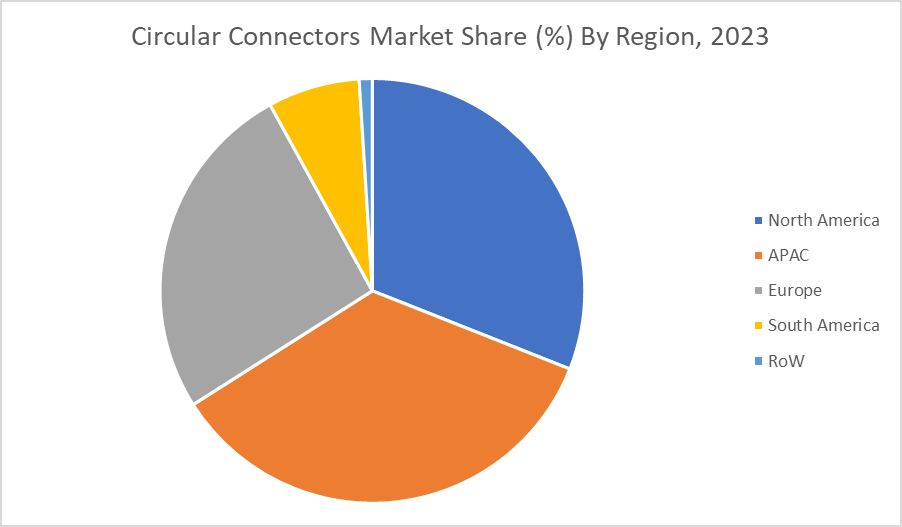
Asia Pacific stands out as a steadily growing market with market share of 35% in the circular connectors sector in year 2023, propelled by several key factors. The region's robust industrialization, particularly in countries like China and India, coupled with the burgeoning automotive and electronics industries, drives substantial demand for circular connectors. Moreover, rapid urbanization and increasing investments in infrastructure projects further contribute to market growth. Additionally, Asia Pacific serves as a hub for technological innovation and manufacturing excellence, attracting significant investments from global players in the electronics and automotive sectors. The rising adoption of advanced technologies such as 5G networks, Internet of Things (IoT) devices, and electric vehicles (EVs) in the region also fuels demand for high-quality circular connectors. Furthermore, supportive government initiatives and policies aimed at fostering domestic manufacturing and enhancing connectivity infrastructure bolster the growth prospects of the circular connectors market in Asia Pacific. Overall, the region's dynamic economic landscape and expanding industrial base position it as a significant and steadily growing market for circular connectors.
For More Details on This Report - Request for Sample
Circular Connectors Market Drivers
The Growing Proliferation of Electronic Devices Across Various Industries
The circular connectors market is experiencing robust growth due to the increasing proliferation of electronic devices across diverse industries. Recent developments underscore this trend, with sectors such as automotive, aerospace, telecommunications, and industrial automation witnessing significant advancements in electronic equipment and systems. In automotive applications, the rise of electric vehicles (EVs) and autonomous driving technologies has led to a surge in demand for circular connectors to support the complex electrical architectures of these vehicles. Similarly, in aerospace, the deployment of next-generation aircraft with sophisticated avionics systems requires reliable and high-performance connectors to ensure seamless connectivity. Furthermore, the expansion of 5G networks and the Internet of Things (IoT) is driving the demand for circular connectors in telecommunications infrastructure, facilitating high-speed data transmission and connectivity. Moreover, the industrial automation sector is adopting advanced machinery and robotics, driving the need for rugged and reliable connectors to withstand harsh operating environments. Overall, the growing adoption of electronic devices across industries is a key driver propelling the circular connectors market forward, with recent developments reflecting the increasing reliance on these connectors to support the connectivity demands of modern technologies.
Continuous Advancements in Connector Technology
Continuous advancements in connector technology serve as a key driver in the Circular Connectors market. Recent developments showcase a notable emphasis on enhancing data transmission speeds, reliability, and durability. Manufacturers are integrating innovative materials such as advanced plastics and composites, alongside metal alloys, to improve connector performance while reducing weight and size. Moreover, developments in contact design, sealing technologies, and shielding techniques are addressing the demand for connectors capable of withstanding harsh environments, including extreme temperatures and moisture. These advancements cater to evolving industry needs, particularly in sectors like aerospace, automotive, and telecommunications, fostering market growth and enabling new applications.
Circular Connectors Market Challenges
Circular Connectors Market is Facing Challenge in Keeping Pace with Rapid Technological Advancements and Ensuring Compatibility
The circular connectors market is grappling with the challenge of keeping pace with rapid technological advancements and ensuring compatibility with evolving industry standards. Recent developments underscore the increasing complexity of electronic devices and systems, driven by trends such as miniaturization, higher data transfer speeds, and enhanced functionalities. As a result, circular connector manufacturers are under pressure to innovate and develop connectors that meet these evolving requirements while ensuring compatibility across diverse applications and devices. Moreover, the proliferation of emerging technologies like 5G, Internet of Things (IoT), and electric vehicles (EVs) further complicates the challenge. For instance, the adoption of 5G technology requires connectors capable of supporting high-speed data transmission and low latency, driving the need for connectors with advanced performance characteristics. Similarly, the transition to EVs necessitates connectors capable of handling high power levels and harsh automotive environments. Addressing these challenges requires significant investment in research and development, collaboration with industry partners, and stringent testing and validation processes to ensure that circular connectors meet the compatibility and performance demands of modern electronic systems.
Market Landscape
Product/Service launches, approvals, patents and events, acquisitions, partnerships and collaborations are key strategies adopted by players in the Circular Connectors Market. The top 10 companies in this industry are: Amphenol Corporation, TE Connectivity Ltd., Molex (A subsidiary of Koch Industries), ITT Inc., Smiths Interconnect (A division of Smiths Group), Fischer Connectors SA, Hirose Electric Co., Ltd., LEMO SA, HARTING Technology Group, Glenair, Inc.
Developments:
• CUI Devices’ Interconnect Group recently bolstered its offerings in the circular connectors market with the introduction of a new line of connectors. This expansion enriches their product portfolio, addressing evolving customer needs and enhancing their competitive edge. With the addition of these circular connectors, CUI Devices is poised to meet the growing demand for reliable and versatile connectivity solutions, further solidifying its position in the market.
• STMicroelectronics (ST) and Rosenberger's collaboration has yielded an innovative contactless connector technology aimed at minimizing wire count in connectors. This advancement represents a significant market development in the Circular Connector Market, offering streamlined connectivity solutions. By reducing wire complexity, the technology enhances efficiency and reliability in various industries, fostering the adoption of circular connectors in modern electronic systems.
For more Automation and Instrumentation Market reports, please click here
1. Circular Connectors Market - Overview
1.1. Definitions and Scope
2. Circular Connectors Market - Executive Summary
2.1. Key Trends by Type
2.2. Key Trends by Indication
2.3. Key Trends by End User
2.4. Key Trends by Intake Method
2.5. Key Trends by Distribution Channel
2.6. Key Trends by Geography
3. Circular Connectors Market - Comparative Analysis
3.1. Company Benchmarking - Key Companies
3.2. Global Financial Analysis - Key Companies
3.3. Market Share Analysis - Key Companies
3.4. Patent Analysis
3.5. Pricing Analysis
4. Circular Connectors Market - Start-up Companies Scenario (Premium)
4.1. Key Start-up Company Analysis by
4.1.1. Investment
4.1.2. Revenue
4.1.3. Venture Capital and Funding Scenario
5. Circular Connectors Market – Market Entry Scenario Premium (Premium)
5.1. Regulatory Framework Overview
5.2. New Business and Ease of Doing Business Index
5.3. Case Studies of Successful Ventures
6. Circular Connectors Market - Forces
6.1. Market Drivers
6.2. Market Constraints
6.3. Market Challenges
6.4. Porter's Five Force Model
6.4.1. Bargaining Power of Suppliers
6.4.2. Bargaining Powers of Customers
6.4.3. Threat of New Entrants
6.4.4. Rivalry Among Existing Players
6.4.5. Threat of Substitutes
7. Circular Connectors Market – Strategic Analysis
7.1. Value Chain Analysis
7.2. Opportunities Analysis
7.3. Market Life Cycle
8. Circular Connectors Market – By Type (Market Size – $Million/$Billion)
8.1. Power Connectors
8.2. Data Connectors
8.3. Signal Connectors
8.4. Hybrid Connectors
8.5. Others
9. Circular Connectors Market – By Accessory (Market Size – $Million/$Billion)
9.1. Adapters
9.2. Back shell & Clamps
9.3. Boots & Strain Relief
9.4. Caps & Covers
9.5. Keying plugs
9.6. Seals
9.7. Others
10. Circular Connectors Market – By End Use Industry (Market Size – $Million/$Billion)
10.1. Automotive
10.2. Healthcare
10.3. Manufacturing & Processing
10.4. Marine
10.5. Military & Aerospace
10.6. Mining
10.7. Oil & Gas
10.8. Power & Utilities
10.9. Others
11. Circular Connectors Market – by Geography (Market Size – $Million/$Billion)
11.1. North America
11.1.1. The U.S.
11.1.2. Canada
11.1.3. Mexico
11.2. Europe
11.2.1. UK
11.2.2. Germany
11.2.3. France
11.2.4. Italy
11.2.5. Spain
11.2.6. Russia
11.2.7. Rest of Europe
11.3. Asia-Pacific
11.3.1. China
11.3.2. India
11.3.3. Japan
11.3.4. South Korea
11.3.5. Australia & New Zealand
11.3.6. Rest of Asia-Pacific
11.4. South America
11.4.1. Brazil
11.4.2. Argentina
11.4.3. Chile
11.4.4. Colombia
11.4.5. Rest of South America
11.5. Rest of the World
11.5.1. Middle East
11.5.2. Africa
12. Circular Connectors Market – Entropy
13. Circular Connectors Market – Industry/Segment Competition Landscape Premium
13.1. Market Share Analysis
13.1.1. Market Share by Filter Type – Key Companies
13.1.2. Market Share by Region – Key Companies
13.1.3. Market Share by Country – Key Companies
13.2. Competition Matrix
13.3. Best Practices for Companies
14. Circular Connectors Market – Key Company List by Country Premium Premium
15. Circular Connectors Market - Company Analysis
15.1. Amphenol Corporation
15.2. TE Connectivity Ltd.
15.3. Molex (A subsidiary of Koch Industries)
15.4. ITT Inc.
15.5. Smiths Interconnect (A division of Smiths Group)
15.6. Fischer Connectors SA
15.7. Hirose Electric Co., Ltd.
15.8. LEMO SA
15.9. HARTING Technology Group
15.10.Glenair, Inc.
• "Financials to the Private Companies would be provided on best-effort basis."
Connect with our experts to get customized reports that best suit your requirements. Our
reports include global-level data, niche markets and competitive landscape.
List of Tables
Table 1: Circular Connectors Market Overview 2019-2024
Table 2: Circular Connectors Market Leader Analysis 2018-2019 (US$)
Table 3: Circular Connectors Market Product Analysis 2018-2019 (US$)
Table 4: Circular Connectors Market End User Analysis 2018-2019 (US$)
Table 5: Circular Connectors Market Patent Analysis 2013-2018* (US$)
Table 6: Circular Connectors Market Financial Analysis 2018-2019 (US$)
Table 7: Circular Connectors Market Driver Analysis 2018-2019 (US$)
Table 8: Circular Connectors Market Challenges Analysis 2018-2019 (US$)
Table 9: Circular Connectors Market Constraint Analysis 2018-2019 (US$)
Table 10: Circular Connectors Market Supplier Bargaining Power Analysis 2018-2019 (US$)
Table 11: Circular Connectors Market Buyer Bargaining Power Analysis 2018-2019 (US$)
Table 12: Circular Connectors Market Threat of Substitutes Analysis 2018-2019 (US$)
Table 13: Circular Connectors Market Threat of New Entrants Analysis 2018-2019 (US$)
Table 14: Circular Connectors Market Degree of Competition Analysis 2018-2019 (US$)
Table 15: Circular Connectors Market Value Chain Analysis 2018-2019 (US$)
Table 16: Circular Connectors Market Pricing Analysis 2019-2024 (US$)
Table 17: Circular Connectors Market Opportunities Analysis 2019-2024 (US$)
Table 18: Circular Connectors Market Product Life Cycle Analysis 2019-2024 (US$)
Table 19: Circular Connectors Market Supplier Analysis 2018-2019 (US$)
Table 20: Circular Connectors Market Distributor Analysis 2018-2019 (US$)
Table 21: Circular Connectors Market Trend Analysis 2018-2019 (US$)
Table 22: Circular Connectors Market Size 2018 (US$)
Table 23: Circular Connectors Market Forecast Analysis 2019-2024 (US$)
Table 24: Circular Connectors Market Sales Forecast Analysis 2019-2024 (Units)
Table 25: Circular Connectors Market, Revenue & Volume,By Type, 2019-2024 ($)
Table 26: Circular Connectors Market By Type, Revenue & Volume,Power Connectors, 2019-2024 ($)
Table 27: Circular Connectors Market By Type, Revenue & Volume,Data Connectors, 2019-2024 ($)
Table 28: Circular Connectors Market By Type, Revenue & Volume, Signal Connectors, 2019-2024 ($)
Table 29: Circular Connectors Market By Type, Revenue & Volume,Hybrid Connectors, 2019-2024 ($)
Table 30: Circular Connectors Market, Revenue & Volume,By Accessories, 2019-2024 ($)
Table 31: Circular Connectors Market By Accessories, Revenue & Volume,Adapters, 2019-2024 ($)
Table 32: Circular Connectors Market By Accessories, Revenue & Volume,Back shell & Clamps, 2019-2024 ($)
Table 33: Circular Connectors Market By Accessories, Revenue & Volume,Boots & Strain Relief, 2019-2024 ($)
Table 34: Circular Connectors Market By Accessories, Revenue & Volume,Caps & Covers, 2019-2024 ($)
Table 35: Circular Connectors Market By Accessories, Revenue & Volume,Keying plugs, 2019-2024 ($)
Table 36: Circular Connectors Market, Revenue & Volume,By End User Verticals, 2019-2024 ($)
Table 37: Circular Connectors Market By End User Verticals, Revenue & Volume,Automotive, 2019-2024 ($)
Table 38: Circular Connectors Market By End User Verticals, Revenue & Volume,Healthcare, 2019-2024 ($)
Table 39: Circular Connectors Market By End User Verticals, Revenue & Volume,Manufacturing & Processing, 2019-2024 ($)
Table 40: Circular Connectors Market By End User Verticals, Revenue & Volume,Marine, 2019-2024 ($)
Table 41: Circular Connectors Market By End User Verticals, Revenue & Volume,Military & Aerospace, 2019-2024 ($)
Table 42: North America Circular Connectors Market, Revenue & Volume,By Type, 2019-2024 ($)
Table 43: North America Circular Connectors Market, Revenue & Volume,By Accessories, 2019-2024 ($)
Table 44: North America Circular Connectors Market, Revenue & Volume,By End User Verticals, 2019-2024 ($)
Table 45: South america Circular Connectors Market, Revenue & Volume,By Type, 2019-2024 ($)
Table 46: South america Circular Connectors Market, Revenue & Volume,By Accessories, 2019-2024 ($)
Table 47: South america Circular Connectors Market, Revenue & Volume,By End User Verticals, 2019-2024 ($)
Table 48: Europe Circular Connectors Market, Revenue & Volume,By Type, 2019-2024 ($)
Table 49: Europe Circular Connectors Market, Revenue & Volume,By Accessories, 2019-2024 ($)
Table 50: Europe Circular Connectors Market, Revenue & Volume,By End User Verticals, 2019-2024 ($)
Table 51: APAC Circular Connectors Market, Revenue & Volume,By Type, 2019-2024 ($)
Table 52: APAC Circular Connectors Market, Revenue & Volume,By Accessories, 2019-2024 ($)
Table 53: APAC Circular Connectors Market, Revenue & Volume,By End User Verticals, 2019-2024 ($)
Table 54: Middle East & Africa Circular Connectors Market, Revenue & Volume,By Type, 2019-2024 ($)
Table 55: Middle East & Africa Circular Connectors Market, Revenue & Volume,By Accessories, 2019-2024 ($)
Table 56: Middle East & Africa Circular Connectors Market, Revenue & Volume,By End User Verticals, 2019-2024 ($)
Table 57: Russia Circular Connectors Market, Revenue & Volume,By Type, 2019-2024 ($)
Table 58: Russia Circular Connectors Market, Revenue & Volume,By Accessories, 2019-2024 ($)
Table 59: Russia Circular Connectors Market, Revenue & Volume,By End User Verticals, 2019-2024 ($)
Table 60: Israel Circular Connectors Market, Revenue & Volume,By Type, 2019-2024 ($)
Table 61: Israel Circular Connectors Market, Revenue & Volume,By Accessories, 2019-2024 ($)
Table 62: Israel Circular Connectors Market, Revenue & Volume,By End User Verticals, 2019-2024 ($)
Table 63: Top Companies 2018 (US$)Circular Connectors Market, Revenue & Volume
Table 64: Product Launch 2018-2019Circular Connectors Market, Revenue & Volume
Table 65: Mergers & Acquistions 2018-2019Circular Connectors Market, Revenue & Volume
List of Figures
Figure 1: Overview of Circular Connectors Market 2019-2024
Figure 2: Market Share Analysis for Circular Connectors Market 2018 (US$)
Figure 3: Product Comparison in Circular Connectors Market 2018-2019 (US$)
Figure 4: End User Profile for Circular Connectors Market 2018-2019 (US$)
Figure 5: Patent Application and Grant in Circular Connectors Market 2013-2018* (US$)
Figure 6: Top 5 Companies Financial Analysis in Circular Connectors Market 2018-2019 (US$)
Figure 7: Market Entry Strategy in Circular Connectors Market 2018-2019
Figure 8: Ecosystem Analysis in Circular Connectors Market 2018
Figure 9: Average Selling Price in Circular Connectors Market 2019-2024
Figure 10: Top Opportunites in Circular Connectors Market 2018-2019
Figure 11: Market Life Cycle Analysis in Circular Connectors Market Market Life Cycle Analysis in 3D Printing
Figure 12: GlobalBy TypeCircular Connectors Market Revenue, 2019-2024 ($)
Figure 13: GlobalBy AccessoriesCircular Connectors Market Revenue, 2019-2024 ($)
Figure 14: GlobalBy End User VerticalsCircular Connectors Market Revenue, 2019-2024 ($)
Figure 15: Global Circular Connectors Market - By Geography
Figure 16: Global Circular Connectors Market Value & Volume, By Geography, 2019-2024 ($)
Figure 17: Global Circular Connectors Market CAGR, By Geography, 2019-2024 (%)
Figure 18: North America Circular Connectors Market Value & Volume, 2019-2024 ($)
Figure 19: US Circular Connectors Market Value & Volume, 2019-2024 ($)
Figure 20: US GDP and Population, 2018-2019 ($)
Figure 21: US GDP – Composition of 2018, By Sector of Origin
Figure 22: US Export and Import Value & Volume, 2018-2019 ($)
Figure 23: Canada Circular Connectors Market Value & Volume, 2019-2024 ($)
Figure 24: Canada GDP and Population, 2018-2019 ($)
Figure 25: Canada GDP – Composition of 2018, By Sector of Origin
Figure 26: Canada Export and Import Value & Volume, 2018-2019 ($)
Figure 27: Mexico Circular Connectors Market Value & Volume, 2019-2024 ($)
Figure 28: Mexico GDP and Population, 2018-2019 ($)
Figure 29: Mexico GDP – Composition of 2018, By Sector of Origin
Figure 30: Mexico Export and Import Value & Volume, 2018-2019 ($)
Figure 31: South America Circular Connectors Market South America 3D Printing Market Value & Volume, 2019-2024 ($)
Figure 32: Brazil Circular Connectors Market Value & Volume, 2019-2024 ($)
Figure 33: Brazil GDP and Population, 2018-2019 ($)
Figure 34: Brazil GDP – Composition of 2018, By Sector of Origin
Figure 35: Brazil Export and Import Value & Volume, 2018-2019 ($)
Figure 36: Venezuela Circular Connectors Market Value & Volume, 2019-2024 ($)
Figure 37: Venezuela GDP and Population, 2018-2019 ($)
Figure 38: Venezuela GDP – Composition of 2018, By Sector of Origin
Figure 39: Venezuela Export and Import Value & Volume, 2018-2019 ($)
Figure 40: Argentina Circular Connectors Market Value & Volume, 2019-2024 ($)
Figure 41: Argentina GDP and Population, 2018-2019 ($)
Figure 42: Argentina GDP – Composition of 2018, By Sector of Origin
Figure 43: Argentina Export and Import Value & Volume, 2018-2019 ($)
Figure 44: Ecuador Circular Connectors Market Value & Volume, 2019-2024 ($)
Figure 45: Ecuador GDP and Population, 2018-2019 ($)
Figure 46: Ecuador GDP – Composition of 2018, By Sector of Origin
Figure 47: Ecuador Export and Import Value & Volume, 2018-2019 ($)
Figure 48: Peru Circular Connectors Market Value & Volume, 2019-2024 ($)
Figure 49: Peru GDP and Population, 2018-2019 ($)
Figure 50: Peru GDP – Composition of 2018, By Sector of Origin
Figure 51: Peru Export and Import Value & Volume, 2018-2019 ($)
Figure 52: Colombia Circular Connectors Market Value & Volume, 2019-2024 ($)
Figure 53: Colombia GDP and Population, 2018-2019 ($)
Figure 54: Colombia GDP – Composition of 2018, By Sector of Origin
Figure 55: Colombia Export and Import Value & Volume, 2018-2019 ($)
Figure 56: Costa Rica Circular Connectors Market Costa Rica 3D Printing Market Value & Volume, 2019-2024 ($)
Figure 57: Costa Rica GDP and Population, 2018-2019 ($)
Figure 58: Costa Rica GDP – Composition of 2018, By Sector of Origin
Figure 59: Costa Rica Export and Import Value & Volume, 2018-2019 ($)
Figure 60: Europe Circular Connectors Market Value & Volume, 2019-2024 ($)
Figure 61: U.K Circular Connectors Market Value & Volume, 2019-2024 ($)
Figure 62: U.K GDP and Population, 2018-2019 ($)
Figure 63: U.K GDP – Composition of 2018, By Sector of Origin
Figure 64: U.K Export and Import Value & Volume, 2018-2019 ($)
Figure 65: Germany Circular Connectors Market Value & Volume, 2019-2024 ($)
Figure 66: Germany GDP and Population, 2018-2019 ($)
Figure 67: Germany GDP – Composition of 2018, By Sector of Origin
Figure 68: Germany Export and Import Value & Volume, 2018-2019 ($)
Figure 69: Italy Circular Connectors Market Value & Volume, 2019-2024 ($)
Figure 70: Italy GDP and Population, 2018-2019 ($)
Figure 71: Italy GDP – Composition of 2018, By Sector of Origin
Figure 72: Italy Export and Import Value & Volume, 2018-2019 ($)
Figure 73: France Circular Connectors Market Value & Volume, 2019-2024 ($)
Figure 74: France GDP and Population, 2018-2019 ($)
Figure 75: France GDP – Composition of 2018, By Sector of Origin
Figure 76: France Export and Import Value & Volume, 2018-2019 ($)
Figure 77: Netherlands Circular Connectors Market Value & Volume, 2019-2024 ($)
Figure 78: Netherlands GDP and Population, 2018-2019 ($)
Figure 79: Netherlands GDP – Composition of 2018, By Sector of Origin
Figure 80: Netherlands Export and Import Value & Volume, 2018-2019 ($)
Figure 81: Belgium Circular Connectors Market Value & Volume, 2019-2024 ($)
Figure 82: Belgium GDP and Population, 2018-2019 ($)
Figure 83: Belgium GDP – Composition of 2018, By Sector of Origin
Figure 84: Belgium Export and Import Value & Volume, 2018-2019 ($)
Figure 85: Spain Circular Connectors Market Value & Volume, 2019-2024 ($)
Figure 86: Spain GDP and Population, 2018-2019 ($)
Figure 87: Spain GDP – Composition of 2018, By Sector of Origin
Figure 88: Spain Export and Import Value & Volume, 2018-2019 ($)
Figure 89: Denmark Circular Connectors Market Value & Volume, 2019-2024 ($)
Figure 90: Denmark GDP and Population, 2018-2019 ($)
Figure 91: Denmark GDP – Composition of 2018, By Sector of Origin
Figure 92: Denmark Export and Import Value & Volume, 2018-2019 ($)
Figure 93: APAC Circular Connectors Market Value & Volume, 2019-2024 ($)
Figure 94: China Circular Connectors Market Value & Volume, 2019-2024
Figure 95: China GDP and Population, 2018-2019 ($)
Figure 96: China GDP – Composition of 2018, By Sector of Origin
Figure 97: China Export and Import Value & Volume, 2018-2019 ($)Circular Connectors Market China Export and Import Value & Volume, 2018-2019 ($)
Figure 98: Australia Circular Connectors Market Value & Volume, 2019-2024 ($)
Figure 99: Australia GDP and Population, 2018-2019 ($)
Figure 100: Australia GDP – Composition of 2018, By Sector of Origin
Figure 101: Australia Export and Import Value & Volume, 2018-2019 ($)
Figure 102: South Korea Circular Connectors Market Value & Volume, 2019-2024 ($)
Figure 103: South Korea GDP and Population, 2018-2019 ($)
Figure 104: South Korea GDP – Composition of 2018, By Sector of Origin
Figure 105: South Korea Export and Import Value & Volume, 2018-2019 ($)
Figure 106: India Circular Connectors Market Value & Volume, 2019-2024 ($)
Figure 107: India GDP and Population, 2018-2019 ($)
Figure 108: India GDP – Composition of 2018, By Sector of Origin
Figure 109: India Export and Import Value & Volume, 2018-2019 ($)
Figure 110: Taiwan Circular Connectors Market Taiwan 3D Printing Market Value & Volume, 2019-2024 ($)
Figure 111: Taiwan GDP and Population, 2018-2019 ($)
Figure 112: Taiwan GDP – Composition of 2018, By Sector of Origin
Figure 113: Taiwan Export and Import Value & Volume, 2018-2019 ($)
Figure 114: Malaysia Circular Connectors Market Malaysia 3D Printing Market Value & Volume, 2019-2024 ($)
Figure 115: Malaysia GDP and Population, 2018-2019 ($)
Figure 116: Malaysia GDP – Composition of 2018, By Sector of Origin
Figure 117: Malaysia Export and Import Value & Volume, 2018-2019 ($)
Figure 118: Hong Kong Circular Connectors Market Hong Kong 3D Printing Market Value & Volume, 2019-2024 ($)
Figure 119: Hong Kong GDP and Population, 2018-2019 ($)
Figure 120: Hong Kong GDP – Composition of 2018, By Sector of Origin
Figure 121: Hong Kong Export and Import Value & Volume, 2018-2019 ($)
Figure 122: Middle East & Africa Circular Connectors Market Middle East & Africa 3D Printing Market Value & Volume, 2019-2024 ($)
Figure 123: Russia Circular Connectors Market Russia 3D Printing Market Value & Volume, 2019-2024 ($)
Figure 124: Russia GDP and Population, 2018-2019 ($)
Figure 125: Russia GDP – Composition of 2018, By Sector of Origin
Figure 126: Russia Export and Import Value & Volume, 2018-2019 ($)
Figure 127: Israel Circular Connectors Market Value & Volume, 2019-2024 ($)
Figure 128: Israel GDP and Population, 2018-2019 ($)
Figure 129: Israel GDP – Composition of 2018, By Sector of Origin
Figure 130: Israel Export and Import Value & Volume, 2018-2019 ($)
Figure 131: Entropy Share, By Strategies, 2018-2019* (%)Circular Connectors Market
Figure 132: Developments, 2018-2019*Circular Connectors Market
Figure 133: Company 1 Circular Connectors Market Net Revenue, By Years, 2018-2019* ($)
Figure 134: Company 1 Circular Connectors Market Net Revenue Share, By Business segments, 2018 (%)
Figure 135: Company 1 Circular Connectors Market Net Sales Share, By Geography, 2018 (%)
Figure 136: Company 2 Circular Connectors Market Net Revenue, By Years, 2018-2019* ($)
Figure 137: Company 2 Circular Connectors Market Net Revenue Share, By Business segments, 2018 (%)
Figure 138: Company 2 Circular Connectors Market Net Sales Share, By Geography, 2018 (%)
Figure 139: Company 3Circular Connectors Market Net Revenue, By Years, 2018-2019* ($)
Figure 140: Company 3Circular Connectors Market Net Revenue Share, By Business segments, 2018 (%)
Figure 141: Company 3Circular Connectors Market Net Sales Share, By Geography, 2018 (%)
Figure 142: Company 4 Circular Connectors Market Net Revenue, By Years, 2018-2019* ($)
Figure 143: Company 4 Circular Connectors Market Net Revenue Share, By Business segments, 2018 (%)
Figure 144: Company 4 Circular Connectors Market Net Sales Share, By Geography, 2018 (%)
Figure 145: Company 5 Circular Connectors Market Net Revenue, By Years, 2018-2019* ($)
Figure 146: Company 5 Circular Connectors Market Net Revenue Share, By Business segments, 2018 (%)
Figure 147: Company 5 Circular Connectors Market Net Sales Share, By Geography, 2018 (%)
Figure 148: Company 6 Circular Connectors Market Net Revenue, By Years, 2018-2019* ($)
Figure 149: Company 6 Circular Connectors Market Net Revenue Share, By Business segments, 2018 (%)
Figure 150: Company 6 Circular Connectors Market Net Sales Share, By Geography, 2018 (%)
Figure 151: Company 7 Circular Connectors Market Net Revenue, By Years, 2018-2019* ($)
Figure 152: Company 7 Circular Connectors Market Net Revenue Share, By Business segments, 2018 (%)
Figure 153: Company 7 Circular Connectors Market Net Sales Share, By Geography, 2018 (%)
Figure 154: Company 8 Circular Connectors Market Net Revenue, By Years, 2018-2019* ($)
Figure 155: Company 8 Circular Connectors Market Net Revenue Share, By Business segments, 2018 (%)
Figure 156: Company 8 Circular Connectors Market Net Sales Share, By Geography, 2018 (%)
Figure 157: Company 9 Circular Connectors Market Net Revenue, By Years, 2018-2019* ($)
Figure 158: Company 9 Circular Connectors Market Net Revenue Share, By Business segments, 2018 (%)
Figure 159: Company 9 Circular Connectors Market Net Sales Share, By Geography, 2018 (%)
Figure 160: Company 10 Circular Connectors Market Net Revenue, By Years, 2018-2019* ($)
Figure 161: Company 10 Circular Connectors Market Net Revenue Share, By Business segments, 2018 (%)
Figure 162: Company 10 Circular Connectors Market Net Sales Share, By Geography, 2018 (%)
Figure 163: Company 11 Circular Connectors Market Net Revenue, By Years, 2018-2019* ($)
Figure 164: Company 11 Circular Connectors Market Net Revenue Share, By Business segments, 2018 (%)
Figure 165: Company 11 Circular Connectors Market Net Sales Share, By Geography, 2018 (%)
Figure 166: Company 12 Circular Connectors Market Net Revenue, By Years, 2018-2019* ($)
Figure 167: Company 12 Circular Connectors Market Net Revenue Share, By Business segments, 2018 (%)
Figure 168: Company 12 Circular Connectors Market Net Sales Share, By Geography, 2018 (%)
Figure 169: Company 13Circular Connectors Market Net Revenue, By Years, 2018-2019* ($)
Figure 170: Company 13Circular Connectors Market Net Revenue Share, By Business segments, 2018 (%)
Figure 171: Company 13Circular Connectors Market Net Sales Share, By Geography, 2018 (%)
Figure 172: Company 14 Circular Connectors Market Net Revenue, By Years, 2018-2019* ($)
Figure 173: Company 14 Circular Connectors Market Net Revenue Share, By Business segments, 2018 (%)
Figure 174: Company 14 Circular Connectors Market Net Sales Share, By Geography, 2018 (%)
Figure 175: Company 15 Circular Connectors Market Net Revenue, By Years, 2018-2019* ($)
Figure 176: Company 15 Circular Connectors Market Net Revenue Share, By Business segments, 2018 (%)
Figure 177: Company 15 Circular Connectors Market Net Sales Share, By Geography, 2018 (%)