 Email
Email Print
Print


Smart Meters market Overview
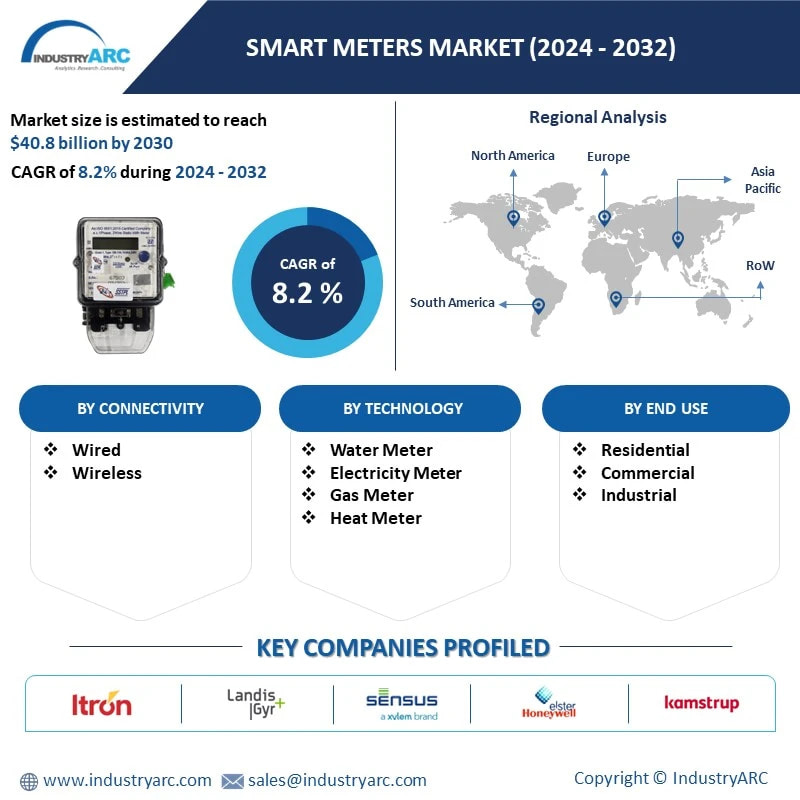
The Smart Meters market industry is projected to grow from USD 21.74 Billion in 2023 to USD 40.85 Billion by 2032, exhibiting a compound annual growth rate (CAGR) of 8.20% during the forecast period (2023 - 2032). Many governments around the world have been implementing regulations and initiatives to promote the adoption of smart meters. These initiatives often focus on energy efficiency, grid modernization, and reducing carbon emissions. For instance, in Europe, the EU's Energy Efficiency Directive mandates member states to achieve 80% smart meter penetration among households by 2020. Similarly, countries like the United States and China have also rolled out ambitious smart meter deployment programs driven by government policies. An increasing awareness among consumers and businesses regarding the importance of energy management and conservation has become evident in recent years. Smart meters play a crucial role in this paradigm shift by enabling more accurate monitoring and management of energy consumption. By providing real-time data on energy usage, smart meters empower consumers to make informed decisions about their energy habits, leading to reductions in energy usage and costs. Moreover, smart meters facilitate the integration of renewable energy sources into the grid by offering real-time insights into energy generation and consumption patterns. This capability not only supports sustainability efforts but also enhances the efficiency and reliability of the energy infrastructure.
Market Snapshot:
The report: “Smart Meters Market – Forecast (2024-2032)”, by IndustryARC covers an in-depth analysis of the following segments of the Smart Meters Market.
By Type - Electricity Meters (AMI, AMR), Water Meters (AMI, AMR), Gas Meters (AMI, AMR), Heat Meters (AMR, AMI)
By End Users - Residential, Commercial, Industrial (Water and Wastewater, Chemical, Oil and Gas, Food and Beverage, Semiconductor and Electronics, Medical and Pharmaceutical, Power and Energy, Metal and Mining, Pulp and Paper, Others)
By Connectivity – Wired, Wireless (RF Mesh, Zigbee, Sigfox, NB-IOT, Cellular, LTE-M, LoRaWaN, WiMaX, Wireles M-Bus, Others)
By Technology - Electricity Meters (Single Phase, Three Phase), Gas Meters (Differential Pressure, Ultrasonic, Coriolis, Thermal, Optical, Others), Water Meters (Positive Displacement, Differential Pressure, Coriolis, Multijet, Turbine, Electromagnetic, Ultrasonic, Others), Heat Meters (Multijet, Turbine, Electromagnetic, Ultrasonic, Others)
By Geography: North America (U.S., Canada, and Mexico), Europe (U.K, Germany, France, Italy, Netherland, Spain, Russia, Belgium, and Rest of Europe), Asia-Pacific (China, Japan, India, South Korea, Australia and New Zealand, Indonesia, Taiwan, Malaysia, and Rest of APAC), South America (Brazil, Argentina, Colombia, Chile, and Rest of South America), Rest of the World (Middle East, and Africa).
By Type- Segment Analysis
The segmentation of the Smart Meters market based on type encompasses Electric Meters, Gas Meters, Heat Meters and Water Meters. With electricity being a fundamental requirement in the modern world, many leading nations have committed to achieving full smart meter deployment nationwide. Given the ongoing population growth and urbanization, which are driving up global electricity demand, the electric meters segment has emerged as the dominant force in the market in recent years. This prevailing trend is anticipated to persist throughout the forecast period.
Geography - Segment Analysis
North America held the highest market share of the Smart Meters Market in 2023. The Asia-Pacific region stands on the cusp of spearheading the Smart Meters market, propelled predominantly by the surging demand for energy across diverse sectors, fueled by the region's burgeoning population. Additionally, the rapid proliferation of industrial establishments and workplaces within the industrial sector further augments this momentum, poised to significantly bolster market expansion in this dynamic and burgeoning area.

For More Details on This Report - Request for Sample
Drivers – Smart Meters Market
Smart Meters Tomorrow’s Intelligent Metering
Smart metering systems form the interface between consumers and smart grids and hence, such systems require meters with communication capabilities that transparently provide the customer in near real-time with current information about their energy consumption and their energy costs. Some of the main factors driving the smart meters market include stringent government policies, rise in smart grid deployment, growing demand for energy, increasing investments in power sector and utilities coupled with urge in enhancing their distribution efficiency.
Challenges – Smart Meters Market
• High cost of the products
One significant challenge for the Smart Meters market is the initial high cost of deployment and installation. Implementing smart metering infrastructure requires substantial investment in equipment, technology, and labor. This upfront cost can be a barrier for utilities and governments, particularly in regions with limited financial resources or competing priorities, This upfront financial outlay often presents a barrier for utilities and governments, especially in regions where financial resources are limited or where there are competing priorities for funding. Overcoming this challenge requires innovative financing models, cost-effective technologies, and strategic planning to ensure that the long-term benefits of smart meters outweigh the initial investment costs.
Market Landscape
Technology launches, acquisitions, and R&D activities are key strategies adopted by players in the Smart Meters Market. Smart market market is expected to be dominated by major companies such as
1 Itron Inc.
2 Landis+Gyr
3 Sensus/Xylem
4 Schneider Electric SA
5 Siemens AG
6 ABB
7 Diehl
8 Honeywell/Elster Group
9 Kamstrup
10 Zenner
1.Smart Meter Market Overview
1.1 Definitions and Scope
2.Smart Meter Market - Executive Summary
2.1 Market Revenue, Market Size and Key Trends by Company
2.2 Key trends by Type
2.3 Key trends segmented by Geography
3.Smart Meter Market – Market Landscape
3.1 Comparative Analysis
3.1.1 Product/Company Benchmarking-Top 5 Companies
3.1.2 Top 5 Financial Analysis
3.1.3 Market Value Split by Top 5 Companies
3.1.4 Patent Analysis
3.1.5 Pricing Analysis (Comparison of General Price Offerings for Key Companies)
4.Smart Meter Market – Industry Market Entry Scenario Premium
4.1 Regulatory Scenario
4.2 Ease of Doing Business Index
4.3 Case Studies
4.4 Customer Analysis
5.Smart Meter Market – Startup Company Scenario
5.1 Venture Capital and Funding Scenario
5.2 Startup Company Analysis
6.Smart Meter Market - Market Forces
6.1 Market Drivers
6.2 Market Constraints
6.3 Porters five force model
6.3.1 Bargaining power of suppliers
6.3.2 Bargaining powers of customers
6.3.3 Threat of new entrants
6.3.4 Rivalry among existing players
6.3.5 Threat of substitutes
7.Smart Meter Market – By Strategic Analysis (Market Size -$Million/Billion)
7.1 Value Chain Analysis
7.2 Opportunities Analysis
7.3 Product Life Cycle/Market Life Cycle Analysis
7.4 Suppliers and Distributors
8.Smart Meter Market – By Technology (Market Size -$Million/Billion)
8.1 Water Meter
8.1.1 Positive Displacement
8.1.2 Differential Pressure
8.1.3 Ultrasonic
8.1.4 Electromagnetic
8.1.5 Turbine
8.1.6 Coriolis
8.1.7 Multijet
8.1.8 Others
8.2 Heat Meter
8.2.1 Multijet
8.2.2 Turbine
8.2.3 Electromagnetic
8.2.4 Ultrasonic
8.2.5 Others
8.3 Electric Meter
8.3.1 Three Phase
8.3.2 Single Phase
8.4 Gas Meter
8.4.1 Differential Pressure
8.4.2 Ultrasonic
8.4.3 Coriolis
8.4.4 Thermal
8.4.5 Optical
8.4.6 Others
9.Smart Meter Market – By Meter Type (Market Size -$Million/Billion)
9.1 Water Meter
9.1.1 AMR
9.1.2 AMI
9.2 Gas Meter
9.2.1 AMR
9.2.2 AMI
9.3 Electric Meter
9.3.1 AMR
9.3.2 AMI
9.4 Heat Meter
9.4.1 AMR
9.4.2 AMI
10.Smart Meter Market – By Connectivity (Market Size -$Million/Billion)
10.1 Wired
10.2 Wireless
10.2.1 RF Mesh
10.2.2 Zigbee
10.2.3 Sigfox
10.2.4 NB-IOT
10.2.5 Cellular
10.2.6 LTE-M
10.2.7 LoRaWaN
10.2.8 WiMaX
10.2.9 Wireles M-Bus
10.2.10 Others
11.Smart Meter Market – By End Use Industry (Market Size -$Million/Billion)
11.1 Residential
11.2 Commercial
11.3 Industrial
11.3.1 Water and Wastewater
11.3.2 Chemical
11.3.3 Oil and Gas
11.3.4 Food and Beverage
11.3.5 Semiconductor and Electronics
11.3.6 Medical and Pharmaceutical
11.3.7 Power and Energy
11.3.8 Metal and Mining
11.3.9 Pulp and Paper
11.3.10 Others
12.Smart Meter Market - By Geography (Market Size -$Million/Billion)
12.1 Europe
12.1.1 Germany
12.1.2 France
12.1.3 Italy
12.1.4 Spain
12.1.5 Netherlands
12.1.6 Russia
12.1.7 UK
12.1.8 Others
12.2 North America
12.2.1 U.S
12.2.2 Canada
12.2.3 Mexico
12.3 South America
12.3.1 Brazil
12.3.2 Argentina
12.3.3 Chile
12.3.4 Colombia
12.3.5 Others
12.4 APAC
12.4.1 China
12.4.2 Japan
12.4.3 South Korea
12.4.4 India
12.4.5 Australia
12.4.6 Indonesia
12.4.7 Malaysia
12.4.8 Others
12.5 RoW
12.5.1 Middle East
12.5.2 Africa
13.Smart Meter Market - Market Entropy
13.1 New product launches
13.2 M&A's, collaborations, JVs and partnerships
14.Smart Meter Market – Industry Competition Landscape
14.1 Market Share Global
14.2 Market Share by Region
14.3 Market Share by Meter Type
14.4 Market Share by Country
14.5 Competition Matrix
15.Smart Meter Market – Key Company List by Country Premium
16.Smart Meter Market - Company Analysis
16.1 Itron Inc.
16.2 Landis+Gyr
16.3 Sensus/Xylem
16.4 Schneider Electric SA
16.5 Siemens AG
16.6 ABB
16.7 Diehl
16.8 Honeywell/Elster Group
16.9 Kamstrup
16.10 Zenner
"Financials to the Private Companies would be provided on best-effort basis."
List of Tables
Table 1: Smart Meters Market Overview 2021-2026
Table 2: Smart Meters Market Leader Analysis 2018-2019 (US$)
Table 3: Smart Meters Market Product Analysis 2018-2019 (US$)
Table 4: Smart Meters Market End User Analysis 2018-2019 (US$)
Table 5: Smart Meters Market Patent Analysis 2013-2018* (US$)
Table 6: Smart Meters Market Financial Analysis 2018-2019 (US$)
Table 7: Smart Meters Market Driver Analysis 2018-2019 (US$)
Table 8: Smart Meters Market Challenges Analysis 2018-2019 (US$)
Table 9: Smart Meters Market Constraint Analysis 2018-2019 (US$)
Table 10: Smart Meters Market Supplier Bargaining Power Analysis 2018-2019 (US$)
Table 11: Smart Meters Market Buyer Bargaining Power Analysis 2018-2019 (US$)
Table 12: Smart Meters Market Threat of Substitutes Analysis 2018-2019 (US$)
Table 13: Smart Meters Market Threat of New Entrants Analysis 2018-2019 (US$)
Table 14: Smart Meters Market Degree of Competition Analysis 2018-2019 (US$)
Table 15: Smart Meters Market Value Chain Analysis 2018-2019 (US$)
Table 16: Smart Meters Market Pricing Analysis 2021-2026 (US$)
Table 17: Smart Meters Market Opportunities Analysis 2021-2026 (US$)
Table 18: Smart Meters Market Product Life Cycle Analysis 2021-2026 (US$)
Table 19: Smart Meters Market Supplier Analysis 2018-2019 (US$)
Table 20: Smart Meters Market Distributor Analysis 2018-2019 (US$)
Table 21: Smart Meters Market Trend Analysis 2018-2019 (US$)
Table 22: Smart Meters Market Size 2018 (US$)
Table 23: Smart Meters Market Forecast Analysis 2021-2026 (US$)
Table 24: Smart Meters Market Sales Forecast Analysis 2021-2026 (Units)
Table 25: Smart Meters Market, Revenue & Volume, By Type, 2021-2026 ($)
Table 26: Smart Meters Market By Type, Revenue & Volume, By Electric meter, 2021-2026 ($)
Table 27: Smart Meters Market By Type, Revenue & Volume, By Water meter, 2021-2026 ($)
Table 28: Smart Meters Market By Type, Revenue & Volume, By Gas meter
Table 29: Smart Meters Market, Revenue & Volume, By End Users, 2021-2026 ($)
Table 30: Smart Meters Market By End Users, Revenue & Volume, By Residential, 2021-2026 ($)
Table 31: Smart Meters Market By End Users, Revenue & Volume, By Commercial, 2021-2026 ($)
Table 32: Smart Meters Market By End Users, Revenue & Volume, By Industrial, 2021-2026 ($)
Table 33: North America Smart Meters Market, Revenue & Volume, By Type, 2021-2026 ($)
Table 34: North America Smart Meters Market, Revenue & Volume, By End Users, 2021-2026 ($)
Table 35: South america Smart Meters Market, Revenue & Volume, By Type, 2021-2026 ($)
Table 36: South america Smart Meters Market, Revenue & Volume, By End Users, 2021-2026 ($)
Table 37: Europe Smart Meters Market, Revenue & Volume, By Type, 2021-2026 ($)
Table 38: Europe Smart Meters Market, Revenue & Volume, By End Users, 2021-2026 ($)
Table 39: APAC Smart Meters Market, Revenue & Volume, By Type, 2021-2026 ($)
Table 40: APAC Smart Meters Market, Revenue & Volume, By End Users, 2021-2026 ($)
Table 41: Middle East & Africa Smart Meters Market, Revenue & Volume, By Type, 2021-2026 ($)
Table 42: Middle East & Africa Smart Meters Market, Revenue & Volume, By End Users, 2021-2026 ($)
Table 43: Russia Smart Meters Market, Revenue & Volume, By Type, 2021-2026 ($)
Table 44: Russia Smart Meters Market, Revenue & Volume, By End Users, 2021-2026 ($)
Table 45: Israel Smart Meters Market, Revenue & Volume, By Type, 2021-2026 ($)
Table 46: Israel Smart Meters Market, Revenue & Volume, By End Users, 2021-2026 ($)
Table 47: Top Companies 2018 (US$)Smart Meters Market, Revenue & Volume
Table 48: Product Launch 2018-2019Smart Meters Market, Revenue & Volume
Table 49: Mergers & Acquistions 2018-2019Smart Meters Market, Revenue & Volume
List of Figures
Figure 1: Overview of Smart Meters Market 2021-2026
Figure 2: Market Share Analysis for Smart Meters Market 2018 (US$)
Figure 3: Product Comparison in Smart Meters Market 2018-2019 (US$)
Figure 4: End User Profile for Smart Meters Market 2018-2019 (US$)
Figure 5: Patent Application and Grant in Smart Meters Market 2013-2018* (US$)
Figure 6: Top 5 Companies Financial Analysis in Smart Meters Market 2018-2019 (US$)
Figure 7: Market Entry Strategy in Smart Meters Market 2018-2019
Figure 8: Ecosystem Analysis in Smart Meters Market 2018
Figure 9: Average Selling Price in Smart Meters Market 2021-2026
Figure 10: Top Opportunites in Smart Meters Market 2018-2019
Figure 11: Market Life Cycle Analysis in Smart Meters Market
Figure 12: GlobalBy TypeSmart Meters Market Revenue, 2021-2026 ($)
Figure 13: GlobalBy End UsersSmart Meters Market Revenue, 2021-2026 ($)
Figure 14: Global Smart Meters Market - By Geography
Figure 15: Global Smart Meters Market Value & Volume, By Geography, 2021-2026 ($)
Figure 16: Global Smart Meters Market CAGR, By Geography, 2021-2026 (%)
Figure 17: North America Smart Meters Market Value & Volume, 2021-2026 ($)
Figure 18: US Smart Meters Market Value & Volume, 2021-2026 ($)
Figure 19: US GDP and Population, 2018-2019 ($)
Figure 20: US GDP – Composition of 2018, By Sector of Origin
Figure 21: US Export and Import Value & Volume, 2018-2019 ($)
Figure 22: Canada Smart Meters Market Value & Volume, 2021-2026 ($)
Figure 23: Canada GDP and Population, 2018-2019 ($)
Figure 24: Canada GDP – Composition of 2018, By Sector of Origin
Figure 25: Canada Export and Import Value & Volume, 2018-2019 ($)
Figure 26: Mexico Smart Meters Market Value & Volume, 2021-2026 ($)
Figure 27: Mexico GDP and Population, 2018-2019 ($)
Figure 28: Mexico GDP – Composition of 2018, By Sector of Origin
Figure 29: Mexico Export and Import Value & Volume, 2018-2019 ($)
Figure 30: South America Smart Meters Market Value & Volume, 2021-2026 ($)
Figure 31: Brazil Smart Meters Market Value & Volume, 2021-2026 ($)
Figure 32: Brazil GDP and Population, 2018-2019 ($)
Figure 33: Brazil GDP – Composition of 2018, By Sector of Origin
Figure 34: Brazil Export and Import Value & Volume, 2018-2019 ($)
Figure 35: Venezuela Smart Meters Market Value & Volume, 2021-2026 ($)
Figure 36: Venezuela GDP and Population, 2018-2019 ($)
Figure 37: Venezuela GDP – Composition of 2018, By Sector of Origin
Figure 38: Venezuela Export and Import Value & Volume, 2018-2019 ($)
Figure 39: Argentina Smart Meters Market Value & Volume, 2021-2026 ($)
Figure 40: Argentina GDP and Population, 2018-2019 ($)
Figure 41: Argentina GDP – Composition of 2018, By Sector of Origin
Figure 42: Argentina Export and Import Value & Volume, 2018-2019 ($)
Figure 43: Ecuador Smart Meters Market Value & Volume, 2021-2026 ($)
Figure 44: Ecuador GDP and Population, 2018-2019 ($)
Figure 45: Ecuador GDP – Composition of 2018, By Sector of Origin
Figure 46: Ecuador Export and Import Value & Volume, 2018-2019 ($)
Figure 47: Peru Smart Meters Market Value & Volume, 2021-2026 ($)
Figure 48: Peru GDP and Population, 2018-2019 ($)
Figure 49: Peru GDP – Composition of 2018, By Sector of Origin
Figure 50: Peru Export and Import Value & Volume, 2018-2019 ($)
Figure 51: Colombia Smart Meters Market Value & Volume, 2021-2026 ($)
Figure 52: Colombia GDP and Population, 2018-2019 ($)
Figure 53: Colombia GDP – Composition of 2018, By Sector of Origin
Figure 54: Colombia Export and Import Value & Volume, 2018-2019 ($)
Figure 55: Costa Rica Smart Meters Market Value & Volume, 2021-2026 ($)
Figure 56: Costa Rica GDP and Population, 2018-2019 ($)
Figure 57: Costa Rica GDP – Composition of 2018, By Sector of Origin
Figure 58: Costa Rica Export and Import Value & Volume, 2018-2019 ($)
Figure 59: Europe Smart Meters Market Value & Volume, 2021-2026 ($)
Figure 60: U.K Smart Meters Market Value & Volume, 2021-2026 ($)
Figure 61: U.K GDP and Population, 2018-2019 ($)
Figure 62: U.K GDP – Composition of 2018, By Sector of Origin
Figure 63: U.K Export and Import Value & Volume, 2018-2019 ($)
Figure 64: Germany Smart Meters Market Value & Volume, 2021-2026 ($)
Figure 65: Germany GDP and Population, 2018-2019 ($)
Figure 66: Germany GDP – Composition of 2018, By Sector of Origin
Figure 67: Germany Export and Import Value & Volume, 2018-2019 ($)
Figure 68: Italy Smart Meters Market Value & Volume, 2021-2026 ($)
Figure 69: Italy GDP and Population, 2018-2019 ($)
Figure 70: Italy GDP – Composition of 2018, By Sector of Origin
Figure 71: Italy Export and Import Value & Volume, 2018-2019 ($)
Figure 72: France Smart Meters Market Value & Volume, 2021-2026 ($)
Figure 73: France GDP and Population, 2018-2019 ($)
Figure 74: France GDP – Composition of 2018, By Sector of Origin
Figure 75: France Export and Import Value & Volume, 2018-2019 ($)
Figure 76: Netherlands Smart Meters Market Value & Volume, 2021-2026 ($)
Figure 77: Netherlands GDP and Population, 2018-2019 ($)
Figure 78: Netherlands GDP – Composition of 2018, By Sector of Origin
Figure 79: Netherlands Export and Import Value & Volume, 2018-2019 ($)
Figure 80: Belgium Smart Meters Market Value & Volume, 2021-2026 ($)
Figure 81: Belgium GDP and Population, 2018-2019 ($)
Figure 82: Belgium GDP – Composition of 2018, By Sector of Origin
Figure 83: Belgium Export and Import Value & Volume, 2018-2019 ($)
Figure 84: Spain Smart Meters Market Value & Volume, 2021-2026 ($)
Figure 85: Spain GDP and Population, 2018-2019 ($)
Figure 86: Spain GDP – Composition of 2018, By Sector of Origin
Figure 87: Spain Export and Import Value & Volume, 2018-2019 ($)
Figure 88: Denmark Smart Meters Market Value & Volume, 2021-2026 ($)
Figure 89: Denmark GDP and Population, 2018-2019 ($)
Figure 90: Denmark GDP – Composition of 2018, By Sector of Origin
Figure 91: Denmark Export and Import Value & Volume, 2018-2019 ($)
Figure 92: APAC Smart Meters Market Value & Volume, 2021-2026 ($)
Figure 93: China Smart Meters Market Value & Volume, 2021-2026
Figure 94: China GDP and Population, 2018-2019 ($)
Figure 95: China GDP – Composition of 2018, By Sector of Origin
Figure 96: China Export and Import Value & Volume, 2018-2019 ($)Smart Meters Market China Export and Import Value & Volume, 2018-2019 ($)
Figure 97: Australia Smart Meters Market Value & Volume, 2021-2026 ($)
Figure 98: Australia GDP and Population, 2018-2019 ($)
Figure 99: Australia GDP – Composition of 2018, By Sector of Origin
Figure 100: Australia Export and Import Value & Volume, 2018-2019 ($)
Figure 101: South Korea Smart Meters Market Value & Volume, 2021-2026 ($)
Figure 102: South Korea GDP and Population, 2018-2019 ($)
Figure 103: South Korea GDP – Composition of 2018, By Sector of Origin
Figure 104: South Korea Export and Import Value & Volume, 2018-2019 ($)
Figure 105: India Smart Meters Market Value & Volume, 2021-2026 ($)
Figure 106: India GDP and Population, 2018-2019 ($)
Figure 107: India GDP – Composition of 2018, By Sector of Origin
Figure 108: India Export and Import Value & Volume, 2018-2019 ($)
Figure 109: Taiwan Smart Meters Market Value & Volume, 2021-2026 ($)
Figure 110: Taiwan GDP and Population, 2018-2019 ($)
Figure 111: Taiwan GDP – Composition of 2018, By Sector of Origin
Figure 112: Taiwan Export and Import Value & Volume, 2018-2019 ($)
Figure 113: Malaysia Smart Meters Market Value & Volume, 2021-2026 ($)
Figure 114: Malaysia GDP and Population, 2018-2019 ($)
Figure 115: Malaysia GDP – Composition of 2018, By Sector of Origin
Figure 116: Malaysia Export and Import Value & Volume, 2018-2019 ($)
Figure 117: Hong Kong Smart Meters Market Value & Volume, 2021-2026 ($)
Figure 118: Hong Kong GDP and Population, 2018-2019 ($)
Figure 119: Hong Kong GDP – Composition of 2018, By Sector of Origin
Figure 120: Hong Kong Export and Import Value & Volume, 2018-2019 ($)
Figure 121: Middle East & Africa Smart Meters Market Middle East & Africa 3D Printing Market Value & Volume, 2021-2026 ($)
Figure 122: Russia Smart Meters Market Value & Volume, 2021-2026 ($)
Figure 123: Russia GDP and Population, 2018-2019 ($)
Figure 124: Russia GDP – Composition of 2018, By Sector of Origin
Figure 125: Russia Export and Import Value & Volume, 2018-2019 ($)
Figure 126: Israel Smart Meters Market Value & Volume, 2021-2026 ($)
Figure 127: Israel GDP and Population, 2018-2019 ($)
Figure 128: Israel GDP – Composition of 2018, By Sector of Origin
Figure 129: Israel Export and Import Value & Volume, 2018-2019 ($)
Figure 130: Entropy Share, By Strategies, 2018-2019* (%)Smart Meters Market
Figure 131: Developments, 2018-2019*Smart Meters Market
Figure 132: Company 1 Smart Meters Market Net Revenue, By Years, 2018-2019* ($)
Figure 133: Company 1 Smart Meters Market Net Revenue Share, By Business segments, 2018 (%)
Figure 134: Company 1 Smart Meters Market Net Sales Share, By Geography, 2018 (%)
Figure 135: Company 2 Smart Meters Market Net Revenue, By Years, 2018-2019* ($)
Figure 136: Company 2 Smart Meters Market Net Revenue Share, By Business segments, 2018 (%)
Figure 137: Company 2 Smart Meters Market Net Sales Share, By Geography, 2018 (%)
Figure 138: Company 3 Smart Meters Market Net Revenue, By Years, 2018-2019* ($)
Figure 139: Company 3 Smart Meters Market Net Revenue Share, By Business segments, 2018 (%)
Figure 140: Company 3 Smart Meters Market Net Sales Share, By Geography, 2018 (%)
Figure 141: Company 4 Smart Meters Market Net Revenue, By Years, 2018-2019* ($)
Figure 142: Company 4 Smart Meters Market Net Revenue Share, By Business segments, 2018 (%)
Figure 143: Company 4 Smart Meters Market Net Sales Share, By Geography, 2018 (%)
Figure 144: Company 5 Smart Meters Market Net Revenue, By Years, 2018-2019* ($)
Figure 145: Company 5 Smart Meters Market Net Revenue Share, By Business segments, 2018 (%)
Figure 146: Company 5 Smart Meters Market Net Sales Share, By Geography, 2018 (%)
Figure 147: Company 6 Smart Meters Market Net Revenue, By Years, 2018-2019* ($)
Figure 148: Company 6 Smart Meters Market Net Revenue Share, By Business segments, 2018 (%)
Figure 149: Company 6 Smart Meters Market Net Sales Share, By Geography, 2018 (%)
Figure 150: Company 7 Smart Meters Market Net Revenue, By Years, 2018-2019* ($)
Figure 151: Company 7 Smart Meters Market Net Revenue Share, By Business segments, 2018 (%)
Figure 152: Company 7 Smart Meters Market Net Sales Share, By Geography, 2018 (%)
Figure 153: Company 8 Smart Meters Market Net Revenue, By Years, 2018-2019* ($)
Figure 154: Company 8 Smart Meters Market Net Revenue Share, By Business segments, 2018 (%)
Figure 155: Company 8 Smart Meters Market Net Sales Share, By Geography, 2018 (%)
Figure 156: Company 9 Smart Meters Market Net Revenue, By Years, 2018-2019* ($)
Figure 157: Company 9 Smart Meters Market Net Revenue Share, By Business segments, 2018 (%)
Figure 158: Company 9 Smart Meters Market Net Sales Share, By Geography, 2018 (%)
Figure 159: Company 10 Smart Meters Market Net Revenue, By Years, 2018-2019* ($)
Figure 160: Company 10 Smart Meters Market Net Revenue Share, By Business segments, 2018 (%)
Figure 161: Company 10 Smart Meters Market Net Sales Share, By Geography, 2018 (%)
Figure 162: Company 11 Smart Meters Market Net Revenue, By Years, 2018-2019* ($)
Figure 163: Company 11 Smart Meters Market Net Revenue Share, By Business segments, 2018 (%)
Figure 164: Company 11 Smart Meters Market Net Sales Share, By Geography, 2018 (%)
Figure 165: Company 12 Smart Meters Market Net Revenue, By Years, 2018-2019* ($)
Figure 166: Company 12 Smart Meters Market Net Revenue Share, By Business segments, 2018 (%)
Figure 167: Company 12 Smart Meters Market Net Sales Share, By Geography, 2018 (%)
Figure 168: Company 13 Smart Meters Market Net Revenue, By Years, 2018-2019* ($)
Figure 169: Company 13 Smart Meters Market Net Revenue Share, By Business segments, 2018 (%)
Figure 170: Company 13 Smart Meters Market Net Sales Share, By Geography, 2018 (%)
Figure 171: Company 14 Smart Meters Market Net Revenue, By Years, 2018-2019* ($)
Figure 172: Company 14 Smart Meters Market Net Revenue Share, By Business segments, 2018 (%)
Figure 173: Company 14 Smart Meters Market Net Sales Share, By Geography, 2018 (%)
Figure 174: Company 15 Smart Meters Market Net Revenue, By Years, 2018-2019* ($)
Figure 175: Company 15 Smart Meters Market Net Revenue Share, By Business segments, 2018 (%)
Figure 176: Company 15 Smart Meters Market Net Sales Share, By Geography, 2018 (%)