 Email
Email Print
Print


Intelligent Motor Control Centers (IMCC) Market - Forecast(2024 - 2030)
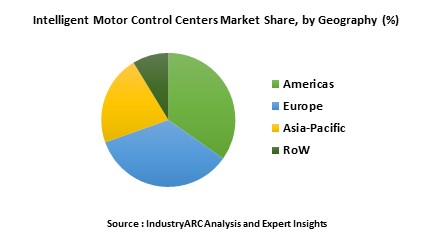
The Global Intelligent Motor Control Centers (MCC) Market revenue is $3.10 billion by 2017 and forecasted to grow at a CAGR of more than 8.60 % during 2018 to 2023. Americas region which constitutes North America and Latin American countries is the largest market for Intelligent MCC. The Americas region is the dominant market for Intelligent Motor Control Systems due to its wide range of industrial clusters and high level of manufacturing automation. Americas is the home to some of the major suppliers of Intelligent MCC such as Rockwell Automation and General Electric. During the recent years, there has been a fundamental shift in the energy outlook of the continent, mainly driven by technology, innovation, investment and new policies. The structural reform in Mexico and Brazil is creating opportunities for higher growth in the economy.
What is Intelligent Motor Control Centers Market?
Intelligent Motor Control Systems (MCC's) is a combination of innovative communication capabilities of integrated architecture with intelligent motor control devices which help to design single solution which aids to control, protect assets and communicate. Majorly, this helps in reducing costs to integrate control, information technologies, and visualization. This makes enterprises to reuse the engineering designs and to respond more quickly to market demands and mitigate the downtime and maintenance. They play an important role in the control schemes and monitoring the devices. MCCs are accelerating to include the latest component technologies and emerge those advanced technologies in giving prominent opportunity to transform the bulk data into useful information which minimizes downtime. Productivity increases over the intelligence and automation lifecycle for better decision making which ensures the operations to be safe and secure from the environment.
This report incorporates an in-depth assessment of Intelligent Motor Control Centers Market by Voltage, Components, End-User and Geography.
What are the major applications for Intelligent Motor Control Centers Market?
The various end-users assessed includes Oil & Gas, Mining & Metals, Power Generation, Chemicals, Pulp & Paper, Water & Waste water, Food & Beverages, Automotive, Ship Building & Transport. The Oil & Gas is largely influenced and used across the world with the help of advanced Intelligent Motor Control Devices. Many industries uses this IMCCs to bring optimization for the control and maintenance of different activities in the systems. The diagnostic data which is provided by the IMCCs helps the end-user industries in designing the preventive maintenance strategy which improves energy management and efficiency in their enterprises.
Market Research and Market Trends of Intelligent Motor Control Centers Market
- There has been an increasing pressure on industrial facilities to reduce overall costs, boost productivity, quality, and to improve personal safety. So, they have opted for automating and integrating facilities from the plant floor through the management process where data should meet the standards that are demanded by the market. Device-level integration with digital communication has been prominently utilized to the full extent of the electronic controls which are being installed in industrial plants today. There have been advancements in device-level status monitoring and communications which have boosted the practicality and affordability of complete plant-level integration.
- The demand for processing industries is more informative on variables such as energy, increasing at a faster rate. Hence the ability of data exchange from the motor management relay has been one of the areas of research in IMCC. Moreover, Industries have the requirement for a common communication network which communicates with IMCC's across the different departments. Right from the field devices, it levels up to the enterprise level due to which there have been developments in network facilities for IMCC's. PROFInet has become the leading industrial Ethernet protocol in the market compared to other Ethernet-based protocols because of its features such as determinism, real-time and isochronous real-time data transfer.
Who are the Major Players in Intelligent Motor Control Centers market?
The companies referred to in the market research report includes Rockwell Automation, ABB Group, Schneider Electric, Siemens AG, Mitsubishi Electric, Eaton Corporation, Allis Electric, Larsen & Toubro Limited, Pima Controls, Togami Electric and more than 20 companies.
What is our report scope?
The report incorporates in-depth assessment of the competitive landscape, product market sizing, product benchmarking, market trends, product developments, financial analysis, strategic analysis and so on to gauge the impact forces and potential opportunities of the market. Apart from this the report also includes a study of major developments in the market such as product launches, agreements, acquisitions, collaborations, mergers and so on to comprehend the prevailing market dynamics at present and its impact during the forecast period 2018-2023.
All our reports are customizable to your company needs to a certain extent, we do provide 20 free consulting hours along with purchase of each report, and this will allow you to request any additional data to customize the report to your needs.
Key Takeaways from this Report
- Evaluate market potential through analyzing growth rates (CAGR %), Volume (Units) and Value ($M) data given at country level – for product types, end use applications and by different industry verticals.
- Understand the different dynamics influencing the market – key driving factors, challenges and hidden opportunities.
- Get in-depth insights on your competitor performance – market shares, strategies, financial benchmarking, product benchmarking, SWOT and more.
- Analyze the sales and distribution channels across key geographies to improve top-line revenues.
- Understand the industry supply chain with a deep-dive on the value augmentation at each step, in order to optimize value and bring efficiencies in your processes.
- Get a quick outlook on the market entropy – M&A’s, deals, partnerships, product launches of all key players for the past 4 years.
- Evaluate the supply-demand gaps, import-export statistics and regulatory landscape for more than top 20 countries globally for the market.
1.Intelligent Motor Control Centers - Market Overview
2.Intelligent Motor Control Centers Market Executive Summary
3.Intelligent Motor Control Centers Market Landscape
3.1.Market Share Analysis
3.2.Comparative Analysis
3.2.1.Product Benchmarking
3.2.2.Company Benchmarking
3.2.3.End User profiling
3.2.4.Patent Analysis
3.2.5.Top 5 Financials Analysis
4.Intelligent Motor Control Centers Market Forces
4.1.Market Drivers
4.2.Market Constraints and Market Challenges
4.3.Attractiveness of the Industry
4.3.1.Power of Suppliers
4.3.2.Power of Customers
4.3.3.Threat of New entrants
4.3.4.Threat of Substitution
4.3.5.Degree of Competition
5.Intelligent Motor Control Centers Market – Strategic Analysis
5.1.Value Chain Analysis
5.2. Pricing Analysis
5.3.Opportunities Analysis
5.4.Product/Market Life Cycle Analysis
5.5. Suppliers and Distributors
6.Intelligent Motor Control Centers Market – By Voltage
6.1.Low Voltage
6.2.Medium Voltage
7.Intelligent Motor Control Centers - Market by Construction Standards
8.Intelligent Motor Control Centers - Market by Sales Channels
9.Intelligent Motor Control Centers - Market by Protection
10.Intelligent Motor Control Centers - Market by Key Components
10.1. Contactor Relays
10.2. Starters & Over Load Relays
10.3. Solid state components
10.4. Variable frequency drives
10.5. Soft Starters
10.5.1. Programmable Logic Controllers
10.5.2. Others
10.6. Network Components
10.7. Visualization Systems
10.8. Software
11.Intelligent Motor Control Centers Market – End-User
11.1. Oil & Gas
11.2. Mining & Metals
11.3. Power Generation
11.4. Chemicals
11.5. Pulp and Paper
11.6. Water & Waste water
11.7. Food & Beverage
11.8. Automotive, Ship Building & Transport
11.9. Cement Manufacturing Industry
11.10. Petrochemicals
11.11. Semiconductor/Electronic Manufacturing
11.12. Pharmaceutical
11.13. Others
12.Intelligent Motor Control Centers Market - By Geography
12.1. North America
12.1.1.U.S.
12.1.2.Canada
12.1.3.Mexico
12.1.4.Rest of North America
12.2.South America
12.2.1.Brazil
12.2.2.Venezuela
12.2.3.Argentina
12.2.4.Ecuador
12.2.5.Peru
12.2.6.Colombia
12.2.7.Costa Rica
12.2.8.Rest of South America
12.3.Europe
12.3.1.U.K
12.3.2.Germany
12.3.3.Italy
12.3.4.France
12.3.5.Netherlands
12.3.6.Belgium
12.3.7.Spain
12.3.8.Denmark
12.3.9.Rest of Europe
12.4.APAC
12.4.1.China
12.4.2.Australia
12.4.3.South Korea
12.4.4.India
12.4.5.Taiwan
12.4.6.Malaysia
12.4.7.Hong Kong
12.4.8.Rest of APAC
12.5.Middle East& Africa
12.5.1.Israel
12.5.2.South Africa
12.5.3.Saudi Arabia
12.6. Rest of Middle East and Africa
13. Intelligent Motor Control Centers Market Entropy
13.1.New Product Launches
13.2.M&As, Collaborations, JVs, Partnership
14.Company Profiles (Overview, Financials, SWOT Analysis, Developments, Product Portfolio)
14.1.Rockwell Automation
14.2.ABB Group
14.3.Schneider Electric
14.4.Siemens AG
14.5.Mitsubishi Electric
14.6.Eaton Corporation
14.7.Allis Electric
14.8.Larsen & Toubro Limited
14.9.Pima Controls
14.10.Togami Electric
*More than 10 Companies are profiled in this Research Report*
"*Financials would be provided on a best efforts basis for private companies"
15.Appendix
15.1.Abbreviations
15.2.Sources
15.3.Research Methodology
15.4.Bibliography
15.5.Compilation of Expert Insights
15.6.Disclaimer
List of Tables
Table1 Intelligent Motor Control Centers (IMCC) Market Overview 2021-2026
Table2 Intelligent Motor Control Centers (IMCC) Market Leader Analysis 2018-2019 (US$)
Table3 Intelligent Motor Control Centers (IMCC) MarketProduct Analysis 2018-2019 (US$)
Table4 Intelligent Motor Control Centers (IMCC) MarketEnd User Analysis 2018-2019 (US$)
Table5 Intelligent Motor Control Centers (IMCC) MarketPatent Analysis 2013-2018* (US$)
Table6 Intelligent Motor Control Centers (IMCC) MarketFinancial Analysis 2018-2019 (US$)
Table7 Intelligent Motor Control Centers (IMCC) Market Driver Analysis 2018-2019 (US$)
Table8 Intelligent Motor Control Centers (IMCC) MarketChallenges Analysis 2018-2019 (US$)
Table9 Intelligent Motor Control Centers (IMCC) MarketConstraint Analysis 2018-2019 (US$)
Table10 Intelligent Motor Control Centers (IMCC) Market Supplier Bargaining Power Analysis 2018-2019 (US$)
Table11 Intelligent Motor Control Centers (IMCC) Market Buyer Bargaining Power Analysis 2018-2019 (US$)
Table12 Intelligent Motor Control Centers (IMCC) Market Threat of Substitutes Analysis 2018-2019 (US$)
Table13 Intelligent Motor Control Centers (IMCC) Market Threat of New Entrants Analysis 2018-2019 (US$)
Table14 Intelligent Motor Control Centers (IMCC) Market Degree of Competition Analysis 2018-2019 (US$)
Table15 Intelligent Motor Control Centers (IMCC) MarketValue Chain Analysis 2018-2019 (US$)
Table16 Intelligent Motor Control Centers (IMCC) MarketPricing Analysis 2021-2026 (US$)
Table17 Intelligent Motor Control Centers (IMCC) MarketOpportunities Analysis 2021-2026 (US$)
Table18 Intelligent Motor Control Centers (IMCC) MarketProduct Life Cycle Analysis 2021-2026 (US$)
Table19 Intelligent Motor Control Centers (IMCC) MarketSupplier Analysis 2018-2019 (US$)
Table20 Intelligent Motor Control Centers (IMCC) MarketDistributor Analysis 2018-2019 (US$)
Table21 Intelligent Motor Control Centers (IMCC) Market Trend Analysis 2018-2019 (US$)
Table22 Intelligent Motor Control Centers (IMCC) Market Size 2018 (US$)
Table23 Intelligent Motor Control Centers (IMCC) Market Forecast Analysis 2021-2026 (US$)
Table24 Intelligent Motor Control Centers (IMCC) Market Sales Forecast Analysis 2021-2026 (Units)
Table25 Intelligent Motor Control Centers (IMCC) Market, Revenue & Volume,By Key Components, 2021-2026 ($)
Table26 Intelligent Motor Control Centers (IMCC) MarketBy Key Components, Revenue & Volume,By Contactor Relays, 2021-2026 ($)
Table27 Intelligent Motor Control Centers (IMCC) MarketBy Key Components, Revenue & Volume,By Starters & over Load Relays, 2021-2026 ($)
Table28 Intelligent Motor Control Centers (IMCC) MarketBy Key Components, Revenue & Volume,By Solid state components, 2021-2026 ($)
Table29 Intelligent Motor Control Centers (IMCC) MarketBy Key Components, Revenue & Volume,By Variable frequency drives, 2021-2026 ($)
Table30 Intelligent Motor Control Centers (IMCC) MarketBy Key Components, Revenue & Volume,By Soft Starters, 2021-2026 ($)
Table31 Intelligent Motor Control Centers (IMCC) Market, Revenue & Volume,By Voltage, 2021-2026 ($)
Table32 Intelligent Motor Control Centers (IMCC) MarketBy Voltage, Revenue & Volume,By Low Voltage Motors, 2021-2026 ($)
Table33 Intelligent Motor Control Centers (IMCC) MarketBy Voltage, Revenue & Volume,By Medium Voltage Motors, 2021-2026 ($)
Table34 Intelligent Motor Control Centers (IMCC) Market, Revenue & Volume,End User Industries, 2021-2026 ($)
Table35 Intelligent Motor Control Centers (IMCC) MarketEnd User Industries, Revenue & Volume,By Oil & Gas, 2021-2026 ($)
Table36 Intelligent Motor Control Centers (IMCC) MarketEnd User Industries, Revenue & Volume,By Mining & Metals, 2021-2026 ($)
Table37 Intelligent Motor Control Centers (IMCC) MarketEnd User Industries, Revenue & Volume,By Power Generation, 2021-2026 ($)
Table38 Intelligent Motor Control Centers (IMCC) MarketEnd User Industries, Revenue & Volume,By Chemicals, 2021-2026 ($)
Table39 Intelligent Motor Control Centers (IMCC) MarketEnd User Industries, Revenue & Volume,By Pulp and Paper, 2021-2026 ($)
Table40 North America Intelligent Motor Control Centers (IMCC) Market, Revenue & Volume,By Type, 2021-2026 ($)
Table41 North America Intelligent Motor Control Centers (IMCC) Market, Revenue & Volume,By Key Components, 2021-2026 ($)
Table42 North America Intelligent Motor Control Centers (IMCC) Market, Revenue & Volume,By Voltage, 2021-2026 ($)
Table43 North America Intelligent Motor Control Centers (IMCC) Market, Revenue & Volume,By Application, 2021-2026 ($)
Table44 North America Intelligent Motor Control Centers (IMCC) Market, Revenue & Volume,End User Industries, 2021-2026 ($)
Table45 South america Intelligent Motor Control Centers (IMCC) Market, Revenue & Volume,By Type, 2021-2026 ($)
Table46 South america Intelligent Motor Control Centers (IMCC) Market, Revenue & Volume,By Key Components, 2021-2026 ($)
Table47 South america Intelligent Motor Control Centers (IMCC) Market, Revenue & Volume,By Voltage, 2021-2026 ($)
Table48 South america Intelligent Motor Control Centers (IMCC) Market, Revenue & Volume,By Application, 2021-2026 ($)
Table49 South america Intelligent Motor Control Centers (IMCC) Market, Revenue & Volume,End User Industries, 2021-2026 ($)
Table50 Europe Intelligent Motor Control Centers (IMCC) Market, Revenue & Volume,By Type, 2021-2026 ($)
Table51 Europe Intelligent Motor Control Centers (IMCC) Market, Revenue & Volume,By Key Components, 2021-2026 ($)
Table52 Europe Intelligent Motor Control Centers (IMCC) Market, Revenue & Volume,By Voltage, 2021-2026 ($)
Table53 Europe Intelligent Motor Control Centers (IMCC) Market, Revenue & Volume,By Application, 2021-2026 ($)
Table54 Europe Intelligent Motor Control Centers (IMCC) Market, Revenue & Volume,End User Industries, 2021-2026 ($)
Table55 APAC Intelligent Motor Control Centers (IMCC) Market, Revenue & Volume,By Type, 2021-2026 ($)
Table56 APAC Intelligent Motor Control Centers (IMCC) Market, Revenue & Volume,By Key Components, 2021-2026 ($)
Table57 APAC Intelligent Motor Control Centers (IMCC) Market, Revenue & Volume,By Voltage, 2021-2026 ($)
Table58 APAC Intelligent Motor Control Centers (IMCC) Market, Revenue & Volume,By Application, 2021-2026 ($)
Table59 APAC Intelligent Motor Control Centers (IMCC) Market, Revenue & Volume,End User Industries, 2021-2026 ($)
Table60 Middle East & Africa Intelligent Motor Control Centers (IMCC) Market, Revenue & Volume,By Type, 2021-2026 ($)
Table61 Middle East & Africa Intelligent Motor Control Centers (IMCC) Market, Revenue & Volume,By Key Components, 2021-2026 ($)
Table62 Middle East & Africa Intelligent Motor Control Centers (IMCC) Market, Revenue & Volume,By Voltage, 2021-2026 ($)
Table63 Middle East & Africa Intelligent Motor Control Centers (IMCC) Market, Revenue & Volume,By Application, 2021-2026 ($)
Table64 Middle East & Africa Intelligent Motor Control Centers (IMCC) Market, Revenue & Volume,End User Industries, 2021-2026 ($)
Table65 Russia Intelligent Motor Control Centers (IMCC) Market, Revenue & Volume,By Type, 2021-2026 ($)
Table66 Russia Intelligent Motor Control Centers (IMCC) Market, Revenue & Volume,By Key Components, 2021-2026 ($)
Table67 Russia Intelligent Motor Control Centers (IMCC) Market, Revenue & Volume,By Voltage, 2021-2026 ($)
Table68 Russia Intelligent Motor Control Centers (IMCC) Market, Revenue & Volume,By Application, 2021-2026 ($)
Table69 Russia Intelligent Motor Control Centers (IMCC) Market, Revenue & Volume,End User Industries, 2021-2026 ($)
Table70 Israel Intelligent Motor Control Centers (IMCC) Market, Revenue & Volume,By Type, 2021-2026 ($)
Table71 Israel Intelligent Motor Control Centers (IMCC) Market, Revenue & Volume,By Key Components, 2021-2026 ($)
Table72 Israel Intelligent Motor Control Centers (IMCC) Market, Revenue & Volume,By Voltage, 2021-2026 ($)
Table73 Israel Intelligent Motor Control Centers (IMCC) Market, Revenue & Volume,By Application, 2021-2026 ($)
Table74 Israel Intelligent Motor Control Centers (IMCC) Market, Revenue & Volume,End User Industries, 2021-2026 ($)
Table75 Top Companies 2018 (US$)Intelligent Motor Control Centers (IMCC) Market, Revenue & Volume,,
Table76 Product Launch 2018-2019Intelligent Motor Control Centers (IMCC) Market, Revenue & Volume,,
List of Figures
Figure 1 Overview of Intelligent Motor Control Centers (IMCC) Market 2021-2026
Figure 2 Market Share Analysis for Intelligent Motor Control Centers (IMCC) Market 2018 (US$)
Figure 3 Product Comparison in Intelligent Motor Control Centers (IMCC) Market 2018-2019 (US$)
Figure 4 End User Profile for Intelligent Motor Control Centers (IMCC) Market 2018-2019 (US$)
Figure 5 Patent Application and Grant in Intelligent Motor Control Centers (IMCC) Market 2013-2018* (US$)
Figure 6 Top 5 Companies Financial Analysis in Intelligent Motor Control Centers (IMCC) Market 2018-2019 (US$)
Figure 7 Market Entry Strategy in Intelligent Motor Control Centers (IMCC) Market 2018-2019
Figure 8 Ecosystem Analysis in Intelligent Motor Control Centers (IMCC) Market2018
Figure 9 Average Selling Price in Intelligent Motor Control Centers (IMCC) Market 2021-2026
Figure 10 Top Opportunites in Intelligent Motor Control Centers (IMCC) Market 2018-2019
Figure 11 Market Life Cycle Analysis in Intelligent Motor Control Centers (IMCC) Market
Figure 12 GlobalBy Key ComponentsIntelligent Motor Control Centers (IMCC) Market Revenue, 2021-2026 ($)
Figure 13 GlobalBy VoltageIntelligent Motor Control Centers (IMCC) Market Revenue, 2021-2026 ($)
Figure 14 GlobalEnd User IndustriesIntelligent Motor Control Centers (IMCC) Market Revenue, 2021-2026 ($)
Figure 15 Global Intelligent Motor Control Centers (IMCC) Market - By Geography
Figure 16 Global Intelligent Motor Control Centers (IMCC) Market Value & Volume, By Geography, 2021-2026 ($)
Figure 17 Global Intelligent Motor Control Centers (IMCC) Market CAGR, By Geography, 2021-2026 (%)
Figure 18 North America Intelligent Motor Control Centers (IMCC) Market Value & Volume, 2021-2026 ($)
Figure 19 US Intelligent Motor Control Centers (IMCC) Market Value & Volume, 2021-2026 ($)
Figure 20 US GDP and Population, 2018-2019 ($)
Figure 21 US GDP – Composition of 2018, By Sector of Origin
Figure 22 US Export and Import Value & Volume, 2018-2019 ($)
Figure 23 Canada Intelligent Motor Control Centers (IMCC) Market Value & Volume, 2021-2026 ($)
Figure 24 Canada GDP and Population, 2018-2019 ($)
Figure 25 Canada GDP – Composition of 2018, By Sector of Origin
Figure 26 Canada Export and Import Value & Volume, 2018-2019 ($)
Figure 27 Mexico Intelligent Motor Control Centers (IMCC) Market Value & Volume, 2021-2026 ($)
Figure 28 Mexico GDP and Population, 2018-2019 ($)
Figure 29 Mexico GDP – Composition of 2018, By Sector of Origin
Figure 30 Mexico Export and Import Value & Volume, 2018-2019 ($)
Figure 31 South America Intelligent Motor Control Centers (IMCC) MarketSouth America 3D Printing Market Value & Volume, 2021-2026 ($)
Figure 32 Brazil Intelligent Motor Control Centers (IMCC) Market Value & Volume, 2021-2026 ($)
Figure 33 Brazil GDP and Population, 2018-2019 ($)
Figure 34 Brazil GDP – Composition of 2018, By Sector of Origin
Figure 35 Brazil Export and Import Value & Volume, 2018-2019 ($)
Figure 36 Venezuela Intelligent Motor Control Centers (IMCC) Market Value & Volume, 2021-2026 ($)
Figure 37 Venezuela GDP and Population, 2018-2019 ($)
Figure 38 Venezuela GDP – Composition of 2018, By Sector of Origin
Figure 39 Venezuela Export and Import Value & Volume, 2018-2019 ($)
Figure 40 Argentina Intelligent Motor Control Centers (IMCC) Market Value & Volume, 2021-2026 ($)
Figure 41 Argentina GDP and Population, 2018-2019 ($)
Figure 42 Argentina GDP – Composition of 2018, By Sector of Origin
Figure 43 Argentina Export and Import Value & Volume, 2018-2019 ($)
Figure 44 Ecuador Intelligent Motor Control Centers (IMCC) Market Value & Volume, 2021-2026 ($)
Figure 45 Ecuador GDP and Population, 2018-2019 ($)
Figure 46 Ecuador GDP – Composition of 2018, By Sector of Origin
Figure 47 Ecuador Export and Import Value & Volume, 2018-2019 ($)
Figure 48 Peru Intelligent Motor Control Centers (IMCC) Market Value & Volume, 2021-2026 ($)
Figure 49 Peru GDP and Population, 2018-2019 ($)
Figure 50 Peru GDP – Composition of 2018, By Sector of Origin
Figure 51 Peru Export and Import Value & Volume, 2018-2019 ($)
Figure 52 Colombia Intelligent Motor Control Centers (IMCC) Market Value & Volume, 2021-2026 ($)
Figure 53 Colombia GDP and Population, 2018-2019 ($)
Figure 54 Colombia GDP – Composition of 2018, By Sector of Origin
Figure 55 Colombia Export and Import Value & Volume, 2018-2019 ($)
Figure 56 Costa Rica Intelligent Motor Control Centers (IMCC) MarketCosta Rica 3D Printing Market Value & Volume, 2021-2026 ($)
Figure 57 Costa Rica GDP and Population, 2018-2019 ($)
Figure 58 Costa Rica GDP – Composition of 2018, By Sector of Origin
Figure 59 Costa Rica Export and Import Value & Volume, 2018-2019 ($)
Figure 60 Europe Intelligent Motor Control Centers (IMCC) Market Value & Volume, 2021-2026 ($)
Figure 61 U.K Intelligent Motor Control Centers (IMCC) Market Value & Volume, 2021-2026 ($)
Figure 62 U.K GDP and Population, 2018-2019 ($)
Figure 63 U.K GDP – Composition of 2018, By Sector of Origin
Figure 64 U.K Export and Import Value & Volume, 2018-2019 ($)
Figure 65 Germany Intelligent Motor Control Centers (IMCC) Market Value & Volume, 2021-2026 ($)
Figure 66 Germany GDP and Population, 2018-2019 ($)
Figure 67 Germany GDP – Composition of 2018, By Sector of Origin
Figure 68 Germany Export and Import Value & Volume, 2018-2019 ($)
Figure 69 Italy Intelligent Motor Control Centers (IMCC) Market Value & Volume, 2021-2026 ($)
Figure 70 Italy GDP and Population, 2018-2019 ($)
Figure 71 Italy GDP – Composition of 2018, By Sector of Origin
Figure 72 Italy Export and Import Value & Volume, 2018-2019 ($)
Figure 73 France Intelligent Motor Control Centers (IMCC) Market Value & Volume, 2021-2026 ($)
Figure 74 France GDP and Population, 2018-2019 ($)
Figure 75 France GDP – Composition of 2018, By Sector of Origin
Figure 76 France Export and Import Value & Volume, 2018-2019 ($)
Figure 77 Netherlands Intelligent Motor Control Centers (IMCC) Market Value & Volume, 2021-2026 ($)
Figure 78 Netherlands GDP and Population, 2018-2019 ($)
Figure 79 Netherlands GDP – Composition of 2018, By Sector of Origin
Figure 80 Netherlands Export and Import Value & Volume, 2018-2019 ($)
Figure 81 Belgium Intelligent Motor Control Centers (IMCC) Market Value & Volume, 2021-2026 ($)
Figure 82 Belgium GDP and Population, 2018-2019 ($)
Figure 83 Belgium GDP – Composition of 2018, By Sector of Origin
Figure 84 Belgium Export and Import Value & Volume, 2018-2019 ($)
Figure 85 Spain Intelligent Motor Control Centers (IMCC) Market Value & Volume, 2021-2026 ($)
Figure 86 Spain GDP and Population, 2018-2019 ($)
Figure 87 Spain GDP – Composition of 2018, By Sector of Origin
Figure 88 Spain Export and Import Value & Volume, 2018-2019 ($)
Figure 89 Denmark Intelligent Motor Control Centers (IMCC) Market Value & Volume, 2021-2026 ($)
Figure 90 Denmark GDP and Population, 2018-2019 ($)
Figure 91 Denmark GDP – Composition of 2018, By Sector of Origin
Figure 92 Denmark Export and Import Value & Volume, 2018-2019 ($)
Figure 93 APAC Intelligent Motor Control Centers (IMCC) Market Value & Volume, 2021-2026 ($)
Figure 94 China Intelligent Motor Control Centers (IMCC) MarketValue & Volume, 2021-2026
Figure 95 China GDP and Population, 2018-2019 ($)
Figure 96 China GDP – Composition of 2018, By Sector of Origin
Figure 97 China Export and Import Value & Volume, 2018-2019 ($)Intelligent Motor Control Centers (IMCC) MarketChina Export and Import Value & Volume, 2018-2019 ($)
Figure 98 Australia Intelligent Motor Control Centers (IMCC) Market Value & Volume, 2021-2026 ($)
Figure 99 Australia GDP and Population, 2018-2019 ($)
Figure 100 Australia GDP – Composition of 2018, By Sector of Origin
Figure 101 Australia Export and Import Value & Volume, 2018-2019 ($)
Figure 102 South Korea Intelligent Motor Control Centers (IMCC) Market Value & Volume, 2021-2026 ($)
Figure 103 South Korea GDP and Population, 2018-2019 ($)
Figure 104 South Korea GDP – Composition of 2018, By Sector of Origin
Figure 105 South Korea Export and Import Value & Volume, 2018-2019 ($)
Figure 106 India Intelligent Motor Control Centers (IMCC) Market Value & Volume, 2021-2026 ($)
Figure 107 India GDP and Population, 2018-2019 ($)
Figure 108 India GDP – Composition of 2018, By Sector of Origin
Figure 109 India Export and Import Value & Volume, 2018-2019 ($)
Figure 110 Taiwan Intelligent Motor Control Centers (IMCC) MarketTaiwan 3D Printing Market Value & Volume, 2021-2026 ($)
Figure 111 Taiwan GDP and Population, 2018-2019 ($)
Figure 112 Taiwan GDP – Composition of 2018, By Sector of Origin
Figure 113 Taiwan Export and Import Value & Volume, 2018-2019 ($)
Figure 114 Malaysia Intelligent Motor Control Centers (IMCC) MarketMalaysia 3D Printing Market Value & Volume, 2021-2026 ($)
Figure 115 Malaysia GDP and Population, 2018-2019 ($)
Figure 116 Malaysia GDP – Composition of 2018, By Sector of Origin
Figure 117 Malaysia Export and Import Value & Volume, 2018-2019 ($)
Figure 118 Hong Kong Intelligent Motor Control Centers (IMCC) MarketHong Kong 3D Printing Market Value & Volume, 2021-2026 ($)
Figure 119 Hong Kong GDP and Population, 2018-2019 ($)
Figure 120 Hong Kong GDP – Composition of 2018, By Sector of Origin
Figure 121 Hong Kong Export and Import Value & Volume, 2018-2019 ($)
Figure 122 Middle East & Africa Intelligent Motor Control Centers (IMCC) MarketMiddle East & Africa 3D Printing Market Value & Volume, 2021-2026 ($)
Figure 123 Russia Intelligent Motor Control Centers (IMCC) MarketRussia 3D Printing Market Value & Volume, 2021-2026 ($)
Figure 124 Russia GDP and Population, 2018-2019 ($)
Figure 125 Russia GDP – Composition of 2018, By Sector of Origin
Figure 126 Russia Export and Import Value & Volume, 2018-2019 ($)
Figure 127 Israel Intelligent Motor Control Centers (IMCC) Market Value & Volume, 2021-2026 ($)
Figure 128 Israel GDP and Population, 2018-2019 ($)
Figure 129 Israel GDP – Composition of 2018, By Sector of Origin
Figure 130 Israel Export and Import Value & Volume, 2018-2019 ($)
Figure 131 Entropy Share, By Strategies, 2018-2019* (%)Intelligent Motor Control Centers (IMCC) Market
Figure 132 Developments, 2018-2019*Intelligent Motor Control Centers (IMCC) Market
Figure 133 Company 1 Intelligent Motor Control Centers (IMCC) Market Net Revenue, By Years, 2018-2019* ($)
Figure 134 Company 1 Intelligent Motor Control Centers (IMCC) Market Net Revenue Share, By Business segments, 2018 (%)
Figure 135 Company 1 Intelligent Motor Control Centers (IMCC) Market Net Sales Share, By Geography, 2018 (%)
Figure 136 Company 2 Intelligent Motor Control Centers (IMCC) Market Net Revenue, By Years, 2018-2019* ($)
Figure 137 Company 2 Intelligent Motor Control Centers (IMCC) Market Net Revenue Share, By Business segments, 2018 (%)
Figure 138 Company 2 Intelligent Motor Control Centers (IMCC) Market Net Sales Share, By Geography, 2018 (%)
Figure 139 Company 3Intelligent Motor Control Centers (IMCC) Market Net Revenue, By Years, 2018-2019* ($)
Figure 140 Company 3Intelligent Motor Control Centers (IMCC) Market Net Revenue Share, By Business segments, 2018 (%)
Figure 141 Company 3Intelligent Motor Control Centers (IMCC) Market Net Sales Share, By Geography, 2018 (%)
Figure 142 Company 4 Intelligent Motor Control Centers (IMCC) Market Net Revenue, By Years, 2018-2019* ($)
Figure 143 Company 4 Intelligent Motor Control Centers (IMCC) Market Net Revenue Share, By Business segments, 2018 (%)
Figure 144 Company 4 Intelligent Motor Control Centers (IMCC) Market Net Sales Share, By Geography, 2018 (%)
Figure 145 Company 5 Intelligent Motor Control Centers (IMCC) Market Net Revenue, By Years, 2018-2019* ($)
Figure 146 Company 5 Intelligent Motor Control Centers (IMCC) Market Net Revenue Share, By Business segments, 2018 (%)
Figure 147 Company 5 Intelligent Motor Control Centers (IMCC) Market Net Sales Share, By Geography, 2018 (%)
Figure 148 Company 6 Intelligent Motor Control Centers (IMCC) Market Net Revenue, By Years, 2018-2019* ($)
Figure 149 Company 6 Intelligent Motor Control Centers (IMCC) Market Net Revenue Share, By Business segments, 2018 (%)
Figure 150 Company 6 Intelligent Motor Control Centers (IMCC) Market Net Sales Share, By Geography, 2018 (%)
Figure 151 Company 7 Intelligent Motor Control Centers (IMCC) Market Net Revenue, By Years, 2018-2019* ($)
Figure 152 Company 7 Intelligent Motor Control Centers (IMCC) Market Net Revenue Share, By Business segments, 2018 (%)
Figure 153 Company 7 Intelligent Motor Control Centers (IMCC) Market Net Sales Share, By Geography, 2018 (%)
Figure 154 Company 8 Intelligent Motor Control Centers (IMCC) Market Net Revenue, By Years, 2018-2019* ($)
Figure 155 Company 8 Intelligent Motor Control Centers (IMCC) Market Net Revenue Share, By Business segments, 2018 (%)
Figure 156 Company 8 Intelligent Motor Control Centers (IMCC) Market Net Sales Share, By Geography, 2018 (%)
Figure 157 Company 9 Intelligent Motor Control Centers (IMCC) Market Net Revenue, By Years, 2018-2019* ($)
Figure 158 Company 9 Intelligent Motor Control Centers (IMCC) Market Net Revenue Share, By Business segments, 2018 (%)
Figure 159 Company 9 Intelligent Motor Control Centers (IMCC) Market Net Sales Share, By Geography, 2018 (%)
Figure 160 Company 10 Intelligent Motor Control Centers (IMCC) Market Net Revenue, By Years, 2018-2019* ($)
Figure 161 Company 10 Intelligent Motor Control Centers (IMCC) Market Net Revenue Share, By Business segments, 2018 (%)
Figure 162 Company 10 Intelligent Motor Control Centers (IMCC) Market Net Sales Share, By Geography, 2018 (%)
Figure 163 Company 11 Intelligent Motor Control Centers (IMCC) Market Net Revenue, By Years, 2018-2019* ($)
Figure 164 Company 11 Intelligent Motor Control Centers (IMCC) Market Net Revenue Share, By Business segments, 2018 (%)
Figure 165 Company 11 Intelligent Motor Control Centers (IMCC) Market Net Sales Share, By Geography, 2018 (%)
Figure 166 Company 12 Intelligent Motor Control Centers (IMCC) Market Net Revenue, By Years, 2018-2019* ($)
Figure 167 Company 12 Intelligent Motor Control Centers (IMCC) Market Net Revenue Share, By Business segments, 2018 (%)
Figure 168 Company 12 Intelligent Motor Control Centers (IMCC) Market Net Sales Share, By Geography, 2018 (%)
Figure 169 Company 13Intelligent Motor Control Centers (IMCC) Market Net Revenue, By Years, 2018-2019* ($)
Figure 170 Company 13Intelligent Motor Control Centers (IMCC) Market Net Revenue Share, By Business segments, 2018 (%)
Figure 171 Company 13Intelligent Motor Control Centers (IMCC) Market Net Sales Share, By Geography, 2018 (%)
Figure 172 Company 14 Intelligent Motor Control Centers (IMCC) Market Net Revenue, By Years, 2018-2019* ($)
Figure 173 Company 14 Intelligent Motor Control Centers (IMCC) Market Net Revenue Share, By Business segments, 2018 (%)
Figure 174 Company 14 Intelligent Motor Control Centers (IMCC) Market Net Sales Share, By Geography, 2018 (%)
Figure 175 Company 15 Intelligent Motor Control Centers (IMCC) Market Net Revenue, By Years, 2018-2019* ($)
Figure 176 Company 15 Intelligent Motor Control Centers (IMCC) Market Net Revenue Share, By Business segments, 2018 (%)
Figure 177 Company 15 Intelligent Motor Control Centers (IMCC) Market Net Sales Share, By Geography, 2018 (%)