Polyurethane Elastomers Market - Forecast(2024 - 2030)

Report Code: CMR 0026 Report Format: PDF + Excel

Polyurethane Elastomers Market Overview

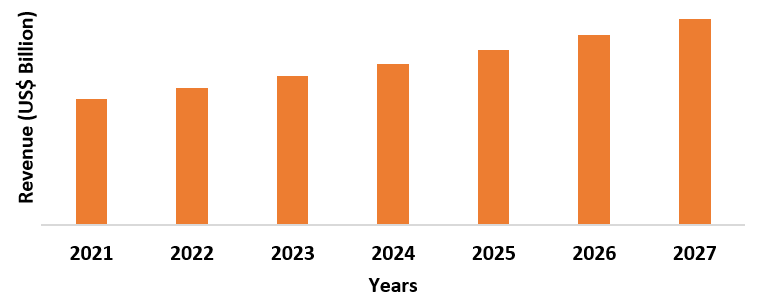
The Polyurethane Elastomers Market size is forecasted to grow at a CAGR of 4.5% during the forecast period 2022-2027 and reach US$10.8 billion by 2027. Polyurethane Elastomers can be blended into various materials which include polymethyl methacrylate, polypropylene, polystyrene, vinyl ester, polyamide and other materials. It is used in a wide range of industries such as automotive, aerospace, construction, footwear and other industries. In 2020, the COVID-19 lockdown had significantly reduced production activities as a result of the country-wise shutdown of manufacturing sites, shortage of labor and the decline of the supply and demand chain all across the world, thus, affecting the polyurethane elastomers industry. However, a steady recovery in automobile production has been witnessed across the world since 2021. Polyurethane elastomers are primarily used in the automotive industry for the production of tires and body panels of an automobile. For instance, according to the International Organization of Motor Vehicle Manufacturers (OICA), the total global automobile production reached 80.2 billion units in 2021, an increase of 3% as compared to 77.7 billion units in 2020. An increase in automotive production along with the surging demand from the construction industry is expected to drive the growth of the polyurethane elastomers market size in the upcoming years. On the other hand, fluctuating prices of raw materials may confine the growth of the market.

Polyurethane Elastomers Market Report Coverage

The “Polyurethane Elastomers Market Report – Forecast (2022-2027)” by IndustryARC, covers an in-depth analysis of the following segments in the Polyurethane Elastomers Market.

By Material Type: Thermoplastic (Polyether, Polycaprolactone, Polymethyl Methacrylate, Polypropylene, Polystyrene, Others), Thermoset (Polyamide, Vinyl Ester, Others).
By Processing Method: Injection Molding, Extrusion, Blow and Compression Molding.
By Application: Automotive Body Panels, Tires, Adhesives, Fibers, Industrial Tools, Appliances, Conveyor Belts, Sealing Gaskets, Lubricants, Consumer Products, Others.
By End-Use Industry: Transportation (Automotive (Passenger Cars, Light Commercial Vehicle, Heavy Commercial Vehicles), Aerospace (Commercial, Military, Others), Marine, Locomotive), Construction (Residential, Commercial, Industrial), Footwear, Electrical & Electronics, Adhesives & Sealants, Medical, Textile, Others.
By Geography: North America (USA, Canada and Mexico), Europe (UK, Germany, France, Italy, Netherlands, Spain, Denmark, Belgium and the Rest of Europe), Asia-Pacific (China, Japan, India, South Korea, Australia and New Zealand, Indonesia, Taiwan, Malaysia and the Rest of Asia-Pacific), South America (Brazil, Argentina, Colombia, Chile and the Rest of South America), the Rest of the World (the Middle East and Africa).

Key Takeaways

  • The injection molding segment held a significant share in The Polyurethane Elastomers Market in 2021. Its wide range of characteristics and higher efficiency made it stand out in comparison to other types of processing methods in the market.
  • Footwear industry held the largest share in the Polyurethane Elastomers Market in 2021, owing to the increasing demand for polyurethane elastomers for the production of footwear, owing to its properties such as durability, flexibility and lightness.
  • Asia-Pacific dominated the Polyurethane Elastomers Market in 2021, owing to the increasing demand for polyurethane elastomers from the footwear industry in the region.
  • A detailed analysis of strengths, weaknesses, opportunities and threats will be provided in the Polyurethane Elastomers Market Report

Figure: Asia-Pacific Polyurethane Elastomers Market Revenue, 2021-2027 (US$ Billion)

Polyurethane Elastomers Market

For More Details on This Report - Request for Sample

Polyurethane Elastomers Market Segment Analysis – by Processing Method

Injection molding held a significant Polyurethane Elastomers Market share in 2021, owing to its increasing demand due to the benefits it offers over other types of processing methods. For instance, the injection molding method aids in faster production along with higher efficiency as compared to other types of processing methods, owing to which it is commonly used in the production of polyurethane elastomers utilized in multiple industries. Moreover, polyurethane elastomers obtained through injection molding offers enhanced strength and higher flexibility in comparison to extrusion and other types of processing method. Furthermore, the injection molding method is more cost-effective in comparison to other methods and has low labor cost, high-output production and low scrap rate. Hence, all of these benefits are driving its demand over other types of processing methods, which in turn, is expected to boost the market growth during the forecast period.

Polyurethane Elastomers Market Segment Analysis – by End-Use Industry

The footwear industry held the largest Polyurethane Elastomers Market share of over 25% in 2021, owing to its increasing demand from the footwear sectors across the world. For instance, according to the World Footwear Yearbook 2021, North America and South America accounted for 1.5% and 4.6% of the total footwear production across the globe in 2021. Likewise, Europe accounted for 3.3% while Africa accounted for 3.1% of the global total footwear production in 2021. Furthermore, the total consumption of footwear in 2020 in the U.S reached 1,830 million pairs, followed by Brazil with 691 million pairs and Germany with 372 million pairs, indicating an increasing demand for footwear across the world.

In this way, such surging footwear production in multiple regions across the world is expected to increase the demand for polyurethane elastomers blended into various materials such as polypropylene, polystyrene and polyamide for the production of such footwear, owing to its durability, flexibility, comfortability and lightness. This is expected to expand the polyurethane elastomers market size during the forecast period.

Polyurethane Elastomers Market Segment Analysis – by Geography

The Asia Pacific held a dominant Polyurethane Elastomers Market share of around 30% in the year 2021. The consumption of polyurethane elastomers is particularly high in this region due to its increasing demand from the footwear sector. For instance, according to the World Footwear Yearbook 2021, Asia-Pacific held the largest share in footwear production in 2021, accounting for 87.6% of the global total. The total consumption of footwear in 2020 in China reached 3,942 million pairs, followed by India with 2,006 million pairs, Indonesia with 821 million pairs and Japan with 584 million pairs, representing an increasing demand for footwear in the region. Furthermore, Pakistan and Bangladesh accounted for 2.5% and 1.9% of the total global footwear consumption in 2020.

Polyurethane elastomers are primarily used in the footwear industry for the production of soles, slippers and insoles, owing to their range of characteristics such as high, flexibility, durability, comfort and lightness. Thus, the surging growth of the footwear sector in the region is expected to increase the demand for polyurethane elastomers, which in turn, is expected to accelerate the market growth during the forecast period. 

Polyurethane Elastomers Market Drivers

An increase in automobile production

Polyurethane elastomers are primarily used in the automotive industry for the production of tires and body panels of an automobile. Its properties such as high tensile strength, along with excellent resistance to tear, wear and abrasion makes them ideal for use in such automotive applications. According to a recent study published by the German Association of Automotive Industry during the fourth quarter of 2020, the new registration of motor vehicles reached up to 16,763 units in Europe, 37,467 units in Asia, 3080 units in South America, 17,421 units in North America, 12,733 units in Western Europe and 5180 units in other regions worldwide. Likewise, in August 2021, Ford commenced the development of its automobile plant in Germany. The new facility will be responsible for the assembly of a new electric vehicle and aims at increasing electric vehicle production in the country. Hence, an increase in production from the automotive industry is expected to increase the demand for polyurethane elastomers, owing to their above-mentioned properties. This is expected to accelerate the growth of the market in the upcoming years.

Surging demand from the construction industry

Polyurethane elastomers are commonly used in the construction industry, particularly for filling gaps within a structure. Polyurethane elastomers are mostly enfolded with adhesives & sealants materials and used in the building structure for several applications such as roofing membrane, waterproofing, carpeting, window & weather seals, wall coverings and other similar applications. For instance, according to Volvo CE, the construction sector saw an increase in construction activities across multiple regions since the fourth quarter of 2020. South America saw an increase of 12%, Asia by 39%, Europe by 20% and China by 28% in 2020. Furthermore, YIT Corporation commenced the construction of numerous residential apartment building projects in Finland, the CEE countries and Russia in December 2021, with total investments of around EUR 200 million (US$236.5 million). The projects are scheduled to be completed by the end of 2023. Hence, an increase in global construction activities is expected to increase the demand for polyurethane elastomers for use in roofing membranes, waterproofing, carpeting, window & weather seals, wall coverings and other similar applications of residential or commercial buildings. This is anticipated to drive the growth of the market in the upcoming years

Polyurethane Elastomers Market Challenges

Fluctuating prices of raw materials may confine the growth of the market

Some of the raw materials for polyurethane elastomers are obtained from crude oil. In 2020, the international benchmark for petroleum prices across the world also known as Brent crude prices decreased to US$9.12 per barrel, which was the lowest record since December 10, 1998. Likewise, in April 2020, India’s Crude Oil Basket (COB) reached US$19.90 per barrel, which was the lowest record since February 2002. During the first 11 months of the year 2020-21, the average annual price of India’s COB was around US$42.72 per barrel, which decreased by 30% more than the average COB price in 2019-20. Furthermore, as per revised estimates for 2020-21, the COB has increased by around 35% from its initial budget estimate. In this way, the uncertainty regarding the price of crude oil also increases the price of raw materials required for the production of polyurethane elastomers. Hence, such instability and fluctuating prices of raw materials may confine the growth of the polyurethane elastomers industry during the forecast period.

Polyurethane Elastomers Industry Outlook

Technology launches, acquisitions and R&D activities are key strategies adopted by players in the Polyurethane Elastomers market. The top companies in Polyurethane Elastomers Market are:

  1. Tosoh Corporation
  2. Dow
  3. BASF SE
  4. Covestro AG
  5. Huntsman International LLC
  6. LANXESS
  7. The Lubrizol Corporation
  8. Mitsubishi Chemicals
  9. Chemtura Corporation
  10. Trelleborg

Recent Developments

  • In January 2021, Lanxess launched its new energy-efficient polyurethane elastomers. The new product generates less heat and consumes less energy upon usage. It is ideal for use in applications such as machinery, testing equipment, molds, along with other goods associated with finished rubber products.
  • In November 2019, Mitsubishi Chemical Corporation acquired the thermoplastic polyurethane elastomer business of AdvanSource Biomaterials Corporation, a U.S-based company. The main motive of this acquisition was to expand and strengthen the company’s presence in the North American region.
  • In June 2019, Huntsman launched its new range of elastomers composed of polyurethane materials. It offers high performance and is specifically designed for use in the production of castors, wheels and other industrial parts that need to perform in extreme working conditions.

Relevant Reports

Polyurethanes Market – Industry Analysis, Market Size, Share, Trends, Application Analysis, Growth and Forecast Analysis

Report Code: CMR 0074

Elastomers Market – Industry Analysis, Market Size, Share, Trends, Application Analysis, Growth and Forecast Analysis

Report Code: CMR 1030

India Cast Polyurethane Elastomers Market - Industry Analysis, Market Size, Share, Trends, Application Analysis, Growth and Forecast Analysis

Report Code: CMR 1178

For more Chemicals and Materials Market reports, please click here 

1. Polyurethane Elastomers Market - Market Overview
    1.1 Definitions and Scope
2. Polyurethane Elastomers Market - Executive Summary
    2.1 Key Trends by Material Type
    2.2 Key Trends by Processing Method
    2.3 Key Trends by Application
    2.4 Key Trends by End-Use Industry
    2.5 Key Trends by Geography
3. Polyurethane Elastomers Market – Comparative analysis
    3.1 Market Share Analysis- Major Companies
    3.2 Product Benchmarking- Major Companies
    3.3 Top 5 Financials Analysis
    3.4 Patent Analysis- Major Companies
    3.5 Pricing Analysis (ASPs will be provided)
4. Polyurethane Elastomers Market - Startup companies Scenario Premium Premium
    4.1 Major startup company analysis:
        4.1.1 Investment
        4.1.2 Revenue
        4.1.3 Product portfolio
        4.1.4 Venture Capital and Funding Scenario
5. Polyurethane Elastomers Market – Industry Market Entry Scenario Premium Premium
    5.1 Regulatory Framework Overview
    5.2 New Business and Ease of Doing Business Index
    5.3 Successful Venture Profiles
    5.4 Customer Analysis – Major companies
6. Polyurethane Elastomers Market - Market Forces
    6.1 Market Drivers
    6.2 Market Constraints
    6.3 Porters Five Force Model
        6.3.1 Bargaining Power of Suppliers
        6.3.2 Bargaining Powers of Buyers
        6.3.3 Threat of New Entrants
        6.3.4 Competitive Rivalry
        6.3.5 Threat of Substitutes
7. Polyurethane Elastomers Market – Strategic Analysis
    7.1 Value/Supply Chain Analysis
    7.2 Opportunity Analysis
    7.3 Product/Market Life Cycle
    7.4 Distributor Analysis – Major Companies
8. Polyurethane Elastomers Market – by Material Type (Market Size - US$ Million/Billion)
    8.1 Thermoplastic
        8.1.1 Polyether
        8.1.2 Polycaprolactone
        8.1.3 Polymethyl Methacrylate
        8.1.4 Polypropylene
        8.1.5 Polystyrene
        8.1.6 Others
    8.2 Thermoset
        8.2.1 Polyamide
        8.2.2 Vinyl Ester
        8.2.3 Others
9. Polyurethane Elastomers Market – by Processing Method (Market Size - US$ Million/Billion)
    9.1 Injection Molding
    9.2 Extrusion
    9.3 Blow and Compression Molding
10. Polyurethane Elastomers Market – by Application (Market Size - US$ Million/Billion)
     10.1 Automotive Body Panels
     10.2 Tires
     10.3 Adhesives
     10.4 Fibers
     10.5 Industrial Tools
     10.6 Appliances
     10.7 Conveyor Belts
     10.8 Sealing Gaskets
     10.9 Lubricants
     10.10 Consumer Products
     10.11 Others
11. Polyurethane Elastomers Market- by End-Use Industry (Market Size - US$ Million/Billion)
    11.1 Transportation
        11.1.1 Automotive
            11.1.1.1 Passenger Cars
            11.1.1.2 Light Commercial Vehicle
            11.1.1.3 Heavy Commercial Vehicles
        11.1.2 Aerospace
            11.1.2.1 Commercial
            11.1.2.2 Military
            11.1.2.3 Others
        11.1.3 Marine
        11.1.4 Locomotive
        11.1.3 Building & Construction
            11.1.3.1 Residential
            11.1.3.2 Commercial
            11.1.3.3 Industrial
    11.2 Footwear
    11.3 Electrical & Electronics
    11.4 Adhesives & Sealants
    11.5 Medical
    11.6 Textile
    11.7 Others
12. Polyurethane Elastomers Market - by Geography (Market Size - US$ Million/Billion)
    12.1 North America
        12.1.1 USA
        12.1.2 Canada
        12.1.3 Mexico
    12.2 Europe
        12.2.1 UK
        12.2.2 Germany
        12.2.3 France
        12.2.4 Italy
        12.2.5 Netherlands
        12.2.6 Spain
        12.2.7 Denmark
        12.2.8 Belgium
        12.2.9 Rest of Europe
    12.3 Asia-Pacific
        12.3.1 China
        12.3.2 Japan
        12.3.3 India
        12.3.4 South Korea
        12.3.5 Australia and New Zealand
        12.3.6 Indonesia
        12.3.7 Taiwan
        12.3.8 Malaysia
        12.3.9 Rest of APAC
    12.4 South America
        12.4.1 Brazil
        12.4.2 Argentina
        12.4.3 Colombia
        12.4.4 Chile
        12.4.5 Rest of South America
    12.5 Rest of the World
        12.5.1 Middle East
            12.5.1.1 Saudi Arabia
            12.5.1.2 UAE
            12.5.1.3 Israel
            12.5.1.4 Rest of the Middle East
        12.5.2 Africa
            12.5.2.1 South Africa
            12.5.2.2 Nigeria
            12.5.2.3 Rest of Africa
13. Polyurethane Elastomers Market – Entropy
    13.1 New Product Launches
    13.2 M&As, Collaborations, JVs and Partnerships 
14. Polyurethane Elastomers Market – Industry/Segment Competition Landscape Premium
    14.1 Company Benchmarking Matrix – Major Companies
    14.2 Market Share at Global Level - Major companies
    14.3 Market Share by Key Geography - Major companies
    14.4 Market Share at Country Level - Major companies
    14.5 Market Share by Key Product Type/Product category - Major companies
15. Polyurethane Elastomers Market – Key Company List by Country Premium Premium
16. Polyurethane Elastomers Market Company Analysis - Business Overview, Product Portfolio, Financials, and Developments
    16.1 Company 1
    16.2 Company 2
    16.3 Company 3
    16.4 Company 4
    16.5 Company 5
    16.6 Company 6
    16.7 Company 7
    16.8 Company 8
    16.9 Company 9
    16.10 Company 10 and more
    * "Financials would be provided to private companies on best-efforts basis."
    * "Connect with our experts to get customized reports that best suit your requirements. Our reports include global-level data, niche markets and competitive landscape."
List of Tables

Table 1 Major Government Regulations 
Table 2 North America: Ease of Doing Business Ranking by Countries
Table 3 Europe: Ease of Doing Business Ranking by Countries
Table 4 Middle East: Ease of Doing Business Ranking by Countries
Table 5 South America: Ease of Doing Business Ranking by Countries
Table 6 APAC: Ease of Doing Business Ranking by Countries
Table 7 Africa: Ease of Doing Business Ranking by Countries
Table 8 Properties of DIPRANE 30
Table 9 U.S: Statistics of Oriented Strandboard, 2016-2018 (1000 cubic meters) 
Table 10 U.S: Statistics of Medium Density Fiberboard, 2016-2018 (1000 cubic meters) 
     

List of Figures

Figure1 Global Polyurethane elastomers Market, Revenue and Volume (2018–2024), ($M, KT)
Figure2 Global Polyurethane Elastomers Market, Revenue Share, By Product Type, 2018 (%)
Figure3 Global Polyurethane Elastomers Market, Revenue Share, By Raw Materials, 2018 (%)
Figure4 Global Polyurethane Elastomers Market CAGR, By Product Type, 2019–2024 (%)
Figure5 Global Polyurethane Elastomers Market CAGR, By Raw Materials, 2019–2024 (%)
Figure6 Global Polyurethane Elastomers Market, Revenue Share, By Application, 2018 (%)
Figure7 Global Polyurethane Elastomers Market, Revenue Share, By Region, 2018 (%)
Figure8 Global Polyurethane Elastomers Market CAGR, By Application, 2019–2024 (%)
Figure9 Global Polyurethane Elastomers Market CAGR, By Region, 2019–2024 (%)
Figure10 Drivers’ Impact Analysis
Figure11 Challenges’ Impact Analysis
Figure12 Trends’ Impact Analysis
Figure13 Global Polyurethane Elastomers Market Volume (2018–2024), (KT)
Figure14 Global Polyurethane Elastomers Market Revenue (2018–2024), ($Mn)
Figure15 Global Polyurethane Elastomers Market, Volume Share (KT), By Type (2018) (%)
Figure16 Global Polyurethane Elastomers Market, Revenue, by Raw Material, 2018 (%)
Figure17 Footwear Companies, Net Sales ($Bn), (2014-2018) 
Figure18 Polyurethane Elastomers Market, Revenue By Application, 2018, (%)
Figure19 Motor Vehicles Production, by Years, (2006-2018)
Figure20 Value of Construction Put in Place in the U.S, 2012-2018 ($Mn)
Figure21 Polyurethane Elastomers Market, Revenue ($Mn), By Geography
Figure22 Automotive Production, By Country, 2018 (‘000 Units)
Figure23 Market Concentration Analysis
Figure24 Polyurethane Elastomers Market Share Analysis, By Company 2018 (%)
Figure25 Polyurethane Elastomers Published Patents, 2014–2018
Figure26 Polyurethane Elastomers Published Patents, By Countries, 2014–2018 (%)
Figure27 Polyurethane Elastomers Published Patents, By Applicant, 2014–2018 (%)
Figure28 Lanxess AG
Figure29 Covestro AG
Figure30 Lubrizol AG (Berkshire Hathaway)
Figure31 Huntsman International LLC
Figure32 BASF SE Earnings Per Share (EPS) Polyurethane Elastomers Market, By Company
Figure33 Global Automobile Production, 2018 (Units)
Figure34 Global CO2 Emissions, By Type of Transport, 2018 (%)
Figure35 CO2 performance standards in the European Union, 2005-2018 (Reduction rate in % and CO2 in g/km)
Figure36 Top 10 Global Footwear Producing Countries, By Production and Change, 2018 (Million Pairs, %)
Figure37 Global Wind Installed Capacity, 2013-2018 (MW)
Figure38 Construction Market Growth Rate, 2018 (%)
Figure39 Commercial Construction Market Size, By Sub-Segment, 2013- 2016 ($ Billion)
Figure40 Global Spandex Production, 2000-2015 (Million Pounds)
Figure41 Crude oil Prices, 2015–2018, ($/barrel)
Figure42 Polyurethane Elastomers Market, Value Chain Analysis
Figure43 Factors Driving Changes in the Value Chain
Figure44 Polyurethane Elastomers Market, Pricing Analysis, By Type, 2018–2024 ($/Ton)
Figure45 Polyurethane Elastomers Market, Pricing Analysis, By Region, 2018 ($/Ton)
Figure46 Polyurethane Elastomers Market, Pricing Analysis, By Process, 2018 vs 2024 ($/Ton)
Figure47 Polyurethane Elastomers Market Revenue and Volume Share, By Type, 2018 (%)
Figure48 Polyurethane Elastomers Market Growth Rate- By Type, 2018-2024 (%)
Figure49 Cast Polymers: Polyurethane Elastomers Market Volume by Type, 2018-2024 (KT)
Figure50 Cast Polymers: Polyurethane Elastomers Market Revenue, by Type, 2018-2024 ($M)
Figure51 Global Footwear Production By Region, 2018, (%)
Figure52 Global Furniture Production By Region, 2018, (%)
Figure53 Thermoplastic: Polyurethane Elastomers Market Volume and Revenue by Type, 2018-2024 ($M, KT)
Figure54 World Consumers Electronics Market Share, 2018 (%) 
Figure55 Number Of Cities With More Than 50,000 People, By Region, 2018
Figure56 Consumer Electronics Products and Services Segmentation, 2018 (%) 
Figure57 North America Light Weight Vehicle Production, 2015 - 2020, (M UNITS) 
Figure58 Polyurethane Elastomers Market Growth Rate- By Process, 2018-2024 (%)
Figure59 Polyurethane Elastomers Market Revenue, By Casting, 2018-2024 ($M)
Figure60 Polyurethane Elastomers Market, By Casting, 2018-2024 (KT)
Figure61 Global Motor Vehicle Production, 2016-2018 (Units) 
Figure62 Global Major Exporters in Bumpers and Parts, 2018 (%) 
Figure63 Polyurethane Elastomers Market Revenue, By Hot Cast, 2018-2024 ($M)
Figure64 Polyurethane Elastomers Market, By Hot Cast, 2018-2024 (KT)
Figure65 Global Mining Market Revenue, 2014-2018 ($M) 
Figure66 Polyurethane Elastomers Market Revenue, By Cold Cast, 2018-2024 ($M)
Figure67 Polyurethane Elastomers Market, By Cold Cast, 2018-2024 (KT)
Figure68 Global Construction Spending, 2018 (%) 
Figure69 Global Infrastructure Investment Need, By Country, 2018 (%)
Figure70 Europe: Value of Construction New Orders By Sector, 2018 (£ million) 
Figure71 Polyurethane Elastomers Market Revenue, By Others, 2018-2024 ($M)
Figure72 Polyurethane Elastomers Market, By Others, 2018-2024 (KT)
Figure73 Polyurethane Elastomers Market Revenue, By Injection Molding, 2018-2024 ($M)
Figure74 Polyurethane Elastomers Market, By Injection Molding, 2018-2024 (KT)
Figure75 Global 3D Printing Market Revenue, 2014-2018 ($Bn) 
Figure76 Polyurethane Elastomers Market Revenue, By Extrusion, 2018-2024 ($M)
Figure77 Polyurethane Elastomers Market, By Extrusion, 2018-2024 (KT)
Figure78 Polyurethane Elastomers Market Revenue, By Others, 2018-2024 ($M)
Figure79 Polyurethane Elastomers Market, By Others, 2018-2024 (KT)
Figure80 Polyurethane Elastomers Market Growth Rate- By Raw Material, 2018-2024 (%)
Figure81 Polyurethane Elastomers Market Revenue, By Isocyanates, 2018-2024 ($Mn)
Figure82 Polyurethane Elastomers Market, By Isocyanates, 2018-2024 (KT)
Figure83 Polyurethane Elastomers Market Revenue, By Toluene Diisocyanate, 2018-2024 ($Mn)
Figure84 Polyurethane Elastomers Market, By Toluene Diisocyanate, 2018-2024 (KT)
Figure85 U.S: Consumption of TDI, 2018 (%) 
Figure86 India: Automotive Component Market Share, 2018 (%)
Figure87 Global Adhesive and Sealant Demand, By Region 2019 (‘000 MT) 
Figure88 Polyurethane Elastomers Market Revenue, By Methylene Diphenyl Diisocyanate, 2018-2024 ($Mn)
Figure89 Polyurethane Elastomers Market, By Methylene Diphenyl Diisocyanate, 2018-2024 (KT)
Figure90 Global Packaging Market Share, By Region, 2018 (%) 
Figure91 India: Automotive Component Export Share, By Region, 2018 (%) 
Figure92 Polyurethane Elastomers Market Revenue, By Paraphenylene Diisocyanate, 2018-2024 ($Mn)
Figure93 Polyurethane Elastomers Market, By Paraphenylene Diisocyanate, 2018-2024 (KT)
Figure94 Polyurethane Elastomers Market Revenue, By 1,5 Naphtylene Diisocyanate, 2018-2024 ($Mn)
Figure95 Polyurethane Elastomers Market, By 1,5 Naphtylene Diisocyanate, 2018-2024 (KT)
Figure96 India: Automotive Component Market Share, By Components, 2018 (%) 
Figure97 Global Commercial and Packaging Printing Market Share, 2018 (%) 
Figure98 Polyurethane Elastomers Market Revenue, By 1,5 Naphtylene Diisocyanate, 2018-2024 ($Mn)
Figure99 Polyurethane Elastomers Market, By 1,5 Naphtylene Diisocyanate, 2018-2024 (KT)
Figure100 Polyurethane Elastomers Market Revenue, By Polyols, 2018-2024 ($Mn)
Figure101 Polyurethane Elastomers Market, By Polyols, 2018-2024 (KT)
Figure102 Global Consumption of Polyols, 2018 (%) 
Figure103 Polyurethane Elastomers Market Revenue, By Polyether, 2018-2024 ($Mn)
Figure104 Polyurethane Elastomers Market, By Polyether, 2018-2024 (KT)
Figure105 Global Exporter of Polyether, 2018 (%) 
Figure106 Polyurethane Elastomers Market Revenue, By Polyester, 2018-2024 ($Mn)
Figure107 Polyurethane Elastomers Market, By Polyester, 2018-2024 (KT)
Figure108 Global Polyurethane Elastomers Market Revenue Share, By Additives, 2018 (%)
Figure109 Global Polyurethane Elastomers Market Growth Rate- By Additives, 2021-2026 (%)
Figure110 Fillers: Global Polyurethane Elastomers Market Volume, 2018-2024 (KT)
Figure111 Fillers: Global Polyurethane Elastomers Market Revenue, 2018-2024 ($M)
Figure112 Major Footwear Producing Countries in Pairs (2018)
Figure113 Flame Retardants: Global Polyurethane Elastomers Market Volume, 2018-2024 (KT)
Figure114 Flame Retardants: Global Polyurethane Elastomers Market Revenue, 2018-2024 ($M)
Figure115 Asia Electronics Industry Year-on-Year Growth Rate, 2015-2018 (%)
Figure116 Consumer Electronics Spending Share, By Region, 2012-2018 (%) 
Figure117 Pigments: Global Polyurethane Elastomers Market Volume, 2018-2024 (KT)
Figure118 Pigments: Global Polyurethane Elastomers Market Revenue, 2018-2024 ($M)
Figure119 Global: Projection In Annual Change In Construction Output By Region 2014-2030
Figure120 Global Apparel Market Share By Countries (2018) (%)
Figure121 Others: Global Polyurethane Elastomers Market Volume, 2018-2024 (KT)
Figure122 Others: Global Polyurethane Elastomers Market Revenue, 2018-2024 ($M)
Figure123 World Motor Vehicle Production, By Type, 2018-2019, (Units)
Figure124 Automobile Production Growth, By Region, 2013-2018 (%)
Figure125 Polyurethane Elastomers Market Growth Rate- By Application, 2021-2026 (%)
Figure126 Polyurethane Elastomers Market Volume, By Automotive, 2018-2024 (KT)
Figure127 Polyurethane Elastomers Market Revenue, By Automotive, 2018-2024 ($M)
Figure128 Global Passenger Car Production, 2018 (%)Polyurethane Elastomers Market Volume, By Interior, 2018-2024 (KT)
Figure129 Polyurethane Elastomers Market Revenue, By Interior, 2018-2024 ($M)
Figure130 Polyurethane Elastomers Market Volume, By Exterior, 2018-2024 (KT)
Figure131 Polyurethane Elastomers Market Revenue, By Exterior, 2018-2024 ($M)
Figure132 Global Passenger Car Mirror Production, 2018 and 2018
Figure133 Polyurethane Elastomers Market Volume, By Construction, 2018-2024 (KT)
Figure134 Polyurethane Elastomers Market Revenue, By Exterior, 2018-2024 ($M)
Figure135 Construction Industry Growth Rate, By Country, (2015-2020)
Figure136 Polyurethane Elastomers Market Volume, By Furniture, 2018-2024 (KT)
Figure137 Furniture : Polyurethane Elastomers Market Revenue, By Furniture, 2018-2024 ($M)
Figure138 Percentage breakdown of world furniture production, 2018 (%)
Figure139 Polyurethane Elastomers Market Volume, By Footwear, 2018-2024 (KT)
Figure140 Furniture : Polyurethane Elastomers Market Revenue, By Footwear, 2018-2024 ($M)
Figure141 Global Footwear Production, 2015-2018 (Billion Pairs)
Figure142 Polyurethane Elastomers Market Volume, By Industrial Machinery, 2018-2024 (KT)
Figure143 Polyurethane Elastomers Market Revenue, By Industrial Machinery, 2018-2024 ($M)
Figure144 Value of Manufacturers' Shipments for Industry Groups, U.S, 2018 (%)
Figure145 Polyurethane Elastomers Market Volume, By Conveyor Belts, 2018-2024 (KT)
Figure146 Polyurethane Elastomers Market Revenue, By Conveyor Belts, 2018-2024 ($M)
Figure147 Polyurethane Elastomers Market Volume, Others, 2018-2024 (KT)
Figure148 Polyurethane Elastomers Market Revenue, Others, 2018-2024 ($M)
Figure149 GDP Growth of Industrial Machinery, U.S, 2018-2020 F
Figure150 Polyurethane Elastomers Market Volume, By Oil & Gas, 2018-2024 (KT)
Figure151 Polyurethane Elastomers Market Revenue, By Oil & Gas, 2018-2024 ($M)
Figure152 Global Oil Production, 2015-2018 (Barrels)
Figure153 Polyurethane Elastomers Market Volume, By Mining, 2018-2024 (KT)
Figure154 Polyurethane Elastomers Market Revenue, By Mining, 2018-2024 ($M)
Figure155 Global Mining Production, By Country, 2016 (%)
Figure156 Polyurethane Elastomers Market Volume, By Textile, 2018-2024 (KT)
Figure157 Polyurethane Elastomers Market Revenue, By Textile, 2018-2024 ($M)
Figure158 Global Apparel Market, By Country, 2018 (%)
Figure159 Global Apparel Market, By Country, 2025 (P) (%)
Figure160 Polyurethane Elastomers Market Volume, By Packaging, 2018-2024 (KT)
Figure161 Polyurethane Elastomers Market Revenue, By Packaging, 2018-2024 ($M)
Figure162 World Packaging Industry, By Sector, 2018 (%)
Figure163 Indian Packaging Industry, By Packaging Material Breakdown, 2018 (%)
Figure164 Polyurethane Elastomers Market Volume, By Medical, 2018-2024 (KT)
Figure165 Polyurethane Elastomers Market Revenue, By Medical, 2018-2024 ($M)
Figure166 World Medical Spending Revenue, By Country, 2018 ($M)
Figure167 World Pharmaceutical Spending, By Country, 2018 (%)
Figure168 Polyurethane Elastomers Market Volume, By Sports & Leisure, 2018-2024 (KT)
Figure169 Polyurethane Elastomers Market Revenue, By Sports & Leisure, 2018-2024 ($M)
Figure170 Polyurethane Elastomers Market Volume, By Renewable Energy, 2018-2024 (KT)
Figure171 Polyurethane Elastomers Market Revenue, By Renewable Energy, 2018-2024 ($M)
Figure172 Global Renewable Energy Consumption
Figure173 Renewable Energy Share, By Region, 2018 (%)
Figure174 Polyurethane Elastomers Market Volume, By Electronics, 2018-2024 (KT)
Figure175 Polyurethane Elastomers Market Revenue, By Electronics, 2018-2024 ($M)
Figure176 Production of Global Electronics and IT Industries, Revenue
Figure177 Consumer Electronics Revenue Share, By Country, 2018-19 ($M)
Figure178 Polyurethane Elastomers Market Volume, By Others, 2018-2024 (KT)
Figure179 Polyurethane Elastomers Market Revenue, By Others, 2018-2024 ($M)
Figure180 Consumer Electronics Revenue Share, By Country, 2018-19 ($M)
Figure181 Global PU Elastomers Market Volume, by Geography, 2018 vs 2024 (KT)
Figure182 Consumption CAGR (%), 2021-2026
Figure183 North America: Polyurethane Elastomers Market Revenue Share and CAGR By Country (%)
Figure184 North America : Vehicle Production By Type (2018-2019) (Units)
Figure185 North America: Oil Production in thousands of barrels per day (2013-2018)
Figure186 US: Polyurethane Elastomers Market Volume, 2018-2024 (KT)
Figure187 US: Polyurethane Elastomers Market Revenue, 2018-2024 ($M)
Figure188 The U.S. Value of Construction: Residential Vs. Non-Residential, January 2018 - May 2018 ($Bn)
Figure189 US: Vehicle Production By Type (2018-2019) (Units)
Figure190 The U.S.: Oil Production in thousands of barrels per day (2013-2018)
Figure191 Canada: Polyurethane Elastomers Market Volume, 2018-2024 (KT)
Figure192 Canada: Polyurethane Elastomers Market Revenue, 2018-2024 ($M)
Figure193 Canada : Automotive Industry Market Size (2015-2028) ($Million)
Figure194 Canada: Vehicle Production By Type (2018-2019) (Units)
Figure195 The U.S.: Oil Production in thousands of barrels per day (2013-2018)
Figure196 Mexico: Polyurethane Elastomers Market Volume, 2018-2024 (KT)
Figure197 Mexico: Polyurethane Elastomers Market Revenue, 2018-2024 ($M)
Figure198 Mexico: Vehicle Production By Type (2018-2019) (Units)
Figure199 South America: Polyurethane Elastomers Market Revenue Share and CAGR by Country (%)
Figure200 South America: Automotive Production, 2012-2018 (Million Units)
Figure201 South America: Automotive Production, 2012-2018 (Million Units)
Figure202 Brazil: PU Elastomers Market Volume, 2018-2024 (KT)
Figure203 Brazil: PU Elastomers Market, 2018-2024 ($M)
Figure204 Brazil: Oil Production, 2012-2018 (Million Tons)
Figure205 Brazil: Footwear Industry Statistics, 2018 (No. of Pairs)
Figure206 Brazil: Automotive Production, 2013-2018 (Million Units)
Figure207 Argentina: PU Elastomers Market Volume, 2018-2024 (KT)
Figure208 Argentina: PU Elastomers Market, 2018-2024 ($M)
Figure209 Argentina: Oil and Natural Gas Production, 2012-2018 (Million Tons, Billion Cubic Meters)
Figure210 Argentina: Automotive Production, 2013-2018 (Thousand Units)
Figure211 Colombia: PU Elastomers Market Volume, 2018-2024 (KT)
Figure212 Colombia: PU Elastomers Market, 2018-2024 ($M)
Figure213 Colombia: Oil and Natural Gas Production, 2012-2018 (Million Tons, Billion Cubic Meters)
Figure214 Rest of South America: PU Elastomers Market Volume, 2018-2024 (KT)
Figure215 Rest of South America: PU Elastomers Market, 2018-2024 ($M)
Figure216 Venezuela: Oil and Natural Gas Production, 2012-2018 (Million Tons, Billion Cubic Meters)
Figure217 Europe: Polyurethane Elastomers Market Revenue Share and CAGR by Country (%)
Figure218 Europe: Automotive Production, 2012-2018 (Million Units)
Figure219 U.K.: PU Elastomers Market Volume, 2018-2024 (KT)
Figure220 U.K.: PU Elastomers Market, 2018-2024 ($M)
Figure221 U.K.: Oil and Natural Gas Production, 2012-2018 (Million Tons, Billion Cubic Meters)
Figure222 U.K.: Automotive Production, 2013-2018 (Million Units)
Figure223 Germany: PU Elastomers Market Volume, 2018-2024 (KT)
Figure224 Germany: PU Elastomers Market, 2018-2024 ($M)
Figure225 Germany: Automotive Production, 2013-2018 (Million Units)
Figure226 Germany: Machinery & Equipment Industry Revenue, 2010-2020 ($B)
Figure227 Italy: PU Elastomers Market Volume, 2018-2024 (KT)
Figure228 Italy: PU Elastomers Market, 2018-2024 ($M)
Figure229 Italy: Automotive Production, 2013-2018 (Thousand Units)
Figure230 Europe: Footwear Production Share, By Country, 2018 (%)
Figure231 France: PU Elastomers Market Volume, 2018-2024 (KT)
Figure232 France: PU Elastomers Market, 2018-2024 ($M)
Figure233 France: Automotive Production, 2013-2018 (Million Units)
Figure234 Russia: PU Elastomers Market Volume, 2018-2024 (KT)
Figure235 Russia: PU Elastomers Market, 2018-2024 ($M)
Figure236 Russia: Automotive Production, 2013-2018 (Million Units)
Figure237 Russia: Oil and Natural Gas Production, 2012-2018 (Million Tons, Billion Cubic Meters)
Figure238 Rest of Europe: PU Elastomers Market Volume, 2018-2024 (KT)
Figure239 Rest of Europe: PU Elastomers Market, 2018-2024 ($M)
Figure240 Spain: Automotive Production, 2013-2018 (Million Units)
Figure241 APAC: Polyurethane Elastomers Market Revenue Share and CAGR by Country (%)
Figure242 APAC: Automotive Production, 2012-2018 (Million Units)
Figure243 APAC: Footwear Production Share, By Country, 2018 (%)
Figure244 China: PU Elastomers Market Volume, 2018-2024 (KT)
Figure245 China: PU Elastomers Market, 2018-2024 ($M)
Figure246 China: Automotive Production, 2013-2018 (Million Units)
Figure247 China: Oil and Natural Gas Production, 2012-2018 (Million Tons, Billion Cubic Meters)
Figure248 India: PU Elastomers Market Volume, 2018-2024 (KT)
Figure249 India: PU Elastomers Market, 2018-2024 ($M)
Figure250 India: Automotive Production, 2013-2018 (Million Units)
Figure251 India: Manufacturing Sector GVA Revenue, 2012-2018 ($B)
Figure252 Japan: PU Elastomers Market Volume, 2018-2024 (KT)
Figure253 Japan: PU Elastomers Market, 2018-2024 ($M)
Figure254 Japan: Automotive Production, 2013-2018 (Million Units)
Figure255 Japan: Electronics and Information Technology Industries Revenue, 2015-2018 ($B)
Figure256 South Korea: PU Elastomers Market Volume, 2018-2024 (KT)
Figure257 South Korea: PU Elastomers Market, 2018-2024 ($M)
Figure258 South Korea: Automotive Production, 2013-2018 (Million Units)
Figure259 Australia: PU Elastomers Market Volume, 2018-2024 (KT)
Figure260 Australia: PU Elastomers Market, 2018-2024 ($M)
Figure261 Australia: Construction Output Revenue Share by Type, 2018 (%)
Figure262 Rest of APAC: PU Elastomers Market Volume, 2018-2024 (KT)
Figure263 Rest of APAC: PU Elastomers Market, 2018-2024 ($M)
Figure264 Thailand: Automotive Production, 2014-2018 (Million Units)
Figure265 RoW: Polyurethane Elastomers Market Revenue Share and CAGR By Country (%)
Figure266 Africa: Vehicle Production By Type (2018-2019) (Units)
Figure267 Middle East: Polyurethane Elastomers Market Volume, 2018-2024 (KT)
Figure268 Middle East: Polyurethane Elastomers Market Revenue, 2018-2024 ($M)
Figure269 Middle East : Construction Project Value Share(%), By Country (2018)
Figure270 Middle East : Oil Production in thousands of barrels per day (2013-2018)
Figure271 Africa: Polyurethane Elastomers Market Volume, 2018-2024 (KT)
Figure272 Africa: Polyurethane Elastomers Market Revenue, 2018-2024 ($M)
Figure273 Africa: Oil Production in thousands of barrels per day (2013-2018)
Figure274 Africa: Construction Projects Split, 2018 (%)