 Email
Email Print
Print


4D printing is one of the emerging technologies which may be attributed to an object which changes its shape over time. 4D printing alludes to taking a 3D printed object and adding the ability of transformation by embedding a program directly into the materials by themselves. 4D printing adds time to the length, width and height of the objects. The 4th dimension in 4D printing refers to the ability for material objects to alter their shape or appearance over time.
Researchers are primarily focusing on 4D printing materials, emphasizing mainly at the microscopic level. Technologies such as shape memory alloys are being produced, in which a temperature change brings about a change in shape of the objects. Newer technologies are also making use of pressurized fluids, electro active polymers, chemicals and smart materials. The report study also comprises of the demand analysis of this particular market on a global and regional scale for a five-year period of 2016-2021, both in terms of volume (Units) and revenue ($M). Need for reduction in manufacturing & process costs coupled with increasing regulations on reducing construction operational costs has been driving the market growth. However, high cost is hampering the penetration and market growth of 4D printing market.
The market is estimated based on the key attributes such as the power in the hands of producers and consumers, analysis on the inter-industry rivalry, and threats from substitutes and new entrants. The report also includes segmentation based on materials, end user industries and geography. Types of materials used include smart metal alloys, self-healing polymers, dielectric elastomers and programmable materials. The programmable materials are expected to provide the largest contribution in the global market. Based on end user industry, aerospace, military and defense, automotive and biomedical are considered to be the most prominent end users of this industry.
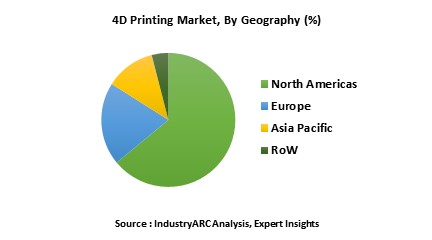
The 4D printing market has also been segmented based on geographical region: Americas, Europe, Asia-pacific and Middle-East & Africa. These geographies are further classified into countries holding prominent share in the 4D printing market for the forecast period. North American is the dominant region for 4D printing market with U.S leading the charge, the major funding agencies being US ARO and DOD. However, by the upcoming years, Europe and Asia-Pacific are also expected to have a remarkable contribution in the 4D printing market.
Competitive landscape for each of the product types is highlighted and market players are profiled with attributes of company overview, financial overview, business strategies, product portfolio and recent developments. Market shares of the key players for 2016 are provided. Drivers, challenges and constraints which control the profitability of an industry is also analyze in the report.
1. 4D Printing Market - Overview
1.1. Definitions and Scope
2. 4D Printing Market - Executive summary
2.1. Market Revenue, Market Size and Key Trends by Company
2.2. Key Trends by type of Application
2.3. Key Trends segmented by Geography
3. 4D Printing Market
3.1. Comparative analysis
3.1.1. Product Benchmarking - Top 10 companies
3.1.2. Top 5 Financials Analysis
3.1.3. Market Value split by Top 10 companies
3.1.4. Patent Analysis - Top 10 companies
3.1.5. Pricing Analysis
4. 4D Printing Market – Startup companies Scenario Premium
4.1. Top 10 startup company Analysis by
4.1.1. Investment
4.1.2. Revenue
4.1.3. Market Shares
4.1.4. Market Size and Application Analysis
4.1.5. Venture Capital and Funding Scenario
5. 4D Printing Market – Industry Market Entry Scenario Premium
5.1. Regulatory Framework Overview
5.2. New Business and Ease of Doing business index
5.3. Case studies of successful ventures
5.4. Customer Analysis – Top 10 companies
6. 4D Printing Market Forces
6.1. Drivers
6.2. Constraints
6.3. Challenges
6.4. Porters five force model
6.4.1. Bargaining power of suppliers
6.4.2. Bargaining powers of customers
6.4.3. Threat of new entrants
6.4.4. Rivalry among existing players
6.4.5. Threat of substitutes
7. 4D Printing Market -Strategic analysis
7.1. Value chain analysis
7.2. Opportunities analysis
7.3. Product life cycle
7.4. Suppliers and distributors Market Share
8. 4D Printing Market – By Materials (Market Size -$Million / $Billion)
8.1. Market Size and Market Share Analysis
8.2. Application Revenue and Trend Research
8.3. Product Segment Analysis
8.3.1. Smart Metal Alloys
8.3.2. Self-Healing Polymers
8.3.3. Dielectric Elastomers
8.3.4. Programmable Materials
8.3.4.1. Programmable Carbon Fiber
8.3.4.2. Programmable Wood
8.3.4.3. Programmable Textiles
8.3.4.4. Programmable Bio Material
8.3.5. Others
9. 4D Printing – By End User Industry(Market Size -$Million / $Billion)
9.1. Segment type Size and Market Share Analysis
9.2. Application Revenue and Trends by type of Application
9.3. Application Segment Analysis by Type
9.3.1. Aerospace
9.3.1.1. Airbus
9.3.1.2. UAVs
9.3.2. Military & Defense
9.3.3. Automotive
9.3.4. Biomedical
9.3.4.1. Dental
9.3.4.2. Medical
9.3.5. Consumer Products
9.3.6. Construction, Manufacturing & Infrastructure
9.3.7. Education
9.3.8. Others
9.3.8.1. Entertainment
9.3.8.2. Packaging
9.3.8.3. Textiles
9.3.8.4. Utilities
10. 4D Printing - By Geography (Market Size -$Million / $Billion)
10.1. 4D Printing Market - North America Segment Research
10.2. North America Market Research (Million / $Billion)
10.2.1. Segment type Size and Market Size Analysis
10.2.2. Revenue and Trends
10.2.3. Application Revenue and Trends by type of Application
10.2.4. Company Revenue and Product Analysis
10.2.5. North America Product type and Application Market Size
10.2.5.1. U.S.
10.2.5.2. Canada
10.2.5.3. Mexico
10.2.5.4. Rest of North America
10.3. 4D Printing - South America Segment Research
10.4. South America Market Research (Market Size -$Million / $Billion)
10.4.1. Segment type Size and Market Size Analysis
10.4.2. Revenue and Trends
10.4.3. Application Revenue and Trends by type of Application
10.4.4. Company Revenue and Product Analysis
10.4.5. South America Product type and Application Market Size
10.4.5.1. Brazil
10.4.5.2. Venezuela
10.4.5.3. Argentina
10.4.5.4. Ecuador
10.4.5.5. Peru
10.4.5.6. Colombia
10.4.5.7. Costa Rica
10.4.5.8. Rest of South America
10.5. 4D Printing - Europe Segment Research
10.6. Europe Market Research (Market Size -$Million / $Billion)
10.6.1. Segment type Size and Market Size Analysis
10.6.2. Revenue and Trends
10.6.3. Application Revenue and Trends by type of Application
10.6.4. Company Revenue and Product Analysis
10.6.5. Europe Segment Product type and Application Market Size
10.6.5.1. U.K
10.6.5.2. Germany
10.6.5.3. Italy
10.6.5.4. France
10.6.5.5. Netherlands
10.6.5.6. Belgium
10.6.5.7. Spain
10.6.5.8. Denmark
10.6.5.9. Rest of Europe
10.7. 4D Printing – APAC Segment Research
10.8. APAC Market Research (Market Size -$Million / $Billion)
10.8.1. Segment type Size and Market Size Analysis
10.8.2. Revenue and Trends
10.8.3. Application Revenue and Trends by type of Application
10.8.4. Company Revenue and Product Analysis
10.8.5. APAC Segment – Product type and Application Market Size
10.8.5.1. China
10.8.5.2. Australia
10.8.5.3. Japan
10.8.5.4. South Korea
10.8.5.5. India
10.8.5.6. Taiwan
10.8.5.7. Malaysia
11. 4D Printing Market - Entropy
11.1. New product launches
11.2. M&A's, collaborations, JVs and partnerships
12. 4D Printing Market – Industry / Segment Competition landscape Premium
12.1. Market Share Analysis
12.1.1. Market Share by Country- Top companies
12.1.2. Market Share by Region- Top 10 companies
12.1.3. Market Share by type of Application – Top 10 companies
12.1.4. Market Share by type of Product / Product category- Top 10 companies
12.1.5. Market Share at global level- Top 10 companies
12.1.6. Best Practices for companies
13. 4D Printing Market – Key Company List by Country Premium
14. 4D Printing Market Company Analysis
14.1. Market Share, Company Revenue, Products, M&A, Developments
14.2. Company 1
14.3. Company 2
14.4. Company 3
14.5. Company 4
14.6. Company 5
14.7. Company 6
14.8. Company 7
14.9. Company 8
14.10. Company 9
14.11. Company 10 and others
"*Financials would be provided on a best efforts basis for private companies"
15. 4D Printing Market - Appendix
15.1. Abbreviations
15.2. Sources
16. 4D Printing Market - Methodology
16.1. Research Methodology
16.1.1. Company Expert Interviews
16.1.2. Industry Databases
16.1.3. Associations
16.1.4. Company News
16.1.5. Company Annual Reports
16.1.6. Application Trends
16.1.7. New Products and Product database
16.1.8. Company Transcripts
16.1.9. R&D Trends
16.1.10. Key Opinion Leaders Interviews
16.1.11. Supply and Demand Trends
List of Tables:
Table 1: 4D Printing Market Overview 2021-2026
Table 2: 4D Printing Market Leader Analysis 2018-2019 (US$)
Table 3: 4D Printing Market Product Analysis 2018-2019 (US$)
Table 4: 4D Printing Market End User Analysis 2018-2019 (US$)
Table 5: 4D Printing Market Patent Analysis 2013-2018* (US$)
Table 6: 4D Printing Market Financial Analysis 2018-2019 (US$)
Table 7: 4D Printing Market Driver Analysis 2018-2019 (US$)
Table 8: 4D Printing Market Challenges Analysis 2018-2019 (US$)
Table 9: 4D Printing Market Constraint Analysis 2018-2019 (US$)
Table 10: 4D Printing Market Supplier Bargaining Power Analysis 2018-2019 (US$)
Table 11: 4D Printing Market Buyer Bargaining Power Analysis 2018-2019 (US$)
Table 12: 4D Printing Market Threat of Substitutes Analysis 2018-2019 (US$)
Table 13: 4D Printing Market Threat of New Entrants Analysis 2018-2019 (US$)
Table 14: 4D Printing Market Degree of Competition Analysis 2018-2019 (US$)
Table 15: 4D Printing Market Value Chain Analysis 2018-2019 (US$)
Table 16: 4D Printing Market Pricing Analysis 2021-2026 (US$)
Table 17: 4D Printing Market Opportunities Analysis 2021-2026 (US$)
Table 18: 4D Printing Market Product Life Cycle Analysis 2021-2026 (US$)
Table 19: 4D Printing Market Supplier Analysis 2018-2019 (US$)
Table 20: 4D Printing Market Distributor Analysis 2018-2019 (US$)
Table 21: 4D Printing Market Trend Analysis 2018-2019 (US$)
Table 22: 4D Printing Market Size 2018 (US$)
Table 23: 4D Printing Market Forecast Analysis 2021-2026 (US$)
Table 24: 4D Printing Market Sales Forecast Analysis 2021-2026 (Units)
Table 25: 4D Printing Market, Revenue & Volume, By Materials, 2021-2026 ($)
Table 26: 4D Printing Market By Materials, Revenue & Volume, By Smart Metal Alloys, 2021-2026 ($)
Table 27: 4D Printing Market By Materials, Revenue & Volume, By Self-Healing Polymers, 2021-2026 ($)
Table 28: 4D Printing Market By Materials, Revenue & Volume, By Dielectric Elastomers, 2021-2026 ($)
Table 29: 4D Printing Market By Materials, Revenue & Volume, By Programmable Materials, 2021-2026 ($)
Table 30: 4D Printing Market, Revenue & Volume, By End User Industry, 2021-2026 ($)
Table 31: 4D Printing Market By End User Industry, Revenue & Volume, By Aerospace, 2021-2026 ($)
Table 32: 4D Printing Market By End User Industry, Revenue & Volume, By Military & Defense, 2021-2026 ($)
Table 33: 4D Printing Market By End User Industry, Revenue & Volume, By Automotive, 2021-2026 ($)
Table 34: 4D Printing Market By End User Industry, Revenue & Volume, By Biomedical, 2021-2026 ($)
Table 35: 4D Printing Market By End User Industry, Revenue & Volume, By Consumer Products, 2021-2026 ($)
Table 36: North America 4D Printing Market, Revenue & Volume, By Materials, 2021-2026 ($)
Table 37: North America 4D Printing Market, Revenue & Volume, By End User Industry, 2021-2026 ($)
Table 38: South america 4D Printing Market, Revenue & Volume, By Materials, 2021-2026 ($)
Table 39: South america 4D Printing Market, Revenue & Volume, By End User Industry, 2021-2026 ($)
Table 40: Europe 4D Printing Market, Revenue & Volume, By Materials, 2021-2026 ($)
Table 41: Europe 4D Printing Market, Revenue & Volume, By End User Industry, 2021-2026 ($)
Table 42: APAC 4D Printing Market, Revenue & Volume, By Materials, 2021-2026 ($)
Table 43: APAC 4D Printing Market, Revenue & Volume, By End User Industry, 2021-2026 ($)
Table 44: Middle East & Africa 4D Printing Market, Revenue & Volume, By Materials, 2021-2026 ($)
Table 45: Middle East & Africa 4D Printing Market, Revenue & Volume, By End User Industry, 2021-2026 ($)
Table 46: Russia 4D Printing Market, Revenue & Volume, By Materials, 2021-2026 ($)
Table 47: Russia 4D Printing Market, Revenue & Volume, By End User Industry, 2021-2026 ($)
Table 48: Israel 4D Printing Market, Revenue & Volume, By Materials, 2021-2026 ($)
Table 49: Israel 4D Printing Market, Revenue & Volume, By End User Industry, 2021-2026 ($)
Table 50: Top Companies 2018 (US$) 4D Printing Market, Revenue & Volume
Table 51: Product Launch 2018-2019 4D Printing Market, Revenue & Volume
Table 52: Mergers & Acquistions 2018-2019 4D Printing Market, Revenue & Volume
List of Figures:
Figure 1: Overview of 4D Printing Market 2021-2026
Figure 2: Market Share Analysis for 4D Printing Market 2018 (US$)
Figure 3: Product Comparison in 4D Printing Market 2018-2019 (US$)
Figure 4: End User Profile for 4D Printing Market 2018-2019 (US$)
Figure 5: Patent Application and Grant in 4D Printing Market 2013-2018* (US$)
Figure 6: Top 5 Companies Financial Analysis in 4D Printing Market 2018-2019 (US$)
Figure 7: Market Entry Strategy in 4D Printing Market 2018-2019
Figure 8: Ecosystem Analysis in 4D Printing Market 2018
Figure 9: Average Selling Price in 4D Printing Market 2021-2026
Figure 10: Top Opportunites in 4D Printing Market 2018-2019
Figure 11: Market Life Cycle Analysis in 4D Printing Market
Figure 12: GlobalBy Materials 4D Printing Market Revenue, 2021-2026 ($)
Figure 13: GlobalBy End User Industry 4D Printing Market Revenue, 2021-2026 ($)
Figure 14: Global 4D Printing Market - By Geography
Figure 15: Global 4D Printing Market Value & Volume, By Geography, 2021-2026 ($)
Figure 16: Global 4D Printing Market CAGR, By Geography, 2021-2026 (%)
Figure 17: North America 4D Printing Market Value & Volume, 2021-2026 ($)
Figure 18: US 4D Printing Market Value & Volume, 2021-2026 ($)
Figure 19: US GDP and Population, 2018-2019 ($)
Figure 20: US GDP – Composition of 2018, By Sector of Origin
Figure 21: US Export and Import Value & Volume, 2018-2019 ($)
Figure 22: Canada 4D Printing Market Value & Volume, 2021-2026 ($)
Figure 23: Canada GDP and Population, 2018-2019 ($)
Figure 24: Canada GDP – Composition of 2018, By Sector of Origin
Figure 25: Canada Export and Import Value & Volume, 2018-2019 ($)
Figure 26: Mexico 4D Printing Market Value & Volume, 2021-2026 ($)
Figure 27: Mexico GDP and Population, 2018-2019 ($)
Figure 28: Mexico GDP – Composition of 2018, By Sector of Origin
Figure 29: Mexico Export and Import Value & Volume, 2018-2019 ($)
Figure 30: South America 4D Printing Market Value & Volume, 2021-2026 ($)
Figure 31: Brazil 4D Printing Market Value & Volume, 2021-2026 ($)
Figure 32: Brazil GDP and Population, 2018-2019 ($)
Figure 33: Brazil GDP – Composition of 2018, By Sector of Origin
Figure 34: Brazil Export and Import Value & Volume, 2018-2019 ($)
Figure 35: Venezuela 4D Printing Market Value & Volume, 2021-2026 ($)
Figure 36: Venezuela GDP and Population, 2018-2019 ($)
Figure 37: Venezuela GDP – Composition of 2018, By Sector of Origin
Figure 38: Venezuela Export and Import Value & Volume, 2018-2019 ($)
Figure 39: Argentina 4D Printing Market Value & Volume, 2021-2026 ($)
Figure 40: Argentina GDP and Population, 2018-2019 ($)
Figure 41: Argentina GDP – Composition of 2018, By Sector of Origin
Figure 42: Argentina Export and Import Value & Volume, 2018-2019 ($)
Figure 43: Ecuador 4D Printing Market Value & Volume, 2021-2026 ($)
Figure 44: Ecuador GDP and Population, 2018-2019 ($)
Figure 45: Ecuador GDP – Composition of 2018, By Sector of Origin
Figure 46: Ecuador Export and Import Value & Volume, 2018-2019 ($)
Figure 47: Peru 4D Printing Market Value & Volume, 2021-2026 ($)
Figure 48: Peru GDP and Population, 2018-2019 ($)
Figure 49: Peru GDP – Composition of 2018, By Sector of Origin
Figure 50: Peru Export and Import Value & Volume, 2018-2019 ($)
Figure 51: Colombia 4D Printing Market Value & Volume, 2021-2026 ($)
Figure 52: Colombia GDP and Population, 2018-2019 ($)
Figure 53: Colombia GDP – Composition of 2018, By Sector of Origin
Figure 54: Colombia Export and Import Value & Volume, 2018-2019 ($)
Figure 55: Costa Rica 4D Printing Market Value & Volume, 2021-2026 ($)
Figure 56: Costa Rica GDP and Population, 2018-2019 ($)
Figure 57: Costa Rica GDP – Composition of 2018, By Sector of Origin
Figure 58: Costa Rica Export and Import Value & Volume, 2018-2019 ($)
Figure 59: Europe 4D Printing Market Value & Volume, 2021-2026 ($)
Figure 60: U.K 4D Printing Market Value & Volume, 2021-2026 ($)
Figure 61: U.K GDP and Population, 2018-2019 ($)
Figure 62: U.K GDP – Composition of 2018, By Sector of Origin
Figure 63: U.K Export and Import Value & Volume, 2018-2019 ($)
Figure 64: Germany 4D Printing Market Value & Volume, 2021-2026 ($)
Figure 65: Germany GDP and Population, 2018-2019 ($)
Figure 66: Germany GDP – Composition of 2018, By Sector of Origin
Figure 67: Germany Export and Import Value & Volume, 2018-2019 ($)
Figure 68: Italy 4D Printing Market Value & Volume, 2021-2026 ($)
Figure 69: Italy GDP and Population, 2018-2019 ($)
Figure 70: Italy GDP – Composition of 2018, By Sector of Origin
Figure 71: Italy Export and Import Value & Volume, 2018-2019 ($)
Figure 72: France 4D Printing Market Value & Volume, 2021-2026 ($)
Figure 73: France GDP and Population, 2018-2019 ($)
Figure 74: France GDP – Composition of 2018, By Sector of Origin
Figure 75: France Export and Import Value & Volume, 2018-2019 ($)
Figure 76: Netherlands 4D Printing Market Value & Volume, 2021-2026 ($)
Figure 77: Netherlands GDP and Population, 2018-2019 ($)
Figure 78: Netherlands GDP – Composition of 2018, By Sector of Origin
Figure 79: Netherlands Export and Import Value & Volume, 2018-2019 ($)
Figure 80: Belgium 4D Printing Market Value & Volume, 2021-2026 ($)
Figure 81: Belgium GDP and Population, 2018-2019 ($)
Figure 82: Belgium GDP – Composition of 2018, By Sector of Origin
Figure 83: Belgium Export and Import Value & Volume, 2018-2019 ($)
Figure 84: Spain 4D Printing Market Value & Volume, 2021-2026 ($)
Figure 85: Spain GDP and Population, 2018-2019 ($)
Figure 86: Spain GDP – Composition of 2018, By Sector of Origin
Figure 87: Spain Export and Import Value & Volume, 2018-2019 ($)
Figure 88: Denmark 4D Printing Market Value & Volume, 2021-2026 ($)
Figure 89: Denmark GDP and Population, 2018-2019 ($)
Figure 90: Denmark GDP – Composition of 2018, By Sector of Origin
Figure 91: Denmark Export and Import Value & Volume, 2018-2019 ($)
Figure 92: APAC 4D Printing Market Value & Volume, 2021-2026 ($)
Figure 93: China 4D Printing Market Value & Volume, 2021-2026
Figure 94: China GDP and Population, 2018-2019 ($)
Figure 95: China GDP – Composition of 2018, By Sector of Origin
Figure 96: China Export and Import Value & Volume, 2018-2019 ($) 4D Printing Market China Export and Import Value & Volume, 2018-2019 ($)
Figure 97: Australia 4D Printing Market Value & Volume, 2021-2026 ($)
Figure 98: Australia GDP and Population, 2018-2019 ($)
Figure 99: Australia GDP – Composition of 2018, By Sector of Origin
Figure 100: Australia Export and Import Value & Volume, 2018-2019 ($)
Figure 101: South Korea 4D Printing Market Value & Volume, 2021-2026 ($)
Figure 102: South Korea GDP and Population, 2018-2019 ($)
Figure 103: South Korea GDP – Composition of 2018, By Sector of Origin
Figure 104: South Korea Export and Import Value & Volume, 2018-2019 ($)
Figure 105: India 4D Printing Market Value & Volume, 2021-2026 ($)
Figure 106: India GDP and Population, 2018-2019 ($)
Figure 107: India GDP – Composition of 2018, By Sector of Origin
Figure 108: India Export and Import Value & Volume, 2018-2019 ($)
Figure 109: Taiwan 4D Printing Market Value & Volume, 2021-2026 ($)
Figure 110: Taiwan GDP and Population, 2018-2019 ($)
Figure 111: Taiwan GDP – Composition of 2018, By Sector of Origin
Figure 112: Taiwan Export and Import Value & Volume, 2018-2019 ($)
Figure 113: Malaysia 4D Printing Market Value & Volume, 2021-2026 ($)
Figure 114: Malaysia GDP and Population, 2018-2019 ($)
Figure 115: Malaysia GDP – Composition of 2018, By Sector of Origin
Figure 116: Malaysia Export and Import Value & Volume, 2018-2019 ($)
Figure 117: Hong Kong 4D Printing Market Value & Volume, 2021-2026 ($)
Figure 118: Hong Kong GDP and Population, 2018-2019 ($)
Figure 119: Hong Kong GDP – Composition of 2018, By Sector of Origin
Figure 120: Hong Kong Export and Import Value & Volume, 2018-2019 ($)
Figure 121: Middle East & Africa 4D Printing Market Middle East & Africa 3D Printing Market Value & Volume, 2021-2026 ($)
Figure 122: Russia 4D Printing Market Value & Volume, 2021-2026 ($)
Figure 123: Russia GDP and Population, 2018-2019 ($)
Figure 124: Russia GDP – Composition of 2018, By Sector of Origin
Figure 125: Russia Export and Import Value & Volume, 2018-2019 ($)
Figure 126: Israel 4D Printing Market Value & Volume, 2021-2026 ($)
Figure 127: Israel GDP and Population, 2018-2019 ($)
Figure 128: Israel GDP – Composition of 2018, By Sector of Origin
Figure 129: Israel Export and Import Value & Volume, 2018-2019 ($)
Figure 130: Entropy Share, By Strategies, 2018-2019* (%) 4D Printing Market
Figure 131: Developments, 2018-2019* 4D Printing Market
Figure 132: Company 1 4D Printing Market Net Revenue, By Years, 2018-2019* ($)
Figure 133: Company 1 4D Printing Market Net Revenue Share, By Business segments, 2018 (%)
Figure 134: Company 1 4D Printing Market Net Sales Share, By Geography, 2018 (%)
Figure 135: Company 2 4D Printing Market Net Revenue, By Years, 2018-2019* ($)
Figure 136: Company 2 4D Printing Market Net Revenue Share, By Business segments, 2018 (%)
Figure 137: Company 2 4D Printing Market Net Sales Share, By Geography, 2018 (%)
Figure 138: Company 3 4D Printing Market Net Revenue, By Years, 2018-2019* ($)
Figure 139: Company 3 4D Printing Market Net Revenue Share, By Business segments, 2018 (%)
Figure 140: Company 3 4D Printing Market Net Sales Share, By Geography, 2018 (%)
Figure 141: Company 4 4D Printing Market Net Revenue, By Years, 2018-2019* ($)
Figure 142: Company 4 4D Printing Market Net Revenue Share, By Business segments, 2018 (%)
Figure 143: Company 4 4D Printing Market Net Sales Share, By Geography, 2018 (%)
Figure 144: Company 5 4D Printing Market Net Revenue, By Years, 2018-2019* ($)
Figure 145: Company 5 4D Printing Market Net Revenue Share, By Business segments, 2018 (%)
Figure 146: Company 5 4D Printing Market Net Sales Share, By Geography, 2018 (%)
Figure 147: Company 6 4D Printing Market Net Revenue, By Years, 2018-2019* ($)
Figure 148: Company 6 4D Printing Market Net Revenue Share, By Business segments, 2018 (%)
Figure 149: Company 6 4D Printing Market Net Sales Share, By Geography, 2018 (%)
Figure 150: Company 7 4D Printing Market Net Revenue, By Years, 2018-2019* ($)
Figure 151: Company 7 4D Printing Market Net Revenue Share, By Business segments, 2018 (%)
Figure 152: Company 7 4D Printing Market Net Sales Share, By Geography, 2018 (%)
Figure 153: Company 8 4D Printing Market Net Revenue, By Years, 2018-2019* ($)
Figure 154: Company 8 4D Printing Market Net Revenue Share, By Business segments, 2018 (%)
Figure 155: Company 8 4D Printing Market Net Sales Share, By Geography, 2018 (%)
Figure 156: Company 9 4D Printing Market Net Revenue, By Years, 2018-2019* ($)
Figure 157: Company 9 4D Printing Market Net Revenue Share, By Business segments, 2018 (%)
Figure 158: Company 9 4D Printing Market Net Sales Share, By Geography, 2018 (%)
Figure 159: Company 10 4D Printing Market Net Revenue, By Years, 2018-2019* ($)
Figure 160: Company 10 4D Printing Market Net Revenue Share, By Business segments, 2018 (%)
Figure 161: Company 10 4D Printing Market Net Sales Share, By Geography, 2018 (%)
Figure 162: Company 11 4D Printing Market Net Revenue, By Years, 2018-2019* ($)
Figure 163: Company 11 4D Printing Market Net Revenue Share, By Business segments, 2018 (%)
Figure 164: Company 11 4D Printing Market Net Sales Share, By Geography, 2018 (%)
Figure 165: Company 12 4D Printing Market Net Revenue, By Years, 2018-2019* ($)
Figure 166: Company 12 4D Printing Market Net Revenue Share, By Business segments, 2018 (%)
Figure 167: Company 12 4D Printing Market Net Sales Share, By Geography, 2018 (%)
Figure 168: Company 13 4D Printing Market Net Revenue, By Years, 2018-2019* ($)
Figure 169: Company 13 4D Printing Market Net Revenue Share, By Business segments, 2018 (%)
Figure 170: Company 13 4D Printing Market Net Sales Share, By Geography, 2018 (%)
Figure 171: Company 14 4D Printing Market Net Revenue, By Years, 2018-2019* ($)
Figure 172: Company 14 4D Printing Market Net Revenue Share, By Business segments, 2018 (%)
Figure 173: Company 14 4D Printing Market Net Sales Share, By Geography, 2018 (%)
Figure 174: Company 15 4D Printing Market Net Revenue, By Years, 2018-2019* ($)
Figure 175: Company 15 4D Printing Market Net Revenue Share, By Business segments, 2018 (%)
Figure 176: Company 15 4D Printing Market Net Sales Share, By Geography, 2018 (%)