 Email
Email Print
Print


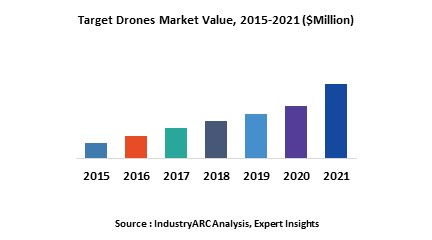
For various defense operations such as border patrolling remotely controlled unmanned vehicles are used which are known as aerial drones are used. Target drones are a subclass of aerial targets that are specifically created for Research, Development, testing & Evaluation (RDT&E) purposes. This encompasses many applications such as target and decoy, training, reconnaissance. The primary factors that have been driving the growth of this market include increase in spending of aerial target developments, initiatives for unmanned combat aerial vehicle programs and emphasis on testing & evaluation and training.
Americas is the dominating market which held a major revenue share in 2015 mainly driven by investments in Special Forces, UAVs and fighter aircraft able to carry ground attacks. APAC attributed the fastest growth rate resulting from developing nations such as China and India developing indigenous air based defense equipment to reduce their import spending on defense. This growth was followed by Europe and RoW. The global target drone market was estimated to be $ 4.05 billion in 2017 and is expected to grow with CAGR of 8.51% during the forecast period.
What are Target Drones?
Target Drones are unmanned aerial vehicles that are controlled from a remote location. Target drone is intended as a system with ground to air defense role and for training purposes. These are employed by the professionals for testing combat and for training of anti-aircraft crews. The technology has aided to the manufacturing of target drones getting more efficient and the designs are also marvelous with computer assistance.
What are the major applications for Target Drones?
Target drones are primarily being used by the armed forces to support the operational activities of new weapon systems. They are high performance unmanned aerial vehicles hence are being applied for advanced applications such as aerial filming and data sensing. Aerial mapping drones are high-end drones and are enabled with features such as GPS and RTLS embedded on the system similarly loaded aerial survey drones are also available for the military as well as commercial applications. The military generally use these target devices for training purposes and also for calibration of equipment.
Market Research and Market Trends of Target Drones Ecosystem
- Fuel cells are becoming more practical and will be employed soon as the primary source of power. Fuel cells are still expensive and are slower to respond to load changes. HES Energy Systems is a Singapore-based company which recently announced manufacturing of hydrogen fuel cells for drones that are the smallest and lightest for the power delivered or energy stored in the world.
- Aerialtronics is employing drones for industrial inspection in various fields. They have a UAV that can autonomously fly around wind turbines and cell towers, detect faults and generate reports more quickly. Artificial Intelligence enabled smart drones will be able to navigate and solve tasks more autonomously. These type of drones are increasingly gaining popularity and are expected to intervene in the target drone market soon.
- A contract to work with the Defense Department on a pilot, dubbed “Project Maven has been secured by tech giant Google. The contract is aimed at assisting the U.S. military to use the artificial intelligence systems. The project will be responsible for target drone strikes, and analyzing the massive trove of video recorded by surveillance cameras.
- In many ways modern consumer drones are becoming more advanced than far more expensive military systems. The best consumer models are now being redeployed for commercial use, often with little or no modification. And just as with smartphones, people who enjoyed playing with consumer drones realized it made sense to take them to work too. Even military users are beginning to pay attention to developments in the consumer market and regulatory bodies such as FAA have been set up to prevent misuse of different types of drones.
- Sensofusion from Finland was recently included in a group of companies selected by the U.S. FAA for a cooperative program aimed at the development of drone protection, location and prevention for airports. The objective of FAA is to find a system that can be deployed on air bases to spot, block and drop the unwanted unmanned aircraft systems before they get anywhere near the boundary fence, never mind into controlled airport airspace. The other companies added to the FAA Pathfinder Program at the same time include Gryphon Sensors and Liteye Systems.
Who are the Major Players in Target Drones market?
The players profiled in the report include Boeing (U.S.), Lockheed Martin (U.S.), Northrop, Grumman (U.S.), Meggit (U.K.), GoPro, Intel, Ambarella, FLIR, Workswell.
What is our report scope?
The report incorporates in-depth assessment of the competitive landscape, product market sizing, product benchmarking, market trends, product developments, financial analysis, strategic analysis and so on to gauge the impact forces and potential opportunities of the market. Apart from this the report also includes a study of major developments in the market such as product launches, agreements, acquisitions, collaborations, mergers and so on to comprehend the prevailing market dynamics at present and its impact during the forecast period 2018-2024.
All our reports are customizable to your company needs to a certain extent, we do provide 20 free consulting hours along with purchase of each report, and this will allow you to request any additional data to customize the report to your needs.
Key Takeaways from this Report
- Evaluate market potential through analyzing growth rates (CAGR %), Volume (Units) and Value ($M) data given at country level – for product types, end use applications and by different industry verticals.
- Understand the different dynamics influencing the market – key driving factors, challenges and hidden opportunities.
- Get in-depth insights on your competitor performance – market shares, strategies, financial benchmarking, product benchmarking, SWOT and more.
- Analyze the sales and distribution channels across key geographies to improve top-line revenues.
- Understand the industry supply chain with a deep-dive on the value augmentation at each step, in order to optimize value and bring efficiencies in your processes.
- Get a quick outlook on the market entropy – M&A’s, deals, partnerships, product launches of all key players for the past 4 years.
- Evaluate the supply-demand gaps, import-export statistics and regulatory landscape for more than top 20 countries globally for the market.
1. Target Drone Market - Overview
1.1. Definitions and Scope
2. Target Drone Market - Executive summary
2.1. Market Revenue, Market Size and Key Trends by Company
2.2. Key Trends by type of Application
2.3. Key Trends segmented by Geography
3. Target Drone Market
3.1. Comparative analysis
3.1.1. Product Benchmarking - Top 10 companies
3.1.2. Top 5 Financials Analysis
3.1.3. Market Value split by Top 10 companies
3.1.4. Patent Analysis - Top 10 companies
3.1.5. Pricing Analysis
4. Target Drone Market – Startup companies Scenario Premium
4.1. Top 10 startup company Analysis by
4.1.1. Investment
4.1.2. Revenue
4.1.3. Market Shares
4.1.4. Market Size and Application Analysis
4.1.5. Venture Capital and Funding Scenario
5. Target Drone Market – Industry Market Entry Scenario Premium
5.1. Regulatory Framework Overview
5.2. New Business and Ease of Doing business index
5.3. Case studies of successful ventures
5.4. Customer Analysis – Top 10 companies
6. Target Drone Market Forces
6.1. Drivers
6.2. Constraints
6.3. Challenges
6.4. Porters five force model
6.4.1. Bargaining power of suppliers
6.4.2. Bargaining powers of customers
6.4.3. Threat of new entrants
6.4.4. Rivalry among existing players
6.4.5. Threat of substitutes
7. Target Drone Market -Strategic analysis
7.1. Value chain analysis
7.2. Opportunities analysis
7.3. Product life cycle
7.4. Suppliers and distributors Market Share
8. Target Drone Market – By Engine Types (Market Size -$Million / $Billion)
8.1. Market Size and Market Share Analysis
8.2. Application Revenue and Trend Research
8.3. Product Segment Analysis
8.3.1. Internal Combustion Engine
8.3.2. Jet Engine
8.3.3. Others
9. Target Drone Market – By Fit (Market Size -$Million / $Billion)
9.1. Line Fit
9.2. Customized Fit
10. Target Drone Market – By Platform (Market Size -$Million / $Billion)
10.1. Aerial Targets
10.2. Ground Targets
10.3. Underwater Targets
10.4. Sea Surface Targets
11. Target Drone Market – By Target Type (Market Size -$Million / $Billion)
11.1. Full-Scaled
11.2. Sub-Scaled
11.3. Free Flying
11.4. Towing
11.5. Sporting
12. Target Drone Market – By Payloads (Market Size -$Million / $Billion)
12.1. Scoring (Vector And Scalar)
12.2. Identification Friend-Or-Foe (Iff)
12.3. Passive And Active Radar Augmentation
12.4. Infrared (Ir) Augmentation (Plume Pods)
12.5. Internally Stored Chaff
12.6. Flares
12.7. Electronics Payloads
12.7.1. GPS Navigation
12.7.2. MDI Systems
12.7.3. Video/Camera
12.8. Others
13. Target Drone Market – By Weights (Market Size -$Million / $Billion)
13.1. Class 1 (<150KG)
13.2. Class 2 (150-600KG)
13.3. Class 3 (>600KG)
14. Target Drone Market – By Dimensions (Length* Wing Span) (Market Size -$Million / $Billion)
14.1. <4*<4m
14.2. 4-6*4-6m
14.3. 4-6*1-2m
14.4. 6-10*1-3m
14.5. 6-10*4-10
14.6. >10*>10
14.7. Others
15. Target Drone Market – By Target Drones (Market Size -$Million / $Billion)
15.1. Drones
15.2. Decoy
15.3. Supersonic
16. Target Drone Market – By Target Drone Speed (Market Size -$Million / $Billion)
16.1. 46– 89 m/s (89 - 173 knots) (165 - 320 km/hr)
16.2. 46—103 m/s (89 - 200 knots) (165 - 370 km/hr)
16.3. 250-300 kmph (150 – 187 mph)
16.4. 130-464 kmph (82-290 mph)
16.5. Others
17. Target Drone Market – By Decoy Speed (Market Size -$Million / $Billion)
17.1. 46– 89 m/s (89 - 173 knots) (165 - 320 km/hr)
17.2. 46—103 m/s (89 - 200 knots) (165 - 370 km/hr)
17.3. 250-300 kmph (150 – 187 mph)
17.4. 130-464 kmph (82-290 mph)
17.5. Others
18. Target Drone – By End Use Industry(Market Size -$Million / $Billion)
18.1. Segment type Size and Market Share Analysis
18.2. Application Revenue and Trends by type of Application
18.3. Application Segment Analysis by Type
18.3.1. Defense
18.3.2. Homeland Security
19. Target Drone - By Geography (Market Size -$Million / $Billion)
19.1. Target Drone Market - North America Segment Research
19.2. North America Market Research (Million / $Billion)
19.2.1. Segment type Size and Market Size Analysis
19.2.2. Revenue and Trends
19.2.3. Application Revenue and Trends by type of Application
19.2.4. Company Revenue and Product Analysis
19.2.5. North America Product type and Application Market Size
19.2.5.1. U.S.
19.2.5.2. Canada
19.2.5.3. Mexico
19.2.5.4. Rest of North America
19.3. Target Drone - South America Segment Research
19.4. South America Market Research (Market Size -$Million / $Billion)
19.4.1. Segment type Size and Market Size Analysis
19.4.2. Revenue and Trends
19.4.3. Application Revenue and Trends by type of Application
19.4.4. Company Revenue and Product Analysis
19.4.5. South America Product type and Application Market Size
19.4.5.1. Brazil
19.4.5.2. Venezuela
19.4.5.3. Argentina
19.4.5.4. Ecuador
19.4.5.5. Peru
19.4.5.6. Colombia
19.4.5.7. Costa Rica
19.4.5.8. Rest of South America
19.5. Target Drone - Europe Segment Research
19.6. Europe Market Research (Market Size -$Million / $Billion)
19.6.1. Segment type Size and Market Size Analysis
19.6.2. Revenue and Trends
19.6.3. Application Revenue and Trends by type of Application
19.6.4. Company Revenue and Product Analysis
19.6.5. Europe Segment Product type and Application Market Size
19.6.5.1. U.K
19.6.5.2. Germany
19.6.5.3. Italy
19.6.5.4. France
19.6.5.5. Netherlands
19.6.5.6. Belgium
19.6.5.7. Spain
19.6.5.8. Denmark
19.6.5.9. Rest of Europe
19.7. Target Drone – APAC Segment Research
19.8. APAC Market Research (Market Size -$Million / $Billion)
19.8.1. Segment type Size and Market Size Analysis
19.8.2. Revenue and Trends
19.8.3. Application Revenue and Trends by type of Application
19.8.4. Company Revenue and Product Analysis
19.8.5. APAC Segment – Product type and Application Market Size
19.8.5.1. China
19.8.5.2. Australia
19.8.5.3. Japan
19.8.5.4. South Korea
19.8.5.5. India
19.8.5.6. Taiwan
19.8.5.7. Malaysia
20. Target Drone Market - Entropy
20.1. New product launches
20.2. M&A's, collaborations, JVs and partnerships
21. Target Drone Market – Industry / Segment Competition landscape Premium
21.1. Market Share Analysis
21.1.1. Market Share by Country- Top companies
21.1.2. Market Share by Region- Top 10 companies
21.1.3. Market Share by type of Application – Top 10 companies
21.1.4. Market Share by type of Product / Product category- Top 10 companies
21.1.5. Market Share at global level- Top 10 companies
21.1.6. Best Practises for companies
22. Target Drone Market – Key Company List by Country Premium
23. Target Drone Market Company Analysis
23.1. Market Share, Company Revenue, Products, M&A, Developments
23.2. Aır Affaırs Australıa Pty Ltd
23.3. Aerotargets Internatıonal, Llc
23.4. Asv Global
23.5. Aerotargets International
23.6. Airbus Se
23.7. Boeing
23.8. Bsk Defense S.A
23.9. Griffon Aerospace
23.10. Kratos Defense & Security Solutions, Inc.
23.11. Leonardo S.P.A.
23.12. Lockheed Martin Corporation
23.13. Northrop Grumman Corporation
23.14. Qinetiq Group Plc
23.15. Saab Ab
23.16. Safran S.A.
23.17. SELEX Galileo
23.18. Company 17
23.19. Company 18 and more
"*Financials would be provided on a best efforts basis for private companies"
24. Target Drone Market -Appendix
24.1. Abbreviations
24.2. Sources
25. Target Drone Market -Methodology Premium
25.1. Research Methodology
25.1.1. Company Expert Interviews
25.1.2. Industry Databases
25.1.3. Associations
25.1.4. Company News
25.1.5. Company Annual Reports
25.1.6. Application Trends
25.1.7. New Products and Product database
25.1.8. Company Transcripts
25.1.9. R&D Trends
25.1.10. Key Opinion Leaders Interviews
25.1.11. Supply and Demand Trends
List of Tables
Table 1 Target Drone Market Overview 2021-2026
Table 2 Target Drone Market Leader Analysis 2018-2019 (US$)
Table 3 Target Drone Market Product Analysis 2018-2019 (US$)
Table 4 Target Drone Market End User Analysis 2018-2019 (US$)
Table 5 Target Drone Market Patent Analysis 2013-2018* (US$)
Table 6 Target Drone Market Financial Analysis 2018-2019 (US$)
Table 7 Target Drone Market Driver Analysis 2018-2019 (US$)
Table 8 Target Drone Market Challenges Analysis 2018-2019 (US$)
Table 9 Target Drone Market Constraint Analysis 2018-2019 (US$)
Table 10 Target Drone Market Supplier Bargaining Power Analysis 2018-2019 (US$)
Table 11 Target Drone Market Buyer Bargaining Power Analysis 2018-2019 (US$)
Table 12 Target Drone Market Threat of Substitutes Analysis 2018-2019 (US$)
Table 13 Target Drone Market Threat of New Entrants Analysis 2018-2019 (US$)
Table 14 Target Drone Market Degree of Competition Analysis 2018-2019 (US$)
Table 15 Target Drone Market Value Chain Analysis 2018-2019 (US$)
Table 16 Target Drone Market Pricing Analysis 2021-2026 (US$)
Table 17 Target Drone Market Opportunities Analysis 2021-2026 (US$)
Table 18 Target Drone Market Product Life Cycle Analysis 2021-2026 (US$)
Table 19 Target Drone Market Supplier Analysis 2018-2019 (US$)
Table 20 Target Drone Market Distributor Analysis 2018-2019 (US$)
Table 21 Target Drone Market Trend Analysis 2018-2019 (US$)
Table 22 Target Drone Market Size 2018 (US$)
Table 23 Target Drone Market Forecast Analysis 2021-2026 (US$)
Table 24 Target Drone Market Sales Forecast Analysis 2021-2026 (Units)
Table 25 Target Drone Market, Revenue & Volume,By Engine Type, 2021-2026 ($)
Table 26 Target Drone Market By Engine Type, Revenue & Volume,By Piston Engine, 2021-2026 ($)
Table 27 Target Drone Market By Engine Type, Revenue & Volume,By Wankel Engine, 2021-2026 ($)
Table 28 Target Drone Market By Engine Type, Revenue & Volume,By Turboprop, 2021-2026 ($)
Table 29 Target Drone Market By Engine Type, Revenue & Volume,By Turbojet, 2021-2026 ($)
Table 30 Target Drone Market, Revenue & Volume,By Specification, 2021-2026 ($)
Table 31 Target Drone Market By Specification, Revenue & Volume,By Size, 2021-2026 ($)
Table 32 Target Drone Market By Specification, Revenue & Volume,By Speed, 2021-2026 ($)
Table 33 Target Drone Market By Specification, Revenue & Volume,By Altitude, 2021-2026 ($)
Table 34 Target Drone Market By Specification, Revenue & Volume,By Autonomy, 2021-2026 ($)
Table 35 Target Drone Market, Revenue & Volume,By Application, 2021-2026 ($)
Table 36 Target Drone Market By Application, Revenue & Volume,By Target and Decoy, 2021-2026 ($)
Table 37 Target Drone Market By Application, Revenue & Volume,By Training, 2021-2026 ($)
Table 38 Target Drone Market By Application, Revenue & Volume,By Reconnaissance, 2021-2026 ($)
Table 39 Target Drone Market By Application, Revenue & Volume,By Tracking and Monitoring, 2021-2026 ($)
Table 40 Target Drone Market By Application, Revenue & Volume,By Research and Development of Weapons, 2021-2026 ($)
Table 41 North America Target Drone Market, Revenue & Volume,By Engine Type, 2021-2026 ($)
Table 42 North America Target Drone Market, Revenue & Volume,By Specification, 2021-2026 ($)
Table 43 North America Target Drone Market, Revenue & Volume,By Application, 2021-2026 ($)
Table 44 South america Target Drone Market, Revenue & Volume,By Engine Type, 2021-2026 ($)
Table 45 South america Target Drone Market, Revenue & Volume,By Specification, 2021-2026 ($)
Table 46 South america Target Drone Market, Revenue & Volume,By Application, 2021-2026 ($)
Table 47 Europe Target Drone Market, Revenue & Volume,By Engine Type, 2021-2026 ($)
Table 48 Europe Target Drone Market, Revenue & Volume,By Specification, 2021-2026 ($)
Table 49 Europe Target Drone Market, Revenue & Volume,By Application, 2021-2026 ($)
Table 50 APAC Target Drone Market, Revenue & Volume,By Engine Type, 2021-2026 ($)
Table 51 APAC Target Drone Market, Revenue & Volume,By Specification, 2021-2026 ($)
Table 52 APAC Target Drone Market, Revenue & Volume,By Application, 2021-2026 ($)
Table 53 Middle East & Africa Target Drone Market, Revenue & Volume,By Engine Type, 2021-2026 ($)
Table 54 Middle East & Africa Target Drone Market, Revenue & Volume,By Specification, 2021-2026 ($)
Table 55 Middle East & Africa Target Drone Market, Revenue & Volume,By Application, 2021-2026 ($)
Table 56 Russia Target Drone Market, Revenue & Volume,By Engine Type, 2021-2026 ($)
Table 57 Russia Target Drone Market, Revenue & Volume,By Specification, 2021-2026 ($)
Table 58 Russia Target Drone Market, Revenue & Volume,By Application, 2021-2026 ($)
Table 59 Israel Target Drone Market, Revenue & Volume,By Engine Type, 2021-2026 ($)
Table 60 Israel Target Drone Market, Revenue & Volume,By Specification, 2021-2026 ($)
Table 61 Israel Target Drone Market, Revenue & Volume,By Application, 2021-2026 ($)
Table 62 Top Companies 2018 (US$)Target Drone Market, Revenue & Volume,
Table 63 Product Launch 2018-2019Target Drone Market, Revenue & Volume,
Table 64 Mergers & Acquistions 2018-2019Target Drone Market, Revenue & Volume,
List of Figures
Figure 1 Overview of Target Drone Market 2021-2026
Figure 2 Market Share Analysis for Target Drone Market 2018 (US$)
Figure 3 Product Comparison in Target Drone Market 2018-2019 (US$)
Figure 4 End User Profile for Target Drone Market 2018-2019 (US$)
Figure 5 Patent Application and Grant in Target Drone Market 2013-2018* (US$)
Figure 6 Top 5 Companies Financial Analysis in Target Drone Market 2018-2019 (US$)
Figure 7 Market Entry Strategy in Target Drone Market 2018-2019
Figure 8 Ecosystem Analysis in Target Drone Market 2018
Figure 9 Average Selling Price in Target Drone Market 2021-2026
Figure 10 Top Opportunites in Target Drone Market 2018-2019
Figure 11 Market Life Cycle Analysis in Target Drone Market
Figure 12 GlobalBy Engine TypeTarget Drone Market Revenue, 2021-2026 ($)
Figure 13 GlobalBy SpecificationTarget Drone Market Revenue, 2021-2026 ($)
Figure 14 GlobalBy ApplicationTarget Drone Market Revenue, 2021-2026 ($)
Figure 15 Global Target Drone Market - By Geography
Figure 16 Global Target Drone Market Value & Volume, By Geography, 2021-2026 ($)
Figure 17 Global Target Drone Market CAGR, By Geography, 2021-2026 (%)
Figure 18 North America Target Drone Market Value & Volume, 2021-2026 ($)
Figure 19 US Target Drone Market Value & Volume, 2021-2026 ($)
Figure 20 US GDP and Population, 2018-2019 ($)
Figure 21 US GDP – Composition of 2018, By Sector of Origin
Figure 22 US Export and Import Value & Volume, 2018-2019 ($)
Figure 23 Canada Target Drone Market Value & Volume, 2021-2026 ($)
Figure 24 Canada GDP and Population, 2018-2019 ($)
Figure 25 Canada GDP – Composition of 2018, By Sector of Origin
Figure 26 Canada Export and Import Value & Volume, 2018-2019 ($)
Figure 27 Mexico Target Drone Market Value & Volume, 2021-2026 ($)
Figure 28 Mexico GDP and Population, 2018-2019 ($)
Figure 29 Mexico GDP – Composition of 2018, By Sector of Origin
Figure 30 Mexico Export and Import Value & Volume, 2018-2019 ($)
Figure 31 South America Target Drone Market Value & Volume, 2021-2026 ($)
Figure 32 Brazil Target Drone Market Value & Volume, 2021-2026 ($)
Figure 33 Brazil GDP and Population, 2018-2019 ($)
Figure 34 Brazil GDP – Composition of 2018, By Sector of Origin
Figure 35 Brazil Export and Import Value & Volume, 2018-2019 ($)
Figure 36 Venezuela Target Drone Market Value & Volume, 2021-2026 ($)
Figure 37 Venezuela GDP and Population, 2018-2019 ($)
Figure 38 Venezuela GDP – Composition of 2018, By Sector of Origin
Figure 39 Venezuela Export and Import Value & Volume, 2018-2019 ($)
Figure 40 Argentina Target Drone Market Value & Volume, 2021-2026 ($)
Figure 41 Argentina GDP and Population, 2018-2019 ($)
Figure 42 Argentina GDP – Composition of 2018, By Sector of Origin
Figure 43 Argentina Export and Import Value & Volume, 2018-2019 ($)
Figure 44 Ecuador Target Drone Market Value & Volume, 2021-2026 ($)
Figure 45 Ecuador GDP and Population, 2018-2019 ($)
Figure 46 Ecuador GDP – Composition of 2018, By Sector of Origin
Figure 47 Ecuador Export and Import Value & Volume, 2018-2019 ($)
Figure 48 Peru Target Drone Market Value & Volume, 2021-2026 ($)
Figure 49 Peru GDP and Population, 2018-2019 ($)
Figure 50 Peru GDP – Composition of 2018, By Sector of Origin
Figure 51 Peru Export and Import Value & Volume, 2018-2019 ($)
Figure 52 Colombia Target Drone Market Value & Volume, 2021-2026 ($)
Figure 53 Colombia GDP and Population, 2018-2019 ($)
Figure 54 Colombia GDP – Composition of 2018, By Sector of Origin
Figure 55 Colombia Export and Import Value & Volume, 2018-2019 ($)
Figure 56 Costa Rica Target Drone Market Value & Volume, 2021-2026 ($)
Figure 57 Costa Rica GDP and Population, 2018-2019 ($)
Figure 58 Costa Rica GDP – Composition of 2018, By Sector of Origin
Figure 59 Costa Rica Export and Import Value & Volume, 2018-2019 ($)
Figure 60 Europe Target Drone Market Value & Volume, 2021-2026 ($)
Figure 61 U.K Target Drone Market Value & Volume, 2021-2026 ($)
Figure 62 U.K GDP and Population, 2018-2019 ($)
Figure 63 U.K GDP – Composition of 2018, By Sector of Origin
Figure 64 U.K Export and Import Value & Volume, 2018-2019 ($)
Figure 65 Germany Target Drone Market Value & Volume, 2021-2026 ($)
Figure 66 Germany GDP and Population, 2018-2019 ($)
Figure 67 Germany GDP – Composition of 2018, By Sector of Origin
Figure 68 Germany Export and Import Value & Volume, 2018-2019 ($)
Figure 69 Italy Target Drone Market Value & Volume, 2021-2026 ($)
Figure 70 Italy GDP and Population, 2018-2019 ($)
Figure 71 Italy GDP – Composition of 2018, By Sector of Origin
Figure 72 Italy Export and Import Value & Volume, 2018-2019 ($)
Figure 73 France Target Drone Market Value & Volume, 2021-2026 ($)
Figure 74 France GDP and Population, 2018-2019 ($)
Figure 75 France GDP – Composition of 2018, By Sector of Origin
Figure 76 France Export and Import Value & Volume, 2018-2019 ($)
Figure 77 Netherlands Target Drone Market Value & Volume, 2021-2026 ($)
Figure 78 Netherlands GDP and Population, 2018-2019 ($)
Figure 79 Netherlands GDP – Composition of 2018, By Sector of Origin
Figure 80 Netherlands Export and Import Value & Volume, 2018-2019 ($)
Figure 81 Belgium Target Drone Market Value & Volume, 2021-2026 ($)
Figure 82 Belgium GDP and Population, 2018-2019 ($)
Figure 83 Belgium GDP – Composition of 2018, By Sector of Origin
Figure 84 Belgium Export and Import Value & Volume, 2018-2019 ($)
Figure 85 Spain Target Drone Market Value & Volume, 2021-2026 ($)
Figure 86 Spain GDP and Population, 2018-2019 ($)
Figure 87 Spain GDP – Composition of 2018, By Sector of Origin
Figure 88 Spain Export and Import Value & Volume, 2018-2019 ($)
Figure 89 Denmark Target Drone Market Value & Volume, 2021-2026 ($)
Figure 90 Denmark GDP and Population, 2018-2019 ($)
Figure 91 Denmark GDP – Composition of 2018, By Sector of Origin
Figure 92 Denmark Export and Import Value & Volume, 2018-2019 ($)
Figure 93 APAC Target Drone Market Value & Volume, 2021-2026 ($)
Figure 94 China Target Drone Market Value & Volume, 2021-2026
Figure 95 China GDP and Population, 2018-2019 ($)
Figure 96 China GDP – Composition of 2018, By Sector of Origin
Figure 97 China Export and Import Value & Volume, 2018-2019 ($)Target Drone Market China Export and Import Value & Volume, 2018-2019 ($)
Figure 98 Australia Target Drone Market Value & Volume, 2021-2026 ($)
Figure 99 Australia GDP and Population, 2018-2019 ($)
Figure 100 Australia GDP – Composition of 2018, By Sector of Origin
Figure 101 Australia Export and Import Value & Volume, 2018-2019 ($)
Figure 102 South Korea Target Drone Market Value & Volume, 2021-2026 ($)
Figure 103 South Korea GDP and Population, 2018-2019 ($)
Figure 104 South Korea GDP – Composition of 2018, By Sector of Origin
Figure 105 South Korea Export and Import Value & Volume, 2018-2019 ($)
Figure 106 India Target Drone Market Value & Volume, 2021-2026 ($)
Figure 107 India GDP and Population, 2018-2019 ($)
Figure 108 India GDP – Composition of 2018, By Sector of Origin
Figure 109 India Export and Import Value & Volume, 2018-2019 ($)
Figure 110 Taiwan Target Drone Market Value & Volume, 2021-2026 ($)
Figure 111 Taiwan GDP and Population, 2018-2019 ($)
Figure 112 Taiwan GDP – Composition of 2018, By Sector of Origin
Figure 113 Taiwan Export and Import Value & Volume, 2018-2019 ($)
Figure 114 Malaysia Target Drone Market Value & Volume, 2021-2026 ($)
Figure 115 Malaysia GDP and Population, 2018-2019 ($)
Figure 116 Malaysia GDP – Composition of 2018, By Sector of Origin
Figure 117 Malaysia Export and Import Value & Volume, 2018-2019 ($)
Figure 118 Hong Kong Target Drone Market Value & Volume, 2021-2026 ($)
Figure 119 Hong Kong GDP and Population, 2018-2019 ($)
Figure 120 Hong Kong GDP – Composition of 2018, By Sector of Origin
Figure 121 Hong Kong Export and Import Value & Volume, 2018-2019 ($)
Figure 122 Middle East & Africa Target Drone Market Middle East & Africa 3D Printing Market Value & Volume, 2021-2026 ($)
Figure 123 Russia Target Drone Market Value & Volume, 2021-2026 ($)
Figure 124 Russia GDP and Population, 2018-2019 ($)
Figure 125 Russia GDP – Composition of 2018, By Sector of Origin
Figure 126 Russia Export and Import Value & Volume, 2018-2019 ($)
Figure 127 Israel Target Drone Market Value & Volume, 2021-2026 ($)
Figure 128 Israel GDP and Population, 2018-2019 ($)
Figure 129 Israel GDP – Composition of 2018, By Sector of Origin
Figure 130 Israel Export and Import Value & Volume, 2018-2019 ($)
Figure 131 Entropy Share, By Strategies, 2018-2019* (%)Target Drone Market
Figure 132 Developments, 2018-2019*Target Drone Market
Figure 133 Company 1 Target Drone Market Net Revenue, By Years, 2018-2019* ($)
Figure 134 Company 1 Target Drone Market Net Revenue Share, By Business segments, 2018 (%)
Figure 135 Company 1 Target Drone Market Net Sales Share, By Geography, 2018 (%)
Figure 136 Company 2 Target Drone Market Net Revenue, By Years, 2018-2019* ($)
Figure 137 Company 2 Target Drone Market Net Revenue Share, By Business segments, 2018 (%)
Figure 138 Company 2 Target Drone Market Net Sales Share, By Geography, 2018 (%)
Figure 139 Company 3Target Drone Market Net Revenue, By Years, 2018-2019* ($)
Figure 140 Company 3Target Drone Market Net Revenue Share, By Business segments, 2018 (%)
Figure 141 Company 3Target Drone Market Net Sales Share, By Geography, 2018 (%)
Figure 142 Company 4 Target Drone Market Net Revenue, By Years, 2018-2019* ($)
Figure 143 Company 4 Target Drone Market Net Revenue Share, By Business segments, 2018 (%)
Figure 144 Company 4 Target Drone Market Net Sales Share, By Geography, 2018 (%)
Figure 145 Company 5 Target Drone Market Net Revenue, By Years, 2018-2019* ($)
Figure 146 Company 5 Target Drone Market Net Revenue Share, By Business segments, 2018 (%)
Figure 147 Company 5 Target Drone Market Net Sales Share, By Geography, 2018 (%)
Figure 148 Company 6 Target Drone Market Net Revenue, By Years, 2018-2019* ($)
Figure 149 Company 6 Target Drone Market Net Revenue Share, By Business segments, 2018 (%)
Figure 150 Company 6 Target Drone Market Net Sales Share, By Geography, 2018 (%)
Figure 151 Company 7 Target Drone Market Net Revenue, By Years, 2018-2019* ($)
Figure 152 Company 7 Target Drone Market Net Revenue Share, By Business segments, 2018 (%)
Figure 153 Company 7 Target Drone Market Net Sales Share, By Geography, 2018 (%)
Figure 154 Company 8 Target Drone Market Net Revenue, By Years, 2018-2019* ($)
Figure 155 Company 8 Target Drone Market Net Revenue Share, By Business segments, 2018 (%)
Figure 156 Company 8 Target Drone Market Net Sales Share, By Geography, 2018 (%)
Figure 157 Company 9 Target Drone Market Net Revenue, By Years, 2018-2019* ($)
Figure 158 Company 9 Target Drone Market Net Revenue Share, By Business segments, 2018 (%)
Figure 159 Company 9 Target Drone Market Net Sales Share, By Geography, 2018 (%)
Figure 160 Company 10 Target Drone Market Net Revenue, By Years, 2018-2019* ($)
Figure 161 Company 10 Target Drone Market Net Revenue Share, By Business segments, 2018 (%)
Figure 162 Company 10 Target Drone Market Net Sales Share, By Geography, 2018 (%)
Figure 163 Company 11 Target Drone Market Net Revenue, By Years, 2018-2019* ($)
Figure 164 Company 11 Target Drone Market Net Revenue Share, By Business segments, 2018 (%)
Figure 165 Company 11 Target Drone Market Net Sales Share, By Geography, 2018 (%)
Figure 166 Company 12 Target Drone Market Net Revenue, By Years, 2018-2019* ($)
Figure 167 Company 12 Target Drone Market Net Revenue Share, By Business segments, 2018 (%)
Figure 168 Company 12 Target Drone Market Net Sales Share, By Geography, 2018 (%)
Figure 169 Company 13Target Drone Market Net Revenue, By Years, 2018-2019* ($)
Figure 170 Company 13Target Drone Market Net Revenue Share, By Business segments, 2018 (%)
Figure 171 Company 13Target Drone Market Net Sales Share, By Geography, 2018 (%)
Figure 172 Company 14 Target Drone Market Net Revenue, By Years, 2018-2019* ($)
Figure 173 Company 14 Target Drone Market Net Revenue Share, By Business segments, 2018 (%)
Figure 174 Company 14 Target Drone Market Net Sales Share, By Geography, 2018 (%)
Figure 175 Company 15 Target Drone Market Net Revenue, By Years, 2018-2019* ($)
Figure 176 Company 15 Target Drone Market Net Revenue Share, By Business segments, 2018 (%)
Figure 177 Company 15 Target Drone Market Net Sales Share, By Geography, 2018 (%)