 Email
Email Print
Print


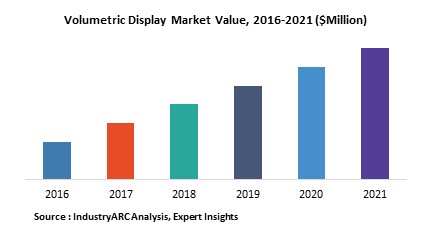
Volumetric Displays are visual display devices that form visual representation of three dimensional objects, in a transparent physical volume by generation, absorption, scattering of visible radiation from well-defined, localized and specific regions of coordinated axes within that volume. These are of two types swept volume and static volume.
Volumetric displays finds its application in oil and gas exploration and production by real-time visualization of 3-D fluid flow, security applications such as luggage visualization, pharmaceutical molecular modeling, interventional and diagnostic medical imaging. The utility of volumetric imaging in medical visualization has been studied in the field of external beam cancer treatment using the Perspecta display manufactured by Actuality Systems. Further developments are carried out in this field so that the technology can be more developed to carry out multiple and more complex applications at a cheaper cost for end user industries and thus escalate commercialization.
The volumetric display market can be segmented into three verticals: by components, by display, by application and by end user industry. The report contains detailed and in-depth analysis of the segmentation of the volumetric display market.
The prominent players of this market are:
Major players manufacturing volumetric displays are profiled in the report with company overview, financial overview, business strategies, product portfolios, recent developments and market shares.
Volumetric displays finds its application in oil and gas exploration and production by real-time visualization of 3-D fluid flow, security applications such as luggage visualization, pharmaceutical molecular modeling, interventional and diagnostic medical imaging. The utility of volumetric imaging in medical visualization has been studied in the field of external beam cancer treatment using the Perspecta display manufactured by Actuality Systems. Further developments are carried out in this field so that the technology can be more developed to carry out multiple and more complex applications at a cheaper cost for end user industries and thus escalate commercialization.
The volumetric display market can be segmented into three verticals: by components, by display, by application and by end user industry. The report contains detailed and in-depth analysis of the segmentation of the volumetric display market.
The prominent players of this market are:
- 3DIcon Corporation (U.S),
- Lightspace Technologies, SIA (U.S),
- Burton Inc. (Japan),
- Holoxica Ltd.(U.K ),
- Soscho GmbH(Germany),
- Actuality Systems, Inc.(U.S) and a few more.
Major players manufacturing volumetric displays are profiled in the report with company overview, financial overview, business strategies, product portfolios, recent developments and market shares.
1. Volumetric Display Market - Overview
1.1. Definitions and Scope
2. Volumetric Display Market - Executive summary
2.1. Market Revenue, Market Size and Key Trends by Company
2.2. Key Trends by type of Application
2.3. Key Trends segmented by Geography
3. Volumetric Display Market
3.1. Comparative analysis
3.1.1. Product Benchmarking - Top 10 companies
3.1.2. Top 5 Financials Analysis
3.1.3. Market Value split by Top 10 companies
3.1.4. Patent Analysis - Top 10 companies
3.1.5. Pricing Analysis
4. Volumetric Display Market – Startup companies Scenario Premium
4.1. Top 10 startup company Analysis by
4.1.1. Investment
4.1.2. Revenue
4.1.3. Market Shares
4.1.4. Market Size and Application Analysis
4.1.5. Venture Capital and Funding Scenario
5. Volumetric Display Market – Industry Market Entry Scenario Premium
5.1. Regulatory Framework Overview
5.2. New Business and Ease of Doing business index
5.3. Case studies of successful ventures
5.4. Customer Analysis – Top 10 companies
6. Volumetric Display Market Forces
6.1. Drivers
6.2. Constraints
6.3. Challenges
6.4. Porters five force model
6.4.1. Bargaining power of suppliers
6.4.2. Bargaining powers of customers
6.4.3. Threat of new entrants
6.4.4. Rivalry among existing players
6.4.5. Threat of substitutes
7. Volumetric Display Market -Strategic analysis
7.1. Value chain analysis
7.2. Opportunities analysis
7.3. Product life cycle
7.4. Suppliers and distributors Market Share
8. Volumetric Display Market – By Components (Market Size -$Million / $Billion)
8.1. Market Size and Market Share Analysis
8.2. Application Revenue and Trend Research
8.3. Product Segment Analysis
8.3.1. Screen
8.3.2. Mirror or Lens
8.3.3. Computational Device
8.3.4. Memory
8.3.5. Connectivity Module
8.3.6. Projection Source
8.3.7. Others
9. Volumetric Display Market – By Technology (Market Size -$Million / $Billion)
9.1. Introduction
9.2. Swept Volume Display
9.2.1. Rotating Flat Screen
9.2.2. Varifocal Mirror
9.2.3. Rotating LED Array
9.2.4. Others
9.3. Static Volume Display
9.3.1. Gas Medium Upconversion
9.3.2. Solid State Upconversion
9.3.3. Laser Plasma 3D in Air
9.3.4. Layered LCD Stack
9.3.5. Others
9.4. Others
10. Volumetric Display Market – By Application (Market Size -$Million / $Billion)
10.1. Design and Prototyping
10.2. Production and Management
10.3. Marketing
10.4. Data Visualization
10.5. Training
10.6. Others
11. Volumetric Display – By End User Industry(Market Size -$Million / $Billion)
11.1. Segment type Size and Market Share Analysis
11.2. Application Revenue and Trends by type of Application
11.3. Application Segment Analysis by Type
11.3.1. Introduction
11.3.2. Education
11.3.3. Medical
11.3.4. Engineering
11.3.5. Entertainment
11.3.6. Advertisement
11.3.7. Others
12. Volumetric Display - By Geography (Market Size -$Million / $Billion)
12.1. Volumetric Display Market - North America Segment Research
12.2. North America Market Research (Million / $Billion)
12.2.1. Segment type Size and Market Size Analysis
12.2.2. Revenue and Trends
12.2.3. Application Revenue and Trends by type of Application
12.2.4. Company Revenue and Product Analysis
12.2.5. North America Product type and Application Market Size
12.2.5.1. U.S.
12.2.5.2. Canada
12.2.5.3. Mexico
12.2.5.4. Rest of North America
12.3. Volumetric Display - South America Segment Research
12.4. South America Market Research (Market Size -$Million / $Billion)
12.4.1. Segment type Size and Market Size Analysis
12.4.2. Revenue and Trends
12.4.3. Application Revenue and Trends by type of Application
12.4.4. Company Revenue and Product Analysis
12.4.5. South America Product type and Application Market Size
12.4.5.1. Brazil
12.4.5.2. Venezuela
12.4.5.3. Argentina
12.4.5.4. Ecuador
12.4.5.5. Peru
12.4.5.6. Colombia
12.4.5.7. Costa Rica
12.4.5.8. Rest of South America
12.5. Volumetric Display - Europe Segment Research
12.6. Europe Market Research (Market Size -$Million / $Billion)
12.6.1. Segment type Size and Market Size Analysis
12.6.2. Revenue and Trends
12.6.3. Application Revenue and Trends by type of Application
12.6.4. Company Revenue and Product Analysis
12.6.5. Europe Segment Product type and Application Market Size
12.6.5.1. U.K
12.6.5.2. Germany
12.6.5.3. Italy
12.6.5.4. France
12.6.5.5. Netherlands
12.6.5.6. Belgium
12.6.5.7. Spain
12.6.5.8. Denmark
12.6.5.9. Rest of Europe
12.7. Volumetric Display – APAC Segment Research
12.8. APAC Market Research (Market Size -$Million / $Billion)
12.8.1. Segment type Size and Market Size Analysis
12.8.2. Revenue and Trends
12.8.3. Application Revenue and Trends by type of Application
12.8.4. Company Revenue and Product Analysis
12.8.5. APAC Segment – Product type and Application Market Size
12.8.5.1. China
12.8.5.2. Australia
12.8.5.3. Japan
12.8.5.4. South Korea
12.8.5.5. India
12.8.5.6. Taiwan
12.8.5.7. Malaysia
13. Volumetric Display Market - Entropy
13.1. New product launches
13.2. M&A's, collaborations, JVs and partnerships
14. Volumetric Display Market – Industry / Segment Competition landscape Premium
14.1. Market Share Analysis
14.1.1. Market Share by Country- Top companies
14.1.2. Market Share by Region- Top 10 companies
14.1.3. Market Share by type of Application – Top 10 companies
14.1.4. Market Share by type of Product / Product category- Top 10 companies
14.1.5. Market Share at global level- Top 10 companies
14.1.6. Best Practises for companies
15. Volumetric Display Market – Key Company List by Country Premium
16. Volumetric Display Market Company Analysis
16.1. Market Share, Company Revenue, Products, M&A, Developments
16.2. 3DIcon Corporation (U.S)
16.3. Lightspace Technologies, SIA (U.S)
16.4. Burton Inc. (Japan)
16.5. Holoxica Ltd.(U.K )
16.6. Holoxica Ltd.(U.K )
16.7. Actuality Systems, Inc.(U.S)
16.8. Company 7
16.9. Company 8
16.10. Company 9
16.11. Company 10 and more
"*Financials would be provided on a best efforts basis for private companies"
17. Volumetric Display Market -Appendix
17.1. Abbreviations
17.2. Sources
18. Volumetric Display Market -Methodology Premium
18.1. Research Methodology
18.1.1. Company Expert Interviews
18.1.2. Industry Databases
18.1.3. Associations
18.1.4. Company News
18.1.5. Company Annual Reports
18.1.6. Application Trends
18.1.7. New Products and Product database
18.1.8. Company Transcripts
18.1.9. R&D Trends
18.1.10. Key Opinion Leaders Interviews
18.1.11. Supply and Demand Trends
List of Tables:
Table 1: Volumetric Display Market Overview 2021-2026
Table 2: Volumetric Display Market Leader Analysis 2018-2019 (US$)
Table 3: Volumetric Display Market Product Analysis 2018-2019 (US$)
Table 4: Volumetric Display Market End User Analysis 2018-2019 (US$)
Table 5: Volumetric Display Market Patent Analysis 2013-2018* (US$)
Table 6: Volumetric Display Market Financial Analysis 2018-2019 (US$)
Table 7: Volumetric Display Market Driver Analysis 2018-2019 (US$)
Table 8: Volumetric Display Market Challenges Analysis 2018-2019 (US$)
Table 9: Volumetric Display Market Constraint Analysis 2018-2019 (US$)
Table 10: Volumetric Display Market Supplier Bargaining Power Analysis 2018-2019 (US$)
Table 11: Volumetric Display Market Buyer Bargaining Power Analysis 2018-2019 (US$)
Table 12: Volumetric Display Market Threat of Substitutes Analysis 2018-2019 (US$)
Table 13: Volumetric Display Market Threat of New Entrants Analysis 2018-2019 (US$)
Table 14: Volumetric Display Market Degree of Competition Analysis 2018-2019 (US$)
Table 15: Volumetric Display Market Value Chain Analysis 2018-2019 (US$)
Table 16: Volumetric Display Market Pricing Analysis 2021-2026 (US$)
Table 17: Volumetric Display Market Opportunities Analysis 2021-2026 (US$)
Table 18: Volumetric Display Market Product Life Cycle Analysis 2021-2026 (US$)
Table 19: Volumetric Display Market Supplier Analysis 2018-2019 (US$)
Table 20: Volumetric Display Market Distributor Analysis 2018-2019 (US$)
Table 21: Volumetric Display Market Trend Analysis 2018-2019 (US$)
Table 22: Volumetric Display Market Size 2018 (US$)
Table 23: Volumetric Display Market Forecast Analysis 2021-2026 (US$)
Table 24: Volumetric Display Market Sales Forecast Analysis 2021-2026 (Units)
Table 25: Volumetric Display Market, Revenue & Volume, By Components, 2021-2026 ($)
Table 26: Volumetric Display Market By Components, Revenue & Volume, By Screen, 2021-2026 ($)
Table 27: Volumetric Display Market By Components, Revenue & Volume, By Mirror or Lens, 2021-2026 ($)
Table 28: Volumetric Display Market By Components, Revenue & Volume, By Computational Device, 2021-2026 ($)
Table 29: Volumetric Display Market By Components, Revenue & Volume, By Memory, 2021-2026 ($)
Table 30: Volumetric Display Market By Components, Revenue & Volume, By Connectivity Module, 2021-2026 ($)
Table 31: Volumetric Display Market, Revenue & Volume, By Region, 2021-2026 ($)
Table 32: Volumetric Display Market By Region, Revenue & Volume, By America, 2021-2026 ($)
Table 33: Volumetric Display Market By Region, Revenue & Volume, By Europe, 2021-2026 ($)
Table 34: Volumetric Display Market By Region, Revenue & Volume, By APAC, 2021-2026 ($)
Table 35: Volumetric Display Market By Region, Revenue & Volume, By ROW, 2021-2026 ($)
Table 36: Volumetric Display Market, Revenue & Volume, By Technology, 2021-2026 ($)
Table 37: Volumetric Display Market By Technology, Revenue & Volume, By Introduction, 2021-2026 ($)
Table 38: Volumetric Display Market By Technology, Revenue & Volume, By Swept Volume Display, 2021-2026 ($)
Table 39: Volumetric Display Market By Technology, Revenue & Volume, By Static Volume Display, 2021-2026 ($)
Table 40: Volumetric Display Market, Revenue & Volume, By Application, 2021-2026 ($)
Table 41: Volumetric Display Market By Application, Revenue & Volume, By Design and Prototyping, 2021-2026 ($)
Table 42: Volumetric Display Market By Application, Revenue & Volume, By Production and Management, 2021-2026 ($)
Table 43: Volumetric Display Market By Application, Revenue & Volume, By Market ing, 2021-2026 ($)
Table 44: Volumetric Display Market By Application, Revenue & Volume, By Data Visualization, 2021-2026 ($)
Table 45: Volumetric Display Market By Application, Revenue & Volume, By Training, 2021-2026 ($)
Table 46: Volumetric Display Market, Revenue & Volume, By End User Industry, 2021-2026 ($)
Table 47: Volumetric Display Market By End User Industry, Revenue & Volume, By Introduction, 2021-2026 ($)
Table 48: Volumetric Display Market By End User Industry, Revenue & Volume, By Education, 2021-2026 ($)
Table 49: Volumetric Display Market By End User Industry, Revenue & Volume, By Medical, 2021-2026 ($)
Table 50: Volumetric Display Market By End User Industry, Revenue & Volume, By Engineering, 2021-2026 ($)
Table 51: Volumetric Display Market By End User Industry, Revenue & Volume, By Entertainment, 2021-2026 ($)
Table 52: North America Volumetric Display Market, Revenue & Volume, By Components, 2021-2026 ($)
Table 53: North America Volumetric Display Market, Revenue & Volume, By Region, 2021-2026 ($)
Table 54: North America Volumetric Display Market, Revenue & Volume, By Technology, 2021-2026 ($)
Table 55: North America Volumetric Display Market, Revenue & Volume, By Application, 2021-2026 ($)
Table 56: North America Volumetric Display Market, Revenue & Volume, By End User Industry, 2021-2026 ($)
Table 57: South america Volumetric Display Market, Revenue & Volume, By Components, 2021-2026 ($)
Table 58: South america Volumetric Display Market, Revenue & Volume, By Region, 2021-2026 ($)
Table 59: South america Volumetric Display Market, Revenue & Volume, By Technology, 2021-2026 ($)
Table 60: South america Volumetric Display Market, Revenue & Volume, By Application, 2021-2026 ($)
Table 61: South america Volumetric Display Market, Revenue & Volume, By End User Industry, 2021-2026 ($)
Table 62: Europe Volumetric Display Market, Revenue & Volume, By Components, 2021-2026 ($)
Table 63: Europe Volumetric Display Market, Revenue & Volume, By Region, 2021-2026 ($)
Table 64: Europe Volumetric Display Market, Revenue & Volume, By Technology, 2021-2026 ($)
Table 65: Europe Volumetric Display Market, Revenue & Volume, By Application, 2021-2026 ($)
Table 66: Europe Volumetric Display Market, Revenue & Volume, By End User Industry, 2021-2026 ($)
Table 67: APAC Volumetric Display Market, Revenue & Volume, By Components, 2021-2026 ($)
Table 68: APAC Volumetric Display Market, Revenue & Volume, By Region, 2021-2026 ($)
Table 69: APAC Volumetric Display Market, Revenue & Volume, By Technology, 2021-2026 ($)
Table 70: APAC Volumetric Display Market, Revenue & Volume, By Application, 2021-2026 ($)
Table 71: APAC Volumetric Display Market, Revenue & Volume, By End User Industry, 2021-2026 ($)
Table 72: Middle East & Africa Volumetric Display Market, Revenue & Volume, By Components, 2021-2026 ($)
Table 73: Middle East & Africa Volumetric Display Market, Revenue & Volume, By Region, 2021-2026 ($)
Table 74: Middle East & Africa Volumetric Display Market, Revenue & Volume, By Technology, 2021-2026 ($)
Table 75: Middle East & Africa Volumetric Display Market, Revenue & Volume, By Application, 2021-2026 ($)
Table 76: Middle East & Africa Volumetric Display Market, Revenue & Volume, By End User Industry, 2021-2026 ($)
Table 77: Russia Volumetric Display Market, Revenue & Volume, By Components, 2021-2026 ($)
Table 78: Russia Volumetric Display Market, Revenue & Volume, By Region, 2021-2026 ($)
Table 79: Russia Volumetric Display Market, Revenue & Volume, By Technology, 2021-2026 ($)
Table 80: Russia Volumetric Display Market, Revenue & Volume, By Application, 2021-2026 ($)
Table 81: Russia Volumetric Display Market, Revenue & Volume, By End User Industry, 2021-2026 ($)
Table 82: Israel Volumetric Display Market, Revenue & Volume, By Components, 2021-2026 ($)
Table 83: Israel Volumetric Display Market, Revenue & Volume, By Region, 2021-2026 ($)
Table 84: Israel Volumetric Display Market, Revenue & Volume, By Technology, 2021-2026 ($)
Table 85: Israel Volumetric Display Market, Revenue & Volume, By Application, 2021-2026 ($)
Table 86: Israel Volumetric Display Market, Revenue & Volume, By End User Industry, 2021-2026 ($)
Table 87: Top Companies 2018 (US$) Volumetric Display Market, Revenue & Volume
Table 88: Product Launch 2018-2019 Volumetric Display Market, Revenue & Volume
Table 89: Mergers & Acquistions 2018-2019 Volumetric Display Market, Revenue & Volume
List of Figures:
Figure 1: Overview of Volumetric Display Market 2021-2026
Figure 2: Market Share Analysis for Volumetric Display Market 2018 (US$)
Figure 3: Product Comparison in Volumetric Display Market 2018-2019 (US$)
Figure 4: End User Profile for Volumetric Display Market 2018-2019 (US$)
Figure 5: Patent Application and Grant in Volumetric Display Market 2013-2018* (US$)
Figure 6: Top 5 Companies Financial Analysis in Volumetric Display Market 2018-2019 (US$)
Figure 7: Market Entry Strategy in Volumetric Display Market 2018-2019
Figure 8: Ecosystem Analysis in Volumetric Display Market 2018
Figure 9: Average Selling Price in Volumetric Display Market 2021-2026
Figure 10: Top Opportunites in Volumetric Display Market 2018-2019
Figure 11: Market Life Cycle Analysis in Volumetric Display Market
Figure 12: GlobalBy Components Volumetric Display Market Revenue, 2021-2026 ($)
Figure 13: GlobalBy Region Volumetric Display Market Revenue, 2021-2026 ($)
Figure 14: GlobalBy Technology Volumetric Display Market Revenue, 2021-2026 ($)
Figure 15: GlobalBy Application Volumetric Display Market Revenue, 2021-2026 ($)
Figure 16: GlobalBy End User Industry Volumetric Display Market Revenue, 2021-2026 ($)
Figure 17: Global Volumetric Display Market - By Geography
Figure 18: Global Volumetric Display Market Value & Volume, By Geography, 2021-2026 ($)
Figure 19: Global Volumetric Display Market CAGR, By Geography, 2021-2026 (%)
Figure 20: North America Volumetric Display Market Value & Volume, 2021-2026 ($)
Figure 21: US Volumetric Display Market Value & Volume, 2021-2026 ($)
Figure 22: US GDP and Population, 2018-2019 ($)
Figure 23: US GDP – Composition of 2018, By Sector of Origin
Figure 24: US Export and Import Value & Volume, 2018-2019 ($)
Figure 25: Canada Volumetric Display Market Value & Volume, 2021-2026 ($)
Figure 26: Canada GDP and Population, 2018-2019 ($)
Figure 27: Canada GDP – Composition of 2018, By Sector of Origin
Figure 28: Canada Export and Import Value & Volume, 2018-2019 ($)
Figure 29: Mexico Volumetric Display Market Value & Volume, 2021-2026 ($)
Figure 30: Mexico GDP and Population, 2018-2019 ($)
Figure 31: Mexico GDP – Composition of 2018, By Sector of Origin
Figure 32: Mexico Export and Import Value & Volume, 2018-2019 ($)
Figure 33: South America Volumetric Display Market Value & Volume, 2021-2026 ($)
Figure 34: Brazil Volumetric Display Market Value & Volume, 2021-2026 ($)
Figure 35: Brazil GDP and Population, 2018-2019 ($)
Figure 36: Brazil GDP – Composition of 2018, By Sector of Origin
Figure 37: Brazil Export and Import Value & Volume, 2018-2019 ($)
Figure 38: Venezuela Volumetric Display Market Value & Volume, 2021-2026 ($)
Figure 39: Venezuela GDP and Population, 2018-2019 ($)
Figure 40: Venezuela GDP – Composition of 2018, By Sector of Origin
Figure 41: Venezuela Export and Import Value & Volume, 2018-2019 ($)
Figure 42: Argentina Volumetric Display Market Value & Volume, 2021-2026 ($)
Figure 43: Argentina GDP and Population, 2018-2019 ($)
Figure 44: Argentina GDP – Composition of 2018, By Sector of Origin
Figure 45: Argentina Export and Import Value & Volume, 2018-2019 ($)
Figure 46: Ecuador Volumetric Display Market Value & Volume, 2021-2026 ($)
Figure 47: Ecuador GDP and Population, 2018-2019 ($)
Figure 48: Ecuador GDP – Composition of 2018, By Sector of Origin
Figure 49: Ecuador Export and Import Value & Volume, 2018-2019 ($)
Figure 50: Peru Volumetric Display Market Value & Volume, 2021-2026 ($)
Figure 51: Peru GDP and Population, 2018-2019 ($)
Figure 52: Peru GDP – Composition of 2018, By Sector of Origin
Figure 53: Peru Export and Import Value & Volume, 2018-2019 ($)
Figure 54: Colombia Volumetric Display Market Value & Volume, 2021-2026 ($)
Figure 55: Colombia GDP and Population, 2018-2019 ($)
Figure 56: Colombia GDP – Composition of 2018, By Sector of Origin
Figure 57: Colombia Export and Import Value & Volume, 2018-2019 ($)
Figure 58: Costa Rica Volumetric Display Market Value & Volume, 2021-2026 ($)
Figure 59: Costa Rica GDP and Population, 2018-2019 ($)
Figure 60: Costa Rica GDP – Composition of 2018, By Sector of Origin
Figure 61: Costa Rica Export and Import Value & Volume, 2018-2019 ($)
Figure 62: Europe Volumetric Display Market Value & Volume, 2021-2026 ($)
Figure 63: U.K Volumetric Display Market Value & Volume, 2021-2026 ($)
Figure 64: U.K GDP and Population, 2018-2019 ($)
Figure 65: U.K GDP – Composition of 2018, By Sector of Origin
Figure 66: U.K Export and Import Value & Volume, 2018-2019 ($)
Figure 67: Germany Volumetric Display Market Value & Volume, 2021-2026 ($)
Figure 68: Germany GDP and Population, 2018-2019 ($)
Figure 69: Germany GDP – Composition of 2018, By Sector of Origin
Figure 70: Germany Export and Import Value & Volume, 2018-2019 ($)
Figure 71: Italy Volumetric Display Market Value & Volume, 2021-2026 ($)
Figure 72: Italy GDP and Population, 2018-2019 ($)
Figure 73: Italy GDP – Composition of 2018, By Sector of Origin
Figure 74: Italy Export and Import Value & Volume, 2018-2019 ($)
Figure 75: France Volumetric Display Market Value & Volume, 2021-2026 ($)
Figure 76: France GDP and Population, 2018-2019 ($)
Figure 77: France GDP – Composition of 2018, By Sector of Origin
Figure 78: France Export and Import Value & Volume, 2018-2019 ($)
Figure 79: Netherlands Volumetric Display Market Value & Volume, 2021-2026 ($)
Figure 80: Netherlands GDP and Population, 2018-2019 ($)
Figure 81: Netherlands GDP – Composition of 2018, By Sector of Origin
Figure 82: Netherlands Export and Import Value & Volume, 2018-2019 ($)
Figure 83: Belgium Volumetric Display Market Value & Volume, 2021-2026 ($)
Figure 84: Belgium GDP and Population, 2018-2019 ($)
Figure 85: Belgium GDP – Composition of 2018, By Sector of Origin
Figure 86: Belgium Export and Import Value & Volume, 2018-2019 ($)
Figure 87: Spain Volumetric Display Market Value & Volume, 2021-2026 ($)
Figure 88: Spain GDP and Population, 2018-2019 ($)
Figure 89: Spain GDP – Composition of 2018, By Sector of Origin
Figure 90: Spain Export and Import Value & Volume, 2018-2019 ($)
Figure 91: Denmark Volumetric Display Market Value & Volume, 2021-2026 ($)
Figure 92: Denmark GDP and Population, 2018-2019 ($)
Figure 93: Denmark GDP – Composition of 2018, By Sector of Origin
Figure 94: Denmark Export and Import Value & Volume, 2018-2019 ($)
Figure 95: APAC Volumetric Display Market Value & Volume, 2021-2026 ($)
Figure 96: China Volumetric Display Market Value & Volume, 2021-2026
Figure 97: China GDP and Population, 2018-2019 ($)
Figure 98: China GDP – Composition of 2018, By Sector of Origin
Figure 99: China Export and Import Value & Volume, 2018-2019 ($) Volumetric Display Market China Export and Import Value & Volume, 2018-2019 ($)
Figure 100: Australia Volumetric Display Market Value & Volume, 2021-2026 ($)
Figure 101: Australia GDP and Population, 2018-2019 ($)
Figure 102: Australia GDP – Composition of 2018, By Sector of Origin
Figure 103: Australia Export and Import Value & Volume, 2018-2019 ($)
Figure 104: South Korea Volumetric Display Market Value & Volume, 2021-2026 ($)
Figure 105: South Korea GDP and Population, 2018-2019 ($)
Figure 106: South Korea GDP – Composition of 2018, By Sector of Origin
Figure 107: South Korea Export and Import Value & Volume, 2018-2019 ($)
Figure 108: India Volumetric Display Market Value & Volume, 2021-2026 ($)
Figure 109: India GDP and Population, 2018-2019 ($)
Figure 110: India GDP – Composition of 2018, By Sector of Origin
Figure 111: India Export and Import Value & Volume, 2018-2019 ($)
Figure 112: Taiwan Volumetric Display Market Value & Volume, 2021-2026 ($)
Figure 113: Taiwan GDP and Population, 2018-2019 ($)
Figure 114: Taiwan GDP – Composition of 2018, By Sector of Origin
Figure 115: Taiwan Export and Import Value & Volume, 2018-2019 ($)
Figure 116: Malaysia Volumetric Display Market Value & Volume, 2021-2026 ($)
Figure 117: Malaysia GDP and Population, 2018-2019 ($)
Figure 118: Malaysia GDP – Composition of 2018, By Sector of Origin
Figure 119: Malaysia Export and Import Value & Volume, 2018-2019 ($)
Figure 120: Hong Kong Volumetric Display Market Value & Volume, 2021-2026 ($)
Figure 121: Hong Kong GDP and Population, 2018-2019 ($)
Figure 122: Hong Kong GDP – Composition of 2018, By Sector of Origin
Figure 123: Hong Kong Export and Import Value & Volume, 2018-2019 ($)
Figure 124: Middle East & Africa Volumetric Display Market Middle East & Africa 3D Printing Market Value & Volume, 2021-2026 ($)
Figure 125: Russia Volumetric Display Market Value & Volume, 2021-2026 ($)
Figure 126: Russia GDP and Population, 2018-2019 ($)
Figure 127: Russia GDP – Composition of 2018, By Sector of Origin
Figure 128: Russia Export and Import Value & Volume, 2018-2019 ($)
Figure 129: Israel Volumetric Display Market Value & Volume, 2021-2026 ($)
Figure 130: Israel GDP and Population, 2018-2019 ($)
Figure 131: Israel GDP – Composition of 2018, By Sector of Origin
Figure 132: Israel Export and Import Value & Volume, 2018-2019 ($)
Figure 133: Entropy Share, By Strategies, 2018-2019* (%) Volumetric Display Market
Figure 134: Developments, 2018-2019* Volumetric Display Market
Figure 135: Company 1 Volumetric Display Market Net Revenue, By Years, 2018-2019* ($)
Figure 136: Company 1 Volumetric Display Market Net Revenue Share, By Business segments, 2018 (%)
Figure 137: Company 1 Volumetric Display Market Net Sales Share, By Geography, 2018 (%)
Figure 138: Company 2 Volumetric Display Market Net Revenue, By Years, 2018-2019* ($)
Figure 139: Company 2 Volumetric Display Market Net Revenue Share, By Business segments, 2018 (%)
Figure 140: Company 2 Volumetric Display Market Net Sales Share, By Geography, 2018 (%)
Figure 141: Company 3 Volumetric Display Market Net Revenue, By Years, 2018-2019* ($)
Figure 142: Company 3 Volumetric Display Market Net Revenue Share, By Business segments, 2018 (%)
Figure 143: Company 3 Volumetric Display Market Net Sales Share, By Geography, 2018 (%)
Figure 144: Company 4 Volumetric Display Market Net Revenue, By Years, 2018-2019* ($)
Figure 145: Company 4 Volumetric Display Market Net Revenue Share, By Business segments, 2018 (%)
Figure 146: Company 4 Volumetric Display Market Net Sales Share, By Geography, 2018 (%)
Figure 147: Company 5 Volumetric Display Market Net Revenue, By Years, 2018-2019* ($)
Figure 148: Company 5 Volumetric Display Market Net Revenue Share, By Business segments, 2018 (%)
Figure 149: Company 5 Volumetric Display Market Net Sales Share, By Geography, 2018 (%)
Figure 150: Company 6 Volumetric Display Market Net Revenue, By Years, 2018-2019* ($)
Figure 151: Company 6 Volumetric Display Market Net Revenue Share, By Business segments, 2018 (%)
Figure 152: Company 6 Volumetric Display Market Net Sales Share, By Geography, 2018 (%)
Figure 153: Company 7 Volumetric Display Market Net Revenue, By Years, 2018-2019* ($)
Figure 154: Company 7 Volumetric Display Market Net Revenue Share, By Business segments, 2018 (%)
Figure 155: Company 7 Volumetric Display Market Net Sales Share, By Geography, 2018 (%)
Figure 156: Company 8 Volumetric Display Market Net Revenue, By Years, 2018-2019* ($)
Figure 157: Company 8 Volumetric Display Market Net Revenue Share, By Business segments, 2018 (%)
Figure 158: Company 8 Volumetric Display Market Net Sales Share, By Geography, 2018 (%)
Figure 159: Company 9 Volumetric Display Market Net Revenue, By Years, 2018-2019* ($)
Figure 160: Company 9 Volumetric Display Market Net Revenue Share, By Business segments, 2018 (%)
Figure 161: Company 9 Volumetric Display Market Net Sales Share, By Geography, 2018 (%)
Figure 162: Company 10 Volumetric Display Market Net Revenue, By Years, 2018-2019* ($)
Figure 163: Company 10 Volumetric Display Market Net Revenue Share, By Business segments, 2018 (%)
Figure 164: Company 10 Volumetric Display Market Net Sales Share, By Geography, 2018 (%)
Figure 165: Company 11 Volumetric Display Market Net Revenue, By Years, 2018-2019* ($)
Figure 166: Company 11 Volumetric Display Market Net Revenue Share, By Business segments, 2018 (%)
Figure 167: Company 11 Volumetric Display Market Net Sales Share, By Geography, 2018 (%)
Figure 168: Company 12 Volumetric Display Market Net Revenue, By Years, 2018-2019* ($)
Figure 169: Company 12 Volumetric Display Market Net Revenue Share, By Business segments, 2018 (%)
Figure 170: Company 12 Volumetric Display Market Net Sales Share, By Geography, 2018 (%)
Figure 171: Company 13 Volumetric Display Market Net Revenue, By Years, 2018-2019* ($)
Figure 172: Company 13 Volumetric Display Market Net Revenue Share, By Business segments, 2018 (%)
Figure 173: Company 13 Volumetric Display Market Net Sales Share, By Geography, 2018 (%)
Figure 174: Company 14 Volumetric Display Market Net Revenue, By Years, 2018-2019* ($)
Figure 175: Company 14 Volumetric Display Market Net Revenue Share, By Business segments, 2018 (%)
Figure 176: Company 14 Volumetric Display Market Net Sales Share, By Geography, 2018 (%)
Figure 177: Company 15 Volumetric Display Market Net Revenue, By Years, 2018-2019* ($)
Figure 178: Company 15 Volumetric Display Market Net Revenue Share, By Business segments, 2018 (%)
Figure 179: Company 15 Volumetric Display Market Net Sales Share, By Geography, 2018 (%)