 Email
Email Print
Print


Plasterboard Market Overview:
According to Eurogypsum, more than 1,600 million square meters of interior surfaces are covered with plasterboards with around 5 million tons of plaster used for interior lining in Europe each year [1]. Similarly, owing to the on-going construction and intermittent replacement of the old plasterboards with the new ones across the globe, the plasterboard market has attained a permanent demand influx from various sectors, and its market size was $19,754 million in 2018, according to the findings by IndustryARC’s market analyst. Furthermore, the analyst estimates the demand for plasterboard to grow with a modest CAGR of 4.6% during the forecast period of 2019 to 2025.
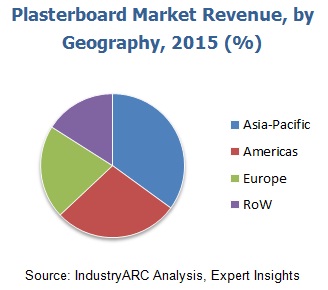
According to the United Nations ESCAP (UNESCAP), in 2013, 60% of the world’s population was attributed to APAC which translates to a whopping 4.3 billion. Even though the organization estimates that the population will observe a growth rate of 0.96% year on year, the population will shoot up to around 5 billion in 2050[2] . Now, this gradual population growth is stirring the construction industry, which is creating a major plasterboard marketplace in the APAC region which held the maximum global market share of more than 36% in 2018, according to the market expert.
Plasterboard Market Outlook:
Plasterboard, also known as drywall, wallboard, sheet rock, gyprock, gypsum board, and gypsum panel is a panel made of calcium sulfate dehydrate (dehydrate). It is widely used in walls and ceiling in various sectors such as residential and commercial. Its leading application segment is in the walls. The partitions and linings of the walls contain plasterboard because it also has soundproofing characteristic.
“The growing construction in the residential and commercial sector coupled with the on-going trend in which consumers from both the sectors have a palpable predilection for the soundproof walls will collective make the plasterboard market boom in the future,” highlights the market analyst in the plasterboard market research report. Furthermore, the analyst estimates the progression in the application CAGR of plasterboard in the walls segment to be 4.9% through to 2025.
Plasterboard Market Growth Drivers:
- The Construction Industry Growth –
As mentioned earlier, the plasterboard market is predominantly making strides because of the growing construction industry. The construction industry is further segmented into commercial and residential –
The Population Growth Supporting the Real Estate Business –
By now, it’s discernible that there is a tangible upsurge in the world’s population, and it is only going to grow. This is bringing a seismic shift in the real estate sectors with the latest trend of smart homes which significantly make use of plasterboard.
Economic Growth and the Emergence of New Commercial Buildings –
The world is at the helm of economic progress, and most of the businesses now rely on technology which is leading to new projects in commercial buildings and complexes. Now, these buildings are incorporated with the plasterboard walls, which is further flourishing the plasterboard market.
- Dry Construction Technique Gaining Prominence –
Dry Construction Technique (DCT) is 8-10 times lighter than the conventional brick construction technique and also enables 70% savings of the time which also helps the builders in to meet the targets in the turnaround time. Moreover, it reduces the use of water, thereby minimizing the impact of real estate on the environment. Now, this technique is becoming rampant in the real estate sector and leading to a remarkable growth in the demand for plasterboard.
Plasterboard Market Challenges:
The greatest challenge faced by the vendors in the plasterboard market is the fact that the old plasterboards need to be replaced by the new ones, and this is majorly attributed to their vulnerability to water contact. Now, due to the sporadic need for replacement, many customers prefer the conventional methods, and it gets difficult for the vendors to convince them about the advantage of plasterboards. However, the regular services offered by the vendors are making them overcome the challenge.
Plasterboard Market Key Players Perspective:
The key players striving to capitalize on the demand influx in the plasterboard market are Armstrong World Industries Inc., Etex Group, Saint-Gobain SA, Georgia Pacific LLC, and Gypsum Management and Supply Inc.
Plasterboard Market Trends:
- In October 2017, the gypsum wallboard and suspended ceilings distributor GMS Inc. acquired all the operating assets of Washing Builder’s Supply Company. This was attributed to GMS Inc.’s vision to position itself in the plasterboard market of Pennsylvania.
- In January 2018, Etex had become the sole shareholder of Pladur which has plasterboard or gypsum wallboard plant near Madrid, and the company is building its second plant at Gelsa.
Plasterboard Market Research Scope:
The base year of the study is 2018, with forecast done up to 2025. The study presents a thorough analysis of the competitive landscape, taking into account the market shares of the leading companies. It also provides information on unit shipments. These provide the key market participants with the necessary business intelligence and help them understand the future of the plasterboard market. The assessment includes the forecast, an overview of the competitive structure, the market shares of the competitors, as well as the market trends, market demands, market drivers, market challenges, and product analysis. The market drivers and restraints have been assessed to fathom their impact over the forecast period. This report further identifies the key opportunities for growth while also detailing the key challenges and possible threats. The key areas of focus include the types of plasterboard market, and their specific applications in the walls, ceilings, and others. Moreover, the report also digs into the plasterboard’s applications in residential and commercial buildings and how it aids to the plasterboard market growth.
Plasterboard Market Report: Industry Coverage
The report analyses the product demands by the form of product - tapered-edged, square-edged, and others.
The plasterboard market report also analyzes the major geographic regions as well as the major countries in these regions. The regions and countries covered in the study include:
- North America: The U.S., Canada, Mexico
- South America: Brazil, Venezuela, Argentina, Ecuador, Peru, Colombia, Costa Rica
- Europe: The U.K., Germany, Italy, France, the Netherlands, Belgium, Spain, Denmark
- APAC: China, Japan, Australia, South Korea, India, Taiwan, Malaysia, Hong Kong
- Middle East and Africa: Israel, South Africa, Saudi Arabia
Key Questions Addressed in the Global Plasterboard Market Report
1. Is the market for Plasterboard growing? How long will it continue to grow and at what rate?
2. Which type of paints presents the major growth opportunities?
3. Is there a possibility for change in the market structure over time?
4. Are additional developments needed for the existing product or services offerings or do the existing products meet the customer demands?
5. Do the key vendors look for partnerships to expand their businesses with respect to geography or product?
6. What is the current status of Global Plasterboard in different countries?
7. Which are the major relevant product segments within Global Plasterboard?
8. Which type of segment will witness heavy adoption in the near future?
9. What are the short-term, long-term, and medium-term growth drivers for the market?
10. What are the short-term, medium-term, and long-term challenges for the market?
11. What are the short-term, medium-term, and long-term opportunities for the market
12. Who are the top players/companies of the market?
13. What are the recent innovations in the market?
14. How many patents have been filed by the leading players?
15. What are the types of patents filed by the leading players?
16. What is the futuristic scenario for the adoption of Global Plasterboard?
17. What is our Vision 2030 Global Plasterboard Market?
A few focus points of this Research are given below:
- Give a deep-dive analysis of the key operational strategies with focus on the corporate structure, R&D strategies, localization strategies, production capabilities, and sales performance of various companies
- Provide an overview of the product portfolio, including product planning, development, and positioning
- Discuss the role of technology companies in partnerships
- Explore the regional sales activities
- Analyze the market size and giving the forecast for current and future gypsum boards during the forecast 2018–2023
- Analyze the competitive factors, competitors’ market shares, product capabilities, and supply chain structures
Reference:
[1]http://www.eurogypsum.org/about-gypsum/uses-of-plaster-and-plasterboard/
[2]https://www.unescap.org/sites/default/files/SPPS-Factsheet-Population-Trends-v3.pdf
1. Plasterboard Market – Market Overview
1.1. Definitions and Scope
2. Plasterboard Market – Executive summary
2.1. Market Revenue, Market Size and Key Trends By Company
2.2. Key Trends By Type of Application
2.3. Key Trends Segmented By Geography
3. Plasterboard Market – Comparative Analysis
3.1. Comparative Analysis
3.1.1. Product Benchmarking – Top 10 Companies
3.1.2. Top 5 Financials Analysis
3.1.3. Market Value Split By Top 10 Companies
3.1.4. Patent Analysis – Top 10 Companies
3.1.5. Pricing Analysis
4. Plasterboard Market – Startup Companies Scenario
4.1. Top 10 Startup Company Analysis By
4.1.1. Investment
4.1.2. Revenue
4.1.3. Market Shares
4.1.4. Market Size and Application Analysis
4.1.5. Venture Capital and Funding Scenario
5. Plasterboard Market – Startup Companies Scenario
5.1. Regulatory Framework Overview
5.2. New Business and Ease of Doing business index
5.3. Case studies of successful ventures
5.4. Customer Analysis – Top 10 companies
6. Plasterboard Market – Market Forces
6.1. Market Drivers
6.2. Market Constraints
6.3. Market Challenges
6.4. Porters Five Force Model
6.4.1. Bargaining Power of Suppliers
6.4.2. Bargaining Power of Customers
6.4.3. Threat of New Entrants
6.4.4. Rivalry Among Existing Players
6.4.5. Threat of Substitution
7. Plasterboard Market – Strategic Analysis
7.1. Value Chain Analysis
7.2. Opportunities Analysis
7.3. Product Life Cycle Analysis
7.4. Suppliers and Distributors
8. Plasterboard Market – By Type (Market Size - $Million/$Billion)
8.1. Market Size and Market Share Analysis
8.2. Application Revenue and Trend Research
8.3. Type Segment Analysis
8.3.1. Introduction
8.3.2. Fire-Resistant
8.3.3. Sound Insulation
8.3.4. Moisture-Resistant
8.3.5. Thermal
8.3.6. Impact-Resistant
8.3.7. Others
9. Plasterboard Market – By Form (Market Size - $Million/$Billion)
9.1. Introduction
9.2. Tapered-Edged
9.3. Square-Edged
9.4. Others
10. Plasterboard Market – By Application (Market Size - $Million/$Billion)
10.1. Introduction
10.2. Walls
10.3. Ceilings
10.4. Others
11. Plasterboard Market – By End User (Market Size - $Million/$Billion)
11.1. Market Size and Market Share Analysis
11.2. Application Revenue and Trend Research
11.3. End User Segment Analysis
11.3.1. Introduction
11.3.2. Residential
11.3.3. Commercial
11.1.1.1. Wholesale and Retail Building
11.1.1.2. Offices
11.1.1.3. Academics and Educational Buildings
11.1.1.4. Hotel and Restaurant
11.3.4. Others
12. Plasterboard Market – By Geography (Market Size - $Million/$Billion)
12.1. Plasterboard Market – North America Segment Research
12.2. North America Market Research ($Million/$Billion)
12.1.2. Segment Type Size and Market Size Analysis
12.1.3. Revenue and Trends
12.1.4. Application Revenue and Product Analysis
12.1.5. North America Product Type and Application Market Size
12.1.5.1. U.S.
12.1.5.2. Canada
12.1.5.3. Mexico
12.3. Plasterboard Market – South America Segment Research
12.4. South America Market Research ($Million/$Billion)
12.1.6. Segment Type Size and Market Size Analysis
12.1.7. Revenue and Trends
12.1.8. Application Revenue and Product Analysis
12.1.9. South America Product Type and Application Market Size
12.1.9.1. Brazil
12.1.9.2. Venezuela
12.1.9.3. Argentina
12.1.9.4. Ecuador
12.1.9.5. Peru
12.1.9.6. Colombia
12.1.9.7. Costa Rica
12.1.9.8. Rest of South America
12.5. Plasterboard Market – Europe Segment Research
12.6. Europe Market Research ($Million/$Billion)
12.1.10. Segment Type Size and Market Size Analysis
12.1.11. Revenue and Trends
12.1.12. Application Revenue and Product Analysis
12.1.13. Europe Product Type and Application Market Size
12.1.13.1. U.K
12.1.13.2. Germany
12.1.13.3. Italy
12.1.13.4. France
12.1.13.5. Netherlands
12.1.13.6. Belgium
12.1.13.7. Spain
12.1.13.8. Denmark
12.1.13.9. Rest of Europe
12.7. Plasterboard Market – APAC Segment Research
12.8. APAC Market Research ($Million/$Billion)
12.1.14. Segment Type Size and Market Size Analysis
12.1.15. Revenue and Trends
12.1.16. Application Revenue and Product Analysis
12.1.17. APAC Product Type and Application Market Size
12.1.17.1. China
12.1.17.2. Australia
12.1.17.3. South Korea
12.1.17.4. India
12.1.17.5. Taiwan
12.1.17.6. Malaysia
12.1.17.7. Hong Kong
12.1.17.8. Rest of APAC
12.9. Plasterboard Market – Rest of the World Segment Research
12.10. Rest of the World Market Research ($Million/$Billion)
12.1.18. Segment Type Size and Market Size Analysis
12.1.19. Revenue and Trends
12.1.20. Application Revenue and Product Analysis
12.1.21. Rest of the World Product Type and Application Market Size
12.1.21.1. Middle East
12.1.21.2. Africa
13. Plasterboard Market – Market Entropy
13.1. New Product Launches
13.2. M&As, Collaborations, JVs and Partnerships
14. Plasterboard Market – Market Share
14.1. Market Share Analysis
14.1.1. Market Share By Country – Top Companies
14.1.2. Market Share By Region – Top 10 Companies
14.1.3. Market Share By Type of Application – Top 10 Companies
14.1.4. Market Share By Type of Product / Product Category – Top 10 Companies
14.1.5. Market Share at Global Level – Top 10 Companies
14.1.6. Best Practices for Companies
15. Plasterboard Market – Key Company List By Country
16. Plasterboard Market – Company Analysis
16.1. Market Share, Company Revenue, Products, M&A, Developments
16.1.1. Armstrong World Industries, Inc.
16.1.2. USG Boral Limited
16.1.3. BGC Plasterboard
16.1.4. ETEX Group
16.1.5. Fletcher Building Limited
16.1.6. Georgia Pacific LLC
16.1.7. Gypsum Management and Supply Inc.
16.1.8. Saint Gobain
16.1.9. Knauf Dywall
16.1.10. Lafargeholcim Ltd.
16.1.11. Others
"*Financials would be provided on a best efforts basis for private companies"
17. Plasterboard Market – Appendix
17.1. Abbreviations
17.2. Sources
18. Plasterboard Market – Research Methodology
18.1. Research Methodology
18.1.1. Company Expert
18.1.2. Industry Database
18.1.3. Associations
18.1.4. Company News
18.1.5. Company Annual Reports
18.1.6. Application Trends
18.1.7. New Products and Product Database
18.1.8. Company Transcripts
18.1.9. R&D Trends
18.1.10. Key Opinion Leaders Interviews
18.1.11. Supply and Demand Trends
List of Tables
Table 1 Plasterboard Market Overview 2021-2026
Table 2 Plasterboard Market Leader Analysis 2018-2019 (US$)
Table 3 Plasterboard MarketProduct Analysis 2018-2019 (US$)
Table 4 Plasterboard MarketEnd User Analysis 2018-2019 (US$)
Table 5 Plasterboard MarketPatent Analysis 2013-2018* (US$)
Table 6 Plasterboard MarketFinancial Analysis 2018-2019 (US$)
Table 7 Plasterboard Market Driver Analysis 2018-2019 (US$)
Table 8 Plasterboard MarketChallenges Analysis 2018-2019 (US$)
Table 9 Plasterboard MarketConstraint Analysis 2018-2019 (US$)
Table 10 Plasterboard Market Supplier Bargaining Power Analysis 2018-2019 (US$)
Table 11 Plasterboard Market Buyer Bargaining Power Analysis 2018-2019 (US$)
Table 12 Plasterboard Market Threat of Substitutes Analysis 2018-2019 (US$)
Table 13 Plasterboard Market Threat of New Entrants Analysis 2018-2019 (US$)
Table 14 Plasterboard Market Degree of Competition Analysis 2018-2019 (US$)
Table 15 Plasterboard MarketValue Chain Analysis 2018-2019 (US$)
Table 16 Plasterboard MarketPricing Analysis 2021-2026 (US$)
Table 17 Plasterboard MarketOpportunities Analysis 2021-2026 (US$)
Table 18 Plasterboard MarketProduct Life Cycle Analysis 2021-2026 (US$)
Table 19 Plasterboard MarketSupplier Analysis 2018-2019 (US$)
Table 20 Plasterboard MarketDistributor Analysis 2018-2019 (US$)
Table 21 Plasterboard Market Trend Analysis 2018-2019 (US$)
Table 22 Plasterboard Market Size 2018 (US$)
Table 23 Plasterboard Market Forecast Analysis 2021-2026 (US$)
Table 24 Plasterboard Market Sales Forecast Analysis 2021-2026 (Units)
Table 25 Plasterboard Market, Revenue & Volume,By Type, 2021-2026 ($)
Table 26 Plasterboard MarketBy Type, Revenue & Volume,By Standard, 2021-2026 ($)
Table 27 Plasterboard MarketBy Type, Revenue & Volume,By Fire-Resistant, 2021-2026 ($)
Table 28 Plasterboard MarketBy Type, Revenue & Volume,By Sound Insulation, 2021-2026 ($)
Table 29 Plasterboard MarketBy Type, Revenue & Volume,By Moisture-Resistant, 2021-2026 ($)
Table 30 Plasterboard MarketBy Type, Revenue & Volume,By Thermal, 2021-2026 ($)
Table 31 Plasterboard Market, Revenue & Volume,By Form, 2021-2026 ($)
Table 32 Plasterboard MarketBy Form, Revenue & Volume,By Tapered-Edged, 2021-2026 ($)
Table 33 Plasterboard MarketBy Form, Revenue & Volume,By Square-Edged, 2021-2026 ($)
Table 34 Plasterboard Market, Revenue & Volume,By Application, 2021-2026 ($)
Table 35 Plasterboard MarketBy Application, Revenue & Volume,By Residential, 2021-2026 ($)
Table 36 Plasterboard MarketBy Application, Revenue & Volume,By Commercial, 2021-2026 ($)
Table 37 North America Plasterboard Market, Revenue & Volume,By Type, 2021-2026 ($)
Table 38 North America Plasterboard Market, Revenue & Volume,By Form, 2021-2026 ($)
Table 39 North America Plasterboard Market, Revenue & Volume,By Application, 2021-2026 ($)
Table 40 South america Plasterboard Market, Revenue & Volume,By Type, 2021-2026 ($)
Table 41 South america Plasterboard Market, Revenue & Volume,By Form, 2021-2026 ($)
Table 42 South america Plasterboard Market, Revenue & Volume,By Application, 2021-2026 ($)
Table 43 Europe Plasterboard Market, Revenue & Volume,By Type, 2021-2026 ($)
Table 44 Europe Plasterboard Market, Revenue & Volume,By Form, 2021-2026 ($)
Table 45 Europe Plasterboard Market, Revenue & Volume,By Application, 2021-2026 ($)
Table 46 APAC Plasterboard Market, Revenue & Volume,By Type, 2021-2026 ($)
Table 47 APAC Plasterboard Market, Revenue & Volume,By Form, 2021-2026 ($)
Table 48 APAC Plasterboard Market, Revenue & Volume,By Application, 2021-2026 ($)
Table 49 Middle East & Africa Plasterboard Market, Revenue & Volume,By Type, 2021-2026 ($)
Table 50 Middle East & Africa Plasterboard Market, Revenue & Volume,By Form, 2021-2026 ($)
Table 51 Middle East & Africa Plasterboard Market, Revenue & Volume,By Application, 2021-2026 ($)
Table 52 Russia Plasterboard Market, Revenue & Volume,By Type, 2021-2026 ($)
Table 53 Russia Plasterboard Market, Revenue & Volume,By Form, 2021-2026 ($)
Table 54 Russia Plasterboard Market, Revenue & Volume,By Application, 2021-2026 ($)
Table 55 Israel Plasterboard Market, Revenue & Volume,By Type, 2021-2026 ($)
Table 56 Israel Plasterboard Market, Revenue & Volume,By Form, 2021-2026 ($)
Table 57 Israel Plasterboard Market, Revenue & Volume,By Application, 2021-2026 ($)
Table 58 Top Companies 2018 (US$)Plasterboard Market, Revenue & Volume,,
Table 59 Product Launch 2018-2019Plasterboard Market, Revenue & Volume,,
Table 60 Mergers & Acquistions 2018-2019Plasterboard Market, Revenue & Volume,,
List of Figures
Figure 1 Overview of Plasterboard Market 2021-2026
Figure 2 Market Share Analysis for Plasterboard Market 2018 (US$)
Figure 3 Product Comparison in Plasterboard Market 2018-2019 (US$)
Figure 4 End User Profile for Plasterboard Market 2018-2019 (US$)
Figure 5 Patent Application and Grant in Plasterboard Market 2013-2018* (US$)
Figure 6 Top 5 Companies Financial Analysis in Plasterboard Market 2018-2019 (US$)
Figure 7 Market Entry Strategy in Plasterboard Market 2018-2019
Figure 8 Ecosystem Analysis in Plasterboard Market2018
Figure 9 Average Selling Price in Plasterboard Market 2021-2026
Figure 10 Top Opportunites in Plasterboard Market 2018-2019
Figure 11 Market Life Cycle Analysis in Plasterboard Market
Figure 12 GlobalBy TypePlasterboard Market Revenue, 2021-2026 ($)
Figure 13 GlobalBy FormPlasterboard Market Revenue, 2021-2026 ($)
Figure 15 GlobalBy ApplicationPlasterboard Market Revenue, 2021-2026 ($)
Figure 17 Global Plasterboard Market - By Geography
Figure 18 Global Plasterboard Market Value & Volume, By Geography, 2021-2026 ($)
Figure 19 Global Plasterboard Market CAGR, By Geography, 2021-2026 (%)
Figure 20 North America Plasterboard Market Value & Volume, 2021-2026 ($)
Figure 21 US Plasterboard Market Value & Volume, 2021-2026 ($)
Figure 22 US GDP and Population, 2018-2019 ($)
Figure 23 US GDP – Composition of 2018, By Sector of Origin
Figure 24 US Export and Import Value & Volume, 2018-2019 ($)
Figure 25 Canada Plasterboard Market Value & Volume, 2021-2026 ($)
Figure 26 Canada GDP and Population, 2018-2019 ($)
Figure 27 Canada GDP – Composition of 2018, By Sector of Origin
Figure 28 Canada Export and Import Value & Volume, 2018-2019 ($)
Figure 29 Mexico Plasterboard Market Value & Volume, 2021-2026 ($)
Figure 30 Mexico GDP and Population, 2018-2019 ($)
Figure 31 Mexico GDP – Composition of 2018, By Sector of Origin
Figure 32 Mexico Export and Import Value & Volume, 2018-2019 ($)
Figure 33 South America Plasterboard MarketSouth America 3D Printing Market Value & Volume, 2021-2026 ($)
Figure 34 Brazil Plasterboard Market Value & Volume, 2021-2026 ($)
Figure 35 Brazil GDP and Population, 2018-2019 ($)
Figure 36 Brazil GDP – Composition of 2018, By Sector of Origin
Figure 37 Brazil Export and Import Value & Volume, 2018-2019 ($)
Figure 38 Venezuela Plasterboard Market Value & Volume, 2021-2026 ($)
Figure 39 Venezuela GDP and Population, 2018-2019 ($)
Figure 40 Venezuela GDP – Composition of 2018, By Sector of Origin
Figure 41 Venezuela Export and Import Value & Volume, 2018-2019 ($)
Figure 42 Argentina Plasterboard Market Value & Volume, 2021-2026 ($)
Figure 43 Argentina GDP and Population, 2018-2019 ($)
Figure 44 Argentina GDP – Composition of 2018, By Sector of Origin
Figure 45 Argentina Export and Import Value & Volume, 2018-2019 ($)
Figure 46 Ecuador Plasterboard Market Value & Volume, 2021-2026 ($)
Figure 47 Ecuador GDP and Population, 2018-2019 ($)
Figure 48 Ecuador GDP – Composition of 2018, By Sector of Origin
Figure 49 Ecuador Export and Import Value & Volume, 2018-2019 ($)
Figure 50 Peru Plasterboard Market Value & Volume, 2021-2026 ($)
Figure 51 Peru GDP and Population, 2018-2019 ($)
Figure 52 Peru GDP – Composition of 2018, By Sector of Origin
Figure 53 Peru Export and Import Value & Volume, 2018-2019 ($)
Figure 54 Colombia Plasterboard Market Value & Volume, 2021-2026 ($)
Figure 55 Colombia GDP and Population, 2018-2019 ($)
Figure 56 Colombia GDP – Composition of 2018, By Sector of Origin
Figure 57 Colombia Export and Import Value & Volume, 2018-2019 ($)
Figure 58 Costa Rica Plasterboard MarketCosta Rica 3D Printing Market Value & Volume, 2021-2026 ($)
Figure 59 Costa Rica GDP and Population, 2018-2019 ($)
Figure 60 Costa Rica GDP – Composition of 2018, By Sector of Origin
Figure 61 Costa Rica Export and Import Value & Volume, 2018-2019 ($)
Figure 62 Europe Plasterboard Market Value & Volume, 2021-2026 ($)
Figure 63 U.K Plasterboard Market Value & Volume, 2021-2026 ($)
Figure 64 U.K GDP and Population, 2018-2019 ($)
Figure 65 U.K GDP – Composition of 2018, By Sector of Origin
Figure 66 U.K Export and Import Value & Volume, 2018-2019 ($)
Figure 67 Germany Plasterboard Market Value & Volume, 2021-2026 ($)
Figure 68 Germany GDP and Population, 2018-2019 ($)
Figure 69 Germany GDP – Composition of 2018, By Sector of Origin
Figure 70 Germany Export and Import Value & Volume, 2018-2019 ($)
Figure 71 Italy Plasterboard Market Value & Volume, 2021-2026 ($)
Figure 72 Italy GDP and Population, 2018-2019 ($)
Figure 73 Italy GDP – Composition of 2018, By Sector of Origin
Figure 74 Italy Export and Import Value & Volume, 2018-2019 ($)
Figure 75 France Plasterboard Market Value & Volume, 2021-2026 ($)
Figure 76 France GDP and Population, 2018-2019 ($)
Figure 77 France GDP – Composition of 2018, By Sector of Origin
Figure 78 France Export and Import Value & Volume, 2018-2019 ($)
Figure 79 Netherlands Plasterboard Market Value & Volume, 2021-2026 ($)
Figure 80 Netherlands GDP and Population, 2018-2019 ($)
Figure 81 Netherlands GDP – Composition of 2018, By Sector of Origin
Figure 82 Netherlands Export and Import Value & Volume, 2018-2019 ($)
Figure 83 Belgium Plasterboard Market Value & Volume, 2021-2026 ($)
Figure 84 Belgium GDP and Population, 2018-2019 ($)
Figure 85 Belgium GDP – Composition of 2018, By Sector of Origin
Figure 86 Belgium Export and Import Value & Volume, 2018-2019 ($)
Figure 87 Spain Plasterboard Market Value & Volume, 2021-2026 ($)
Figure 88 Spain GDP and Population, 2018-2019 ($)
Figure 89 Spain GDP – Composition of 2018, By Sector of Origin
Figure 90 Spain Export and Import Value & Volume, 2018-2019 ($)
Figure 91 Denmark Plasterboard Market Value & Volume, 2021-2026 ($)
Figure 92 Denmark GDP and Population, 2018-2019 ($)
Figure 93 Denmark GDP – Composition of 2018, By Sector of Origin
Figure 94 Denmark Export and Import Value & Volume, 2018-2019 ($)
Figure 95 APAC Plasterboard Market Value & Volume, 2021-2026 ($)
Figure 96 China Plasterboard MarketValue & Volume, 2021-2026
Figure 97 China GDP and Population, 2018-2019 ($)
Figure 98 China GDP – Composition of 2018, By Sector of Origin
Figure 99 China Export and Import Value & Volume, 2018-2019 ($)Plasterboard MarketChina Export and Import Value & Volume, 2018-2019 ($)
Figure 100 Australia Plasterboard Market Value & Volume, 2021-2026 ($)
Figure 101 Australia GDP and Population, 2018-2019 ($)
Figure 102 Australia GDP – Composition of 2018, By Sector of Origin
Figure 103 Australia Export and Import Value & Volume, 2018-2019 ($)
Figure 104 South Korea Plasterboard Market Value & Volume, 2021-2026 ($)
Figure 105 South Korea GDP and Population, 2018-2019 ($)
Figure 106 South Korea GDP – Composition of 2018, By Sector of Origin
Figure 107 South Korea Export and Import Value & Volume, 2018-2019 ($)
Figure 108 India Plasterboard Market Value & Volume, 2021-2026 ($)
Figure 109 India GDP and Population, 2018-2019 ($)
Figure 110 India GDP – Composition of 2018, By Sector of Origin
Figure 111 India Export and Import Value & Volume, 2018-2019 ($)
Figure 112 Taiwan Plasterboard MarketTaiwan 3D Printing Market Value & Volume, 2021-2026 ($)
Figure 113 Taiwan GDP and Population, 2018-2019 ($)
Figure 114 Taiwan GDP – Composition of 2018, By Sector of Origin
Figure 115 Taiwan Export and Import Value & Volume, 2018-2019 ($)
Figure 116 Malaysia Plasterboard MarketMalaysia 3D Printing Market Value & Volume, 2021-2026 ($)
Figure 117 Malaysia GDP and Population, 2018-2019 ($)
Figure 118 Malaysia GDP – Composition of 2018, By Sector of Origin
Figure 119 Malaysia Export and Import Value & Volume, 2018-2019 ($)
Figure 120 Hong Kong Plasterboard MarketHong Kong 3D Printing Market Value & Volume, 2021-2026 ($)
Figure 121 Hong Kong GDP and Population, 2018-2019 ($)
Figure 122 Hong Kong GDP – Composition of 2018, By Sector of Origin
Figure 123 Hong Kong Export and Import Value & Volume, 2018-2019 ($)
Figure 124 Middle East & Africa Plasterboard MarketMiddle East & Africa 3D Printing Market Value & Volume, 2021-2026 ($)
Figure 125 Russia Plasterboard MarketRussia 3D Printing Market Value & Volume, 2021-2026 ($)
Figure 126 Russia GDP and Population, 2018-2019 ($)
Figure 127 Russia GDP – Composition of 2018, By Sector of Origin
Figure 128 Russia Export and Import Value & Volume, 2018-2019 ($)
Figure 129 Israel Plasterboard Market Value & Volume, 2021-2026 ($)
Figure 130 Israel GDP and Population, 2018-2019 ($)
Figure 131 Israel GDP – Composition of 2018, By Sector of Origin
Figure 132 Israel Export and Import Value & Volume, 2018-2019 ($)
Figure 133 Entropy Share, By Strategies, 2018-2019* (%)Plasterboard Market
Figure 134 Developments, 2018-2019*Plasterboard Market
Figure 135 Company 1 Plasterboard Market Net Revenue, By Years, 2018-2019* ($)
Figure 136 Company 1 Plasterboard Market Net Revenue Share, By Business segments, 2018 (%)
Figure 137 Company 1 Plasterboard Market Net Sales Share, By Geography, 2018 (%)
Figure 138 Company 2 Plasterboard Market Net Revenue, By Years, 2018-2019* ($)
Figure 139 Company 2 Plasterboard Market Net Revenue Share, By Business segments, 2018 (%)
Figure 140 Company 2 Plasterboard Market Net Sales Share, By Geography, 2018 (%)
Figure 141 Company 3Plasterboard Market Net Revenue, By Years, 2018-2019* ($)
Figure 142 Company 3Plasterboard Market Net Revenue Share, By Business segments, 2018 (%)
Figure 143 Company 3Plasterboard Market Net Sales Share, By Geography, 2018 (%)
Figure 144 Company 4 Plasterboard Market Net Revenue, By Years, 2018-2019* ($)
Figure 145 Company 4 Plasterboard Market Net Revenue Share, By Business segments, 2018 (%)
Figure 146 Company 4 Plasterboard Market Net Sales Share, By Geography, 2018 (%)
Figure 147 Company 5 Plasterboard Market Net Revenue, By Years, 2018-2019* ($)
Figure 148 Company 5 Plasterboard Market Net Revenue Share, By Business segments, 2018 (%)
Figure 149 Company 5 Plasterboard Market Net Sales Share, By Geography, 2018 (%)
Figure 150 Company 6 Plasterboard Market Net Revenue, By Years, 2018-2019* ($)
Figure 151 Company 6 Plasterboard Market Net Revenue Share, By Business segments, 2018 (%)
Figure 152 Company 6 Plasterboard Market Net Sales Share, By Geography, 2018 (%)
Figure 153 Company 7 Plasterboard Market Net Revenue, By Years, 2018-2019* ($)
Figure 154 Company 7 Plasterboard Market Net Revenue Share, By Business segments, 2018 (%)
Figure 155 Company 7 Plasterboard Market Net Sales Share, By Geography, 2018 (%)
Figure 156 Company 8 Plasterboard Market Net Revenue, By Years, 2018-2019* ($)
Figure 157 Company 8 Plasterboard Market Net Revenue Share, By Business segments, 2018 (%)
Figure 158 Company 8 Plasterboard Market Net Sales Share, By Geography, 2018 (%)
Figure 159 Company 9 Plasterboard Market Net Revenue, By Years, 2018-2019* ($)
Figure 160 Company 9 Plasterboard Market Net Revenue Share, By Business segments, 2018 (%)
Figure 161 Company 9 Plasterboard Market Net Sales Share, By Geography, 2018 (%)
Figure 162 Company 10 Plasterboard Market Net Revenue, By Years, 2018-2019* ($)
Figure 163 Company 10 Plasterboard Market Net Revenue Share, By Business segments, 2018 (%)
Figure 164 Company 10 Plasterboard Market Net Sales Share, By Geography, 2018 (%)
Figure 165 Company 11 Plasterboard Market Net Revenue, By Years, 2018-2019* ($)
Figure 166 Company 11 Plasterboard Market Net Revenue Share, By Business segments, 2018 (%)
Figure 167 Company 11 Plasterboard Market Net Sales Share, By Geography, 2018 (%)
Figure 168 Company 12 Plasterboard Market Net Revenue, By Years, 2018-2019* ($)
Figure 169 Company 12 Plasterboard Market Net Revenue Share, By Business segments, 2018 (%)
Figure 170 Company 12 Plasterboard Market Net Sales Share, By Geography, 2018 (%)
Figure 171 Company 13Plasterboard Market Net Revenue, By Years, 2018-2019* ($)
Figure 172 Company 13Plasterboard Market Net Revenue Share, By Business segments, 2018 (%)
Figure 173 Company 13Plasterboard Market Net Sales Share, By Geography, 2018 (%)
Figure 174 Company 14 Plasterboard Market Net Revenue, By Years, 2018-2019* ($)
Figure 175 Company 14 Plasterboard Market Net Revenue Share, By Business segments, 2018 (%)
Figure 176 Company 14 Plasterboard Market Net Sales Share, By Geography, 2018 (%)
Figure 177 Company 15 Plasterboard Market Net Revenue, By Years, 2018-2019* ($)
Figure 178 Company 15 Plasterboard Market Net Revenue Share, By Business segments, 2018 (%)
Figure 179 Company 15 Plasterboard Market Net Sales Share, By Geography, 2018 (%)