 Email
Email Print
Print


Latin America Polyolefin Market - Forecast(2024 - 2030)
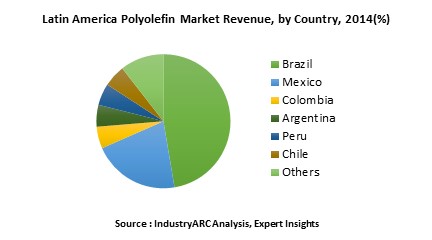
The Latin America Polyolefin Market is estimated to surpass $15.3 billion marks by 2023 growing at an estimated CAGR of more than 3.9% during 2018 to 2023. Packaging industry is having the highest market share in the year 2017 and is followed by Textile & fittings which is valued $4.2 billion and $3.3 billion respectively in the year 2017 and is anticipated to grow with a CAGR of 3.3% and 3.6% from the year 2018 to 2023. Brazil is having the highest market share with $7.3 billion and it is anticipated to grow with a CAGR of 4% during 2018 to 2023.
What is Polyolefin?
Polyolefin is a polymer that is created by polymerization of simple olefins. Olefins, also called as alkenes, are hydrocarbons with a carbon-hydrogen double bond. Polyolefin are hard, light in weight, and rigid in nature. They are majorly applied in structural plastics, Pipes & fittings, consumer goods, industrial products, and food packaging. They have waxy character and expand upon heating. They also retain their odorless and nonporous tendency when heated and cooled. This makes them a perfect material for food packaging. Polyolefin are chosen over other metallic and non-metallic substitutes due to less weight, durability, and resistance to physical and chemical attacks.
What are the major applications for Polyolefin?
The various end users assessed include consumer products, automotive, healthcare, pipes & fittings, energy and others. In automotive, polyolefin plastic materials are used in a wide range of exterior, interior, and under-the-bonnet applications. These include body panels, trims, dashboards, bumpers door claddings, climate control and cooling systems, air intake manifolds and battery cases. In healthcare, polyolefin are used for making syringes, inhalers, medical equipment, closures, trays, bags, and blister packs.
Market Research and Market Trends of polyolefin
- LOTTE CHEMICAL CORPORATION received a patent for inventing a new method of purifying polyolefin. According to this purification process, residual alkene monomers with high carbon numbers may be removed in a simpler and more efficient manner. Previously, to remove residual monomers from polyolefin prepared by the gas-phase polymerization process, the polyolefin was purged with nitrogen gas as a purge gas to vaporize residual monomers, which were then separated from the polyolefin.
Who are the Major Players in Latin America Polyolefin Market?
The companies referred in the market research report include the Braskem S.A, Borealis AG, Petróleos Mexicanos S.A. De C.V, The Dow Chemical Co and 10 others.
What is our report scope?
The report incorporates in-depth assessment of the competitive landscape, product market sizing, product benchmarking, market trends, product developments, financial analysis, strategic analysis and so on to gauge the impact forces and potential opportunities of the market. Apart from this the report also includes a study of major developments in the market such as product launches, agreements, acquisitions, collaborations, mergers and so on to comprehend the prevailing market dynamics at present and its impact during the forecast period 2018-2023.
All our reports are customizable to your company needs to a certain extent, we do provide 20 free consulting hours along with purchase of each report, and this will allow you to request any additional data to customize the report to your needs.
Key Takeaways from this Report
- Evaluate market potential through analyzing growth rates (CAGR %), Volume (Units) and Value ($M) data given at country level – for product types, end use applications and by different industry verticals.
- Understand the different dynamics influencing the market – key driving factors, challenges and hidden opportunities.
- Get in-depth insights on your competitor performance – market shares, strategies, financial benchmarking, product benchmarking, SWOT and more.
- Analyze the sales and distribution channels across key geographies to improve top-line revenues.
- Understand the industry supply chain with a deep-dive on the value augmentation at each step, in order to optimize value and bring efficiencies in your processes.
- Get a quick outlook on the market entropy – M&A’s, deals, partnerships, product launches of all key players for the past 4 years.
- Evaluate the supply-demand gaps, import-export statistics and regulatory landscape for more than top 20 countries globally for the market.
1. Latin America Polyolefin Market Overview
2. Executive Summary
3. Latin America Polyolefin Market Landscape
3.1. Market Share Analysis
3.2. Comparative Analysis
3.2.1. Product Benchmarking
3.2.2. End User profiling
3.2.3. Patent Analysis
3.2.4. Top 5 Financials Analysis
4. Latin America Polyolefin Market Forces
4.1. Market Drivers
4.2. Market Constraints
4.3. Market Challenges
4.4. Attractiveness of the Industry
4.4.1. Power of Suppliers
4.4.2. Power of Customers
4.4.3. Threat of New entrants
4.4.4. Threat of Substitution
4.4.5. Degree of Competition
5. Latin America Polyolefin Market – Strategic Analysis
5.1. Value Chain Analysis
5.2. Pricing Analysis
5.3. Opportunities Analysis
5.4. Product/Market Life Cycle Analysis
5.5. Suppliers and Distributors
6. Latin America Polyolefin Market – By Type
6.1. Thermoplastic
6.1.1. Polyethylene
6.1.1.1. Linear Low-Density polyethylene(LLDPE)
6.1.1.2. Low-Density polyethylene (LDPE)
6.1.1.3. High-Density polyethylene(HDPE)
6.1.2. Polypropylene
6.2. Elastomeric
6.2.1. Ethylene Propylene diene monomer(EPDM) rubber
6.2.2. Polyisobutylene(PIB)
7. Latin America Polyolefin Market – By Process
7.1. Introduction
7.2. Blow Molding
7.3. Film & Sheet
7.4. Injection Molding
7.5. Pipe & Extrusion
7.6. Rotomolding
7.7. Extrusion Coating
7.8. Wire & Cable
7.9. Raffia
7.10. Fiber
7.11. Others
8. Latin America Polyolefin Market – By Application
8.1. Introduction
8.2. Films
8.3. Consumer Products
8.3.1. Flexible Packaging
8.3.1.1. lamination film
8.3.1.2. stand-up pouches
8.3.1.3. food packaging
8.3.1.4. shrink and protection film
8.3.2. Rigid packaging
8.3.2.1. caps and closures
8.3.2.2. bottles
8.3.2.3. thin wall and transport packaging
8.3.3. Non-woven and technical fibres
8.3.3.1. filtration systems
8.3.3.2. hygiene products
8.3.3.3. technical textiles
8.4. Automotive
8.4.1. Bumpers
8.4.2. Body panels
8.4.3. Trims
8.4.4. Dashboards
8.4.5. Door claddings
8.4.6. Cooling systems
8.5. Healthcare
8.6. Wires & cables
8.7. Pipes & fittings
8.8. Others
9. Latin America Polyolefin Market - By Country
9.1. Introduction
9.2. Brazil
9.3. Mexico
9.4. Colombia
9.5. Argentina
9.6. Peru
9.7. Chile
9.8. Others
10. Market Entropy
10.1. New Product Launches
10.2. M&As, Collaborations, JVs, Partnership
11. Company Profiles (Overview, Financials, SWOT Analysis, Developments, Product Portfolio)
11.1. Braskem S.A
11.2. Borealis AG
11.3. Petróleos Mexicanos S.A. De C.V
11.4. The Dow Chemical Co
11.5. Company 5
11.6. Company 6
11.7. Company 7
11.8. Company 8
11.9. Company 9
*More than 10 Companies are profiled in this Research Report*
"*Financials would be provided on a best efforts basis for private companies"
12. Appendix
12.1. Abbreviations
12.2. Sources
12.3. Research Methodology
12.4. Bibliography
12.5. Compilation of Expert Insights
12.6. Disclaimer
List of Tables
Table1 Latin America Polyolefin Market Overview 2021-2026
Table2 Latin America Polyolefin Market Leader Analysis 2018-2019 (US$)
Table3 Latin America Polyolefin Market Product Analysis 2018-2019 (US$)
Table4 Latin America Polyolefin Market End User Analysis 2018-2019 (US$)
Table5 Latin America Polyolefin Market Patent Analysis 2013-2018* (US$)
Table6 Latin America Polyolefin Market Financial Analysis 2018-2019 (US$)
Table7 Latin America Polyolefin Market Driver Analysis 2018-2019 (US$)
Table8 Latin America Polyolefin Market Challenges Analysis 2018-2019 (US$)
Table9 Latin America Polyolefin Market Constraint Analysis 2018-2019 (US$)
Table10 Latin America Polyolefin Market Supplier Bargaining Power Analysis 2018-2019 (US$)
Table11 Latin America Polyolefin Market Buyer Bargaining Power Analysis 2018-2019 (US$)
Table12 Latin America Polyolefin Market Threat of Substitutes Analysis 2018-2019 (US$)
Table13 Latin America Polyolefin Market Threat of New Entrants Analysis 2018-2019 (US$)
Table14 Latin America Polyolefin Market Degree of Competition Analysis 2018-2019 (US$)
Table15 Latin America Polyolefin Market Value Chain Analysis 2018-2019 (US$)
Table16 Latin America Polyolefin Market Pricing Analysis 2021-2026 (US$)
Table17 Latin America Polyolefin Market Opportunities Analysis 2021-2026 (US$)
Table18 Latin America Polyolefin Market Product Life Cycle Analysis 2021-2026 (US$)
Table19 Latin America Polyolefin Market Supplier Analysis 2018-2019 (US$)
Table20 Latin America Polyolefin Market Distributor Analysis 2018-2019 (US$)
Table21 Latin America Polyolefin Market Trend Analysis 2018-2019 (US$)
Table22 Latin America Polyolefin Market Size 2018 (US$)
Table23 Latin America Polyolefin Market Forecast Analysis 2021-2026 (US$)
Table24 Latin America Polyolefin Market Sales Forecast Analysis 2021-2026 (Units)
Table25 Latin America Polyolefin Market , Revenue & Volume,By Type, 2021-2026 ($)
Table26 Latin America Polyolefin Market By Type, Revenue & Volume,By Polyethylene, 2021-2026 ($)
Table27 Latin America Polyolefin Market By Type, Revenue & Volume,By Polypropylene, 2021-2026 ($)
Table28 Latin America Polyolefin Market , Revenue & Volume,By Process, 2021-2026 ($)
Table29 Latin America Polyolefin Market By Process, Revenue & Volume,By Blow Molding, 2021-2026 ($)
Table30 Latin America Polyolefin Market By Process, Revenue & Volume,By Film & Sheet, 2021-2026 ($)
Table31 Latin America Polyolefin Market By Process, Revenue & Volume,By Injection Molding, 2021-2026 ($)
Table32 Latin America Polyolefin Market By Process, Revenue & Volume,By Pipe & Extrusion, 2021-2026 ($)
Table33 Latin America Polyolefin Market By Process, Revenue & Volume,By Rotomolding, 2021-2026 ($)
Table34 Latin America Polyolefin Market , Revenue & Volume,By Application, 2021-2026 ($)
Table35 Latin America Polyolefin Market By Application, Revenue & Volume,By Films, 2021-2026 ($)
Table36 Latin America Polyolefin Market By Application, Revenue & Volume,By Packaging, 2021-2026 ($)
Table37 Latin America Polyolefin Market By Application, Revenue & Volume,By Consumer Products, 2021-2026 ($)
Table38 Latin America Polyolefin Market By Application, Revenue & Volume,By Automobile, 2021-2026 ($)
Table39 Latin America Polyolefin Market By Application, Revenue & Volume,By Textiles & Fittings, 2021-2026 ($)
Table40 North America Latin America Polyolefin Market , Revenue & Volume,By Type, 2021-2026 ($)
Table41 North America Latin America Polyolefin Market , Revenue & Volume,By Process, 2021-2026 ($)
Table42 North America Latin America Polyolefin Market , Revenue & Volume,By Application, 2021-2026 ($)
Table43 South america Latin America Polyolefin Market , Revenue & Volume,By Type, 2021-2026 ($)
Table44 South america Latin America Polyolefin Market , Revenue & Volume,By Process, 2021-2026 ($)
Table45 South america Latin America Polyolefin Market , Revenue & Volume,By Application, 2021-2026 ($)
Table46 Europe Latin America Polyolefin Market , Revenue & Volume,By Type, 2021-2026 ($)
Table47 Europe Latin America Polyolefin Market , Revenue & Volume,By Process, 2021-2026 ($)
Table48 Europe Latin America Polyolefin Market , Revenue & Volume,By Application, 2021-2026 ($)
Table49 APAC Latin America Polyolefin Market , Revenue & Volume,By Type, 2021-2026 ($)
Table50 APAC Latin America Polyolefin Market , Revenue & Volume,By Process, 2021-2026 ($)
Table51 APAC Latin America Polyolefin Market , Revenue & Volume,By Application, 2021-2026 ($)
Table52 Middle East & Africa Latin America Polyolefin Market , Revenue & Volume,By Type, 2021-2026 ($)
Table53 Middle East & Africa Latin America Polyolefin Market , Revenue & Volume,By Process, 2021-2026 ($)
Table54 Middle East & Africa Latin America Polyolefin Market , Revenue & Volume,By Application, 2021-2026 ($)
Table55 Russia Latin America Polyolefin Market , Revenue & Volume,By Type, 2021-2026 ($)
Table56 Russia Latin America Polyolefin Market , Revenue & Volume,By Process, 2021-2026 ($)
Table57 Russia Latin America Polyolefin Market , Revenue & Volume,By Application, 2021-2026 ($)
Table58 Israel Latin America Polyolefin Market , Revenue & Volume,By Type, 2021-2026 ($)
Table59 Israel Latin America Polyolefin Market , Revenue & Volume,By Process, 2021-2026 ($)
Table60 Israel Latin America Polyolefin Market , Revenue & Volume,By Application, 2021-2026 ($)
Table61 Top Companies 2018 (US$)Latin America Polyolefin Market , Revenue & Volume,,
Table62 Product Launch 2018-2019Latin America Polyolefin Market , Revenue & Volume,,
Table63 Mergers & Acquistions 2018-2019Latin America Polyolefin Market , Revenue & Volume,,
List of Figures
Figure 1 Overview of Latin America Polyolefin Market 2021-2026
Figure 2 Market Share Analysis for Latin America Polyolefin Market 2018 (US$)
Figure 3 Product Comparison in Latin America Polyolefin Market 2018-2019 (US$)
Figure 4 End User Profile for Latin America Polyolefin Market 2018-2019 (US$)
Figure 5 Patent Application and Grant in Latin America Polyolefin Market 2013-2018* (US$)
Figure 6 Top 5 Companies Financial Analysis in Latin America Polyolefin Market 2018-2019 (US$)
Figure 7 Market Entry Strategy in Latin America Polyolefin Market 2018-2019
Figure 8 Ecosystem Analysis in Latin America Polyolefin Market 2018
Figure 9 Average Selling Price in Latin America Polyolefin Market 2021-2026
Figure 10 Top Opportunites in Latin America Polyolefin Market 2018-2019
Figure 11 Market Life Cycle Analysis in Latin America Polyolefin Market
Figure 12 GlobalBy TypeLatin America Polyolefin Market Revenue, 2021-2026 ($)
Figure 13 GlobalBy ProcessLatin America Polyolefin Market Revenue, 2021-2026 ($)
Figure 14 GlobalBy ApplicationLatin America Polyolefin Market Revenue, 2021-2026 ($)
Figure 15 Global Latin America Polyolefin Market - By Geography
Figure 16 Global Latin America Polyolefin Market Value & Volume, By Geography, 2021-2026 ($)
Figure 17 Global Latin America Polyolefin Market CAGR, By Geography, 2021-2026 (%)
Figure 18 North America Latin America Polyolefin Market Value & Volume, 2021-2026 ($)
Figure 19 US Latin America Polyolefin Market Value & Volume, 2021-2026 ($)
Figure 20 US GDP and Population, 2018-2019 ($)
Figure 21 US GDP – Composition of 2018, By Sector of Origin
Figure 22 US Export and Import Value & Volume, 2018-2019 ($)
Figure 23 Canada Latin America Polyolefin Market Value & Volume, 2021-2026 ($)
Figure 24 Canada GDP and Population, 2018-2019 ($)
Figure 25 Canada GDP – Composition of 2018, By Sector of Origin
Figure 26 Canada Export and Import Value & Volume, 2018-2019 ($)
Figure 27 Mexico Latin America Polyolefin Market Value & Volume, 2021-2026 ($)
Figure 28 Mexico GDP and Population, 2018-2019 ($)
Figure 29 Mexico GDP – Composition of 2018, By Sector of Origin
Figure 30 Mexico Export and Import Value & Volume, 2018-2019 ($)
Figure 31 South America Latin America Polyolefin Market South America 3D Printing Market Value & Volume, 2021-2026 ($)
Figure 32 Brazil Latin America Polyolefin Market Value & Volume, 2021-2026 ($)
Figure 33 Brazil GDP and Population, 2018-2019 ($)
Figure 34 Brazil GDP – Composition of 2018, By Sector of Origin
Figure 35 Brazil Export and Import Value & Volume, 2018-2019 ($)
Figure 36 Venezuela Latin America Polyolefin Market Value & Volume, 2021-2026 ($)
Figure 37 Venezuela GDP and Population, 2018-2019 ($)
Figure 38 Venezuela GDP – Composition of 2018, By Sector of Origin
Figure 39 Venezuela Export and Import Value & Volume, 2018-2019 ($)
Figure 40 Argentina Latin America Polyolefin Market Value & Volume, 2021-2026 ($)
Figure 41 Argentina GDP and Population, 2018-2019 ($)
Figure 42 Argentina GDP – Composition of 2018, By Sector of Origin
Figure 43 Argentina Export and Import Value & Volume, 2018-2019 ($)
Figure 44 Ecuador Latin America Polyolefin Market Value & Volume, 2021-2026 ($)
Figure 45 Ecuador GDP and Population, 2018-2019 ($)
Figure 46 Ecuador GDP – Composition of 2018, By Sector of Origin
Figure 47 Ecuador Export and Import Value & Volume, 2018-2019 ($)
Figure 48 Peru Latin America Polyolefin Market Value & Volume, 2021-2026 ($)
Figure 49 Peru GDP and Population, 2018-2019 ($)
Figure 50 Peru GDP – Composition of 2018, By Sector of Origin
Figure 51 Peru Export and Import Value & Volume, 2018-2019 ($)
Figure 52 Colombia Latin America Polyolefin Market Value & Volume, 2021-2026 ($)
Figure 53 Colombia GDP and Population, 2018-2019 ($)
Figure 54 Colombia GDP – Composition of 2018, By Sector of Origin
Figure 55 Colombia Export and Import Value & Volume, 2018-2019 ($)
Figure 56 Costa Rica Latin America Polyolefin Market Costa Rica 3D Printing Market Value & Volume, 2021-2026 ($)
Figure 57 Costa Rica GDP and Population, 2018-2019 ($)
Figure 58 Costa Rica GDP – Composition of 2018, By Sector of Origin
Figure 59 Costa Rica Export and Import Value & Volume, 2018-2019 ($)
Figure 60 Europe Latin America Polyolefin Market Value & Volume, 2021-2026 ($)
Figure 61 U.K Latin America Polyolefin Market Value & Volume, 2021-2026 ($)
Figure 62 U.K GDP and Population, 2018-2019 ($)
Figure 63 U.K GDP – Composition of 2018, By Sector of Origin
Figure 64 U.K Export and Import Value & Volume, 2018-2019 ($)
Figure 65 Germany Latin America Polyolefin Market Value & Volume, 2021-2026 ($)
Figure 66 Germany GDP and Population, 2018-2019 ($)
Figure 67 Germany GDP – Composition of 2018, By Sector of Origin
Figure 68 Germany Export and Import Value & Volume, 2018-2019 ($)
Figure 69 Italy Latin America Polyolefin Market Value & Volume, 2021-2026 ($)
Figure 70 Italy GDP and Population, 2018-2019 ($)
Figure 71 Italy GDP – Composition of 2018, By Sector of Origin
Figure 72 Italy Export and Import Value & Volume, 2018-2019 ($)
Figure 73 France Latin America Polyolefin Market Value & Volume, 2021-2026 ($)
Figure 74 France GDP and Population, 2018-2019 ($)
Figure 75 France GDP – Composition of 2018, By Sector of Origin
Figure 76 France Export and Import Value & Volume, 2018-2019 ($)
Figure 77 Netherlands Latin America Polyolefin Market Value & Volume, 2021-2026 ($)
Figure 78 Netherlands GDP and Population, 2018-2019 ($)
Figure 79 Netherlands GDP – Composition of 2018, By Sector of Origin
Figure 80 Netherlands Export and Import Value & Volume, 2018-2019 ($)
Figure 81 Belgium Latin America Polyolefin Market Value & Volume, 2021-2026 ($)
Figure 82 Belgium GDP and Population, 2018-2019 ($)
Figure 83 Belgium GDP – Composition of 2018, By Sector of Origin
Figure 84 Belgium Export and Import Value & Volume, 2018-2019 ($)
Figure 85 Spain Latin America Polyolefin Market Value & Volume, 2021-2026 ($)
Figure 86 Spain GDP and Population, 2018-2019 ($)
Figure 87 Spain GDP – Composition of 2018, By Sector of Origin
Figure 88 Spain Export and Import Value & Volume, 2018-2019 ($)
Figure 89 Denmark Latin America Polyolefin Market Value & Volume, 2021-2026 ($)
Figure 90 Denmark GDP and Population, 2018-2019 ($)
Figure 91 Denmark GDP – Composition of 2018, By Sector of Origin
Figure 92 Denmark Export and Import Value & Volume, 2018-2019 ($)
Figure 93 APAC Latin America Polyolefin Market Value & Volume, 2021-2026 ($)
Figure 94 China Latin America Polyolefin Market Value & Volume, 2021-2026
Figure 95 China GDP and Population, 2018-2019 ($)
Figure 96 China GDP – Composition of 2018, By Sector of Origin
Figure 97 China Export and Import Value & Volume, 2018-2019 ($)Latin America Polyolefin Market China Export and Import Value & Volume, 2018-2019 ($)
Figure 98 Australia Latin America Polyolefin Market Value & Volume, 2021-2026 ($)
Figure 99 Australia GDP and Population, 2018-2019 ($)
Figure 100 Australia GDP – Composition of 2018, By Sector of Origin
Figure 101 Australia Export and Import Value & Volume, 2018-2019 ($)
Figure 102 South Korea Latin America Polyolefin Market Value & Volume, 2021-2026 ($)
Figure 103 South Korea GDP and Population, 2018-2019 ($)
Figure 104 South Korea GDP – Composition of 2018, By Sector of Origin
Figure 105 South Korea Export and Import Value & Volume, 2018-2019 ($)
Figure 106 India Latin America Polyolefin Market Value & Volume, 2021-2026 ($)
Figure 107 India GDP and Population, 2018-2019 ($)
Figure 108 India GDP – Composition of 2018, By Sector of Origin
Figure 109 India Export and Import Value & Volume, 2018-2019 ($)
Figure 110 Taiwan Latin America Polyolefin Market Taiwan 3D Printing Market Value & Volume, 2021-2026 ($)
Figure 111 Taiwan GDP and Population, 2018-2019 ($)
Figure 112 Taiwan GDP – Composition of 2018, By Sector of Origin
Figure 113 Taiwan Export and Import Value & Volume, 2018-2019 ($)
Figure 114 Malaysia Latin America Polyolefin Market Malaysia 3D Printing Market Value & Volume, 2021-2026 ($)
Figure 115 Malaysia GDP and Population, 2018-2019 ($)
Figure 116 Malaysia GDP – Composition of 2018, By Sector of Origin
Figure 117 Malaysia Export and Import Value & Volume, 2018-2019 ($)
Figure 118 Hong Kong Latin America Polyolefin Market Hong Kong 3D Printing Market Value & Volume, 2021-2026 ($)
Figure 119 Hong Kong GDP and Population, 2018-2019 ($)
Figure 120 Hong Kong GDP – Composition of 2018, By Sector of Origin
Figure 121 Hong Kong Export and Import Value & Volume, 2018-2019 ($)
Figure 122 Middle East & Africa Latin America Polyolefin Market Middle East & Africa 3D Printing Market Value & Volume, 2021-2026 ($)
Figure 123 Russia Latin America Polyolefin Market Russia 3D Printing Market Value & Volume, 2021-2026 ($)
Figure 124 Russia GDP and Population, 2018-2019 ($)
Figure 125 Russia GDP – Composition of 2018, By Sector of Origin
Figure 126 Russia Export and Import Value & Volume, 2018-2019 ($)
Figure 127 Israel Latin America Polyolefin Market Value & Volume, 2021-2026 ($)
Figure 128 Israel GDP and Population, 2018-2019 ($)
Figure 129 Israel GDP – Composition of 2018, By Sector of Origin
Figure 130 Israel Export and Import Value & Volume, 2018-2019 ($)
Figure 131 Entropy Share, By Strategies, 2018-2019* (%)Latin America Polyolefin Market
Figure 132 Developments, 2018-2019*Latin America Polyolefin Market
Figure 133 Company 1 Latin America Polyolefin Market Net Revenue, By Years, 2018-2019* ($)
Figure 134 Company 1 Latin America Polyolefin Market Net Revenue Share, By Business segments, 2018 (%)
Figure 135 Company 1 Latin America Polyolefin Market Net Sales Share, By Geography, 2018 (%)
Figure 136 Company 2 Latin America Polyolefin Market Net Revenue, By Years, 2018-2019* ($)
Figure 137 Company 2 Latin America Polyolefin Market Net Revenue Share, By Business segments, 2018 (%)
Figure 138 Company 2 Latin America Polyolefin Market Net Sales Share, By Geography, 2018 (%)
Figure 139 Company 3Latin America Polyolefin Market Net Revenue, By Years, 2018-2019* ($)
Figure 140 Company 3Latin America Polyolefin Market Net Revenue Share, By Business segments, 2018 (%)
Figure 141 Company 3Latin America Polyolefin Market Net Sales Share, By Geography, 2018 (%)
Figure 142 Company 4 Latin America Polyolefin Market Net Revenue, By Years, 2018-2019* ($)
Figure 143 Company 4 Latin America Polyolefin Market Net Revenue Share, By Business segments, 2018 (%)
Figure 144 Company 4 Latin America Polyolefin Market Net Sales Share, By Geography, 2018 (%)
Figure 145 Company 5 Latin America Polyolefin Market Net Revenue, By Years, 2018-2019* ($)
Figure 146 Company 5 Latin America Polyolefin Market Net Revenue Share, By Business segments, 2018 (%)
Figure 147 Company 5 Latin America Polyolefin Market Net Sales Share, By Geography, 2018 (%)
Figure 148 Company 6 Latin America Polyolefin Market Net Revenue, By Years, 2018-2019* ($)
Figure 149 Company 6 Latin America Polyolefin Market Net Revenue Share, By Business segments, 2018 (%)
Figure 150 Company 6 Latin America Polyolefin Market Net Sales Share, By Geography, 2018 (%)
Figure 151 Company 7 Latin America Polyolefin Market Net Revenue, By Years, 2018-2019* ($)
Figure 152 Company 7 Latin America Polyolefin Market Net Revenue Share, By Business segments, 2018 (%)
Figure 153 Company 7 Latin America Polyolefin Market Net Sales Share, By Geography, 2018 (%)
Figure 154 Company 8 Latin America Polyolefin Market Net Revenue, By Years, 2018-2019* ($)
Figure 155 Company 8 Latin America Polyolefin Market Net Revenue Share, By Business segments, 2018 (%)
Figure 156 Company 8 Latin America Polyolefin Market Net Sales Share, By Geography, 2018 (%)
Figure 157 Company 9 Latin America Polyolefin Market Net Revenue, By Years, 2018-2019* ($)
Figure 158 Company 9 Latin America Polyolefin Market Net Revenue Share, By Business segments, 2018 (%)
Figure 159 Company 9 Latin America Polyolefin Market Net Sales Share, By Geography, 2018 (%)
Figure 160 Company 10 Latin America Polyolefin Market Net Revenue, By Years, 2018-2019* ($)
Figure 161 Company 10 Latin America Polyolefin Market Net Revenue Share, By Business segments, 2018 (%)
Figure 162 Company 10 Latin America Polyolefin Market Net Sales Share, By Geography, 2018 (%)
Figure 163 Company 11 Latin America Polyolefin Market Net Revenue, By Years, 2018-2019* ($)
Figure 164 Company 11 Latin America Polyolefin Market Net Revenue Share, By Business segments, 2018 (%)
Figure 165 Company 11 Latin America Polyolefin Market Net Sales Share, By Geography, 2018 (%)
Figure 166 Company 12 Latin America Polyolefin Market Net Revenue, By Years, 2018-2019* ($)
Figure 167 Company 12 Latin America Polyolefin Market Net Revenue Share, By Business segments, 2018 (%)
Figure 168 Company 12 Latin America Polyolefin Market Net Sales Share, By Geography, 2018 (%)
Figure 169 Company 13Latin America Polyolefin Market Net Revenue, By Years, 2018-2019* ($)
Figure 170 Company 13Latin America Polyolefin Market Net Revenue Share, By Business segments, 2018 (%)
Figure 171 Company 13Latin America Polyolefin Market Net Sales Share, By Geography, 2018 (%)
Figure 172 Company 14 Latin America Polyolefin Market Net Revenue, By Years, 2018-2019* ($)
Figure 173 Company 14 Latin America Polyolefin Market Net Revenue Share, By Business segments, 2018 (%)
Figure 174 Company 14 Latin America Polyolefin Market Net Sales Share, By Geography, 2018 (%)
Figure 175 Company 15 Latin America Polyolefin Market Net Revenue, By Years, 2018-2019* ($)
Figure 176 Company 15 Latin America Polyolefin Market Net Revenue Share, By Business segments, 2018 (%)
Figure 177 Company 15 Latin America Polyolefin Market Net Sales Share, By Geography, 2018 (%)