 Email
Email Print
Print


Playout Automation And Channel-In-A-Box Market - Forecast(2024 - 2030)
Channel-in-a-Box enable playout automation that offers ingesting video, producing the content by inserting logos, overlays and advertisements and then playing it before broadcasting to audiences on a set schedule which also gives advertising billing to generate revenue for the broadcaster. Channel-in-a-box refers to everything in one box. These consists of: input interfaces to ingest video, the real-time video processing to implement digital video effects, storage interfaces to get the related content, the output interfaces to playout the final produced video and handle all the billing and business operations. Playout automation is the technology that produces content by inserting logos, ingesting video, advertisement, and overlay before broadcasting it to the audiences. The market growth is driven by its latest advancement in the technology providing benefits to the producers and engineers with powerful and compact outboard by combining the sonic quality and features. This is becoming more competitive which are the major boundaries in the growth of the market. But integration is in use now a days and it’s easy to decide the future of channel in-a-box.
The global playout automation & channel-in-a-box market is projected to grow from $ XX m in 2016 to $XXm by 2021, at a CAGR of XX % from 2016 to 2021 with the demand for entertainment and cartoon segments. Increased need for better-quality channel presentation, ease of procedures, and rapid entry of small and medium-sized business in the broadcasting industry are driving the growth for global playout automation and channel-in-a-box market.
Playout automation & channel-in-a-box market is segmented by type of channel as single and multiple, by component as servers, logo inserter character generators and others, operations include broadcasting, video and image processing, graphics and other operations. By end-user include international broadcasting and national broadcasting. By application into news, sports, entertainment, cartoon, life style, others. Entertainment and lifestyle segment is forecasted to hold the major share during the forecast period.
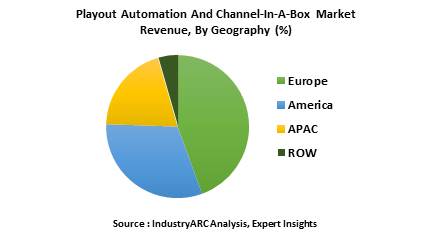
Europe dominates the global playout and channel-in-a-Box market with advancement in playout solutions. However, during the forecast period, vast development in Asia Pacific and Middle East and Africa (MEA) will help the global playout automation and channel-in-a-box market to gain fastest growth.
Sample Companies profiled in this Report are:
The global playout automation & channel-in-a-box market is projected to grow from $ XX m in 2016 to $XXm by 2021, at a CAGR of XX % from 2016 to 2021 with the demand for entertainment and cartoon segments. Increased need for better-quality channel presentation, ease of procedures, and rapid entry of small and medium-sized business in the broadcasting industry are driving the growth for global playout automation and channel-in-a-box market.
Playout automation & channel-in-a-box market is segmented by type of channel as single and multiple, by component as servers, logo inserter character generators and others, operations include broadcasting, video and image processing, graphics and other operations. By end-user include international broadcasting and national broadcasting. By application into news, sports, entertainment, cartoon, life style, others. Entertainment and lifestyle segment is forecasted to hold the major share during the forecast period.
Europe dominates the global playout and channel-in-a-Box market with advancement in playout solutions. However, during the forecast period, vast development in Asia Pacific and Middle East and Africa (MEA) will help the global playout automation and channel-in-a-box market to gain fastest growth.
Sample Companies profiled in this Report are:
- Harmonic Inc.
- Snell Limited
- Pebble Beach Systems
- 10+.
1. Market Overview
2. Executive Summary
3. Playout Automation And Channel-In-A-Box Market Landscape
3.1. Market Share Analysis
3.2. Comparative Analysis
3.2.1. Product Benchmarking
3.2.2. End User Profiling
3.2.3. Top 5 Financials Analysis
4. Playout Automation And Channel-In-A-Box Market Forces
4.1. Market Drivers
4.2. Market Constraints & Challenges
4.3. Attractiveness Of Playout Automation And Channel-In-A-Box Market
4.3.1. Power of Suppliers
4.3.2. Threats From New Entrants
4.3.3. Power of Buyer
4.3.4. Threat From Substitute Product
4.3.5. Degree of Competition
5. Playout Automation And Channel-In-A-Box Market-Strategic Analysis
5.1. Playout Automation And Channel-In-A-Box Market - Value Chain Analysis
5.2. Pricing Analysis
5.3. Opportunity Analysis
5.4. Broadcasting Analysis
5.5. Product Life Cycle
5.6. Suppliers And Distributors
6. Playout Automation And Channel-In-A-Box Market-By Channel Type
6.1. Introduction
6.2. Single Channel
6.3. Multiple Channel
6.4. Others
7. Playout Automation And Channel-In-A-Box Market-By Components
7.1. Introduction
7.2. Playout Automation
7.3. Servers
7.4. Character Generators
7.5. Logo Inserters
7.6. Channel-In-A-Box
7.7. Servers
7.8. Others
8. Playout Automation And Channel-In-A-Box Market-By End-User
8.1. Introduction
8.2. National Broadcasting
8.3. Regional Broadcasting
9. Playout Automation And Channel-In-A-Box Market-By Operation
9.1. Broadcasting
9.2. Video and Image processing
9.3. Graphics
9.4. Others
10. Playout Automation And Channel-In-A-Box Market-By Channel Application
10.1. News
10.2. Sports
10.3. Entertainment
10.4. Cartoon
10.5. Life style
10.6. Others
11. Playout Automation And Channel-In-A-Box Market-By Geography
11.1. Americas
11.1.1. U.S.
11.1.2. Canada
11.1.3. Mexico
11.1.4. Others
11.2. Europe
11.2.1. U.K.
11.2.2. Germany
11.2.3. Italy
11.2.4. Others
11.3. Asia- Pacific
11.3.1. China
11.3.2. South Korea
11.3.3. Japan
11.3.4. India
11.3.5. Others
11.4. RoW
11.4.1. MEA
12. Playout Automation And Channel-In-A-Box Market Entropy
12.1. New Product Developments
12.2. Product launches, JVs, Mergers and Acquisitions
13. Company Profiles
13.1. Cinegy Llc
13.2. Florical Systems Pvt.Ltd
13.3. Harmonic, Inc.
13.4. Evertz Microsystems, Ltd
13.5. Imagine Communications Corp.
13.6. Pebble Beach Systems Pvt.Ltd
13.7. Pixel Power Ltd.
13.8. Playbox Technology Pvt.Ltd
13.9. Snell Limited
13.10. Grass Valley Usa Llc
13.11. Anyware Video Corp
13.12. Athensa Corp
13.13. Aveco S.R.O
13.14. Axel Technology Pvt.Ltd
13.15. Broadstream Solutions Pvt.Ltd.
13.16. Dayang Technology Devolopment Inc
13.17. Hardata Ltd.
13.18. Leightronix Ltd.
13.19. Orad Communications ltd.
*More than 10 Companies are profiled in this Research Report*
"*Financials would be provided on a best efforts basis for private companies"
14. Appendix
14.1. Abbreviations
14.2. Sources
14.3. Research Methodology
14.4. Bibliography
14.5. Compilation of Expert Insights
List of Tables
Table 1: Playout Automation And Channel-In-A-Box Market Overview 2021-2026
Table 2: Playout Automation And Channel-In-A-Box Market Leader Analysis 2018-2019 (US$)
Table 3: Playout Automation And Channel-In-A-Box Market Product Analysis 2018-2019 (US$)
Table 4: Playout Automation And Channel-In-A-Box Market End User Analysis 2018-2019 (US$)
Table 5: Playout Automation And Channel-In-A-Box Market Patent Analysis 2013-2018* (US$)
Table 6: Playout Automation And Channel-In-A-Box Market Financial Analysis 2018-2019 (US$)
Table 7: Playout Automation And Channel-In-A-Box Market Driver Analysis 2018-2019 (US$)
Table 8: Playout Automation And Channel-In-A-Box Market Challenges Analysis 2018-2019 (US$)
Table 9: Playout Automation And Channel-In-A-Box Market Constraint Analysis 2018-2019 (US$)
Table 10: Playout Automation And Channel-In-A-Box Market Supplier Bargaining Power Analysis 2018-2019 (US$)
Table 11: Playout Automation And Channel-In-A-Box Market Buyer Bargaining Power Analysis 2018-2019 (US$)
Table 12: Playout Automation And Channel-In-A-Box Market Threat of Substitutes Analysis 2018-2019 (US$)
Table 13: Playout Automation And Channel-In-A-Box Market Threat of New Entrants Analysis 2018-2019 (US$)
Table 14: Playout Automation And Channel-In-A-Box Market Degree of Competition Analysis 2018-2019 (US$)
Table 15: Playout Automation And Channel-In-A-Box Market Value Chain Analysis 2018-2019 (US$)
Table 16: Playout Automation And Channel-In-A-Box Market Pricing Analysis 2021-2026 (US$)
Table 17: Playout Automation And Channel-In-A-Box Market Opportunities Analysis 2021-2026 (US$)
Table 18: Playout Automation And Channel-In-A-Box Market Product Life Cycle Analysis 2021-2026 (US$)
Table 19: Playout Automation And Channel-In-A-Box Market Supplier Analysis 2018-2019 (US$)
Table 20: Playout Automation And Channel-In-A-Box Market Distributor Analysis 2018-2019 (US$)
Table 21: Playout Automation And Channel-In-A-Box Market Trend Analysis 2018-2019 (US$)
Table 22: Playout Automation And Channel-In-A-Box Market Size 2018 (US$)
Table 23: Playout Automation And Channel-In-A-Box Market Forecast Analysis 2021-2026 (US$)
Table 24: Playout Automation And Channel-In-A-Box Market Sales Forecast Analysis 2021-2026 (Units)
Table 25: Playout Automation And Channel-In-A-Box Market, Revenue & Volume, By Channel Type, 2021-2026 ($)
Table 26: Playout Automation And Channel-In-A-Box Market By Channel Type, Revenue & Volume, By Single Channel, 2021-2026 ($)
Table 27: Playout Automation And Channel-In-A-Box Market By Channel Type, Revenue & Volume, By Multiple Channel, 2021-2026 ($)
Table 28: Playout Automation And Channel-In-A-Box Market, Revenue & Volume, By Components, 2021-2026 ($)
Table 29: Playout Automation And Channel-In-A-Box Market By Components, Revenue & Volume, By Playout Automation, 2021-2026 ($)
Table 30: Playout Automation And Channel-In-A-Box Market By Components, Revenue & Volume, By Servers, 2021-2026 ($)
Table 31: Playout Automation And Channel-In-A-Box Market By Components, Revenue & Volume, By Character Generators, 2021-2026 ($)
Table 32: Playout Automation And Channel-In-A-Box Market By Components, Revenue & Volume, By Logo Inserters, 2021-2026 ($)
Table 33: Playout Automation And Channel-In-A-Box Market By Components, Revenue & Volume, By Channel-In-A-Box, 2021-2026 ($)
Table 34: Playout Automation And Channel-In-A-Box Market, Revenue & Volume, By Operation, 2021-2026 ($)
Table 35: Playout Automation And Channel-In-A-Box Market By Operation, Revenue & Volume, By Broadcasting, 2021-2026 ($)
Table 36: Playout Automation And Channel-In-A-Box Market By Operation, Revenue & Volume, By Video and Image processing, 2021-2026 ($)
Table 37: Playout Automation And Channel-In-A-Box Market By Operation, Revenue & Volume, By Graphics, 2021-2026 ($)
Table 38: Playout Automation And Channel-In-A-Box Market, Revenue & Volume, By Channel Application, 2021-2026 ($)
Table 39: Playout Automation And Channel-In-A-Box Market By Channel Application, Revenue & Volume, By News, 2021-2026 ($)
Table 40: Playout Automation And Channel-In-A-Box Market By Channel Application, Revenue & Volume, By Sports, 2021-2026 ($)
Table 41: Playout Automation And Channel-In-A-Box Market By Channel Application, Revenue & Volume, By Entertainment, 2021-2026 ($)
Table 42: Playout Automation And Channel-In-A-Box Market By Channel Application, Revenue & Volume, By Cartoon, 2021-2026 ($)
Table 43: Playout Automation And Channel-In-A-Box Market By Channel Application, Revenue & Volume, By Life style, 2021-2026 ($)
Table 44: Playout Automation And Channel-In-A-Box Market, Revenue & Volume, By End User, 2021-2026 ($)
Table 45: Playout Automation And Channel-In-A-Box Market By End User, Revenue & Volume, By National Broadcasting, 2021-2026 ($)
Table 46: Playout Automation And Channel-In-A-Box Market By End User, Revenue & Volume, By Regional Broadcasting, 2021-2026 ($)
Table 47: North America Playout Automation And Channel-In-A-Box Market, Revenue & Volume, By Channel Type, 2021-2026 ($)
Table 48: North America Playout Automation And Channel-In-A-Box Market, Revenue & Volume, By Components, 2021-2026 ($)
Table 49: North America Playout Automation And Channel-In-A-Box Market, Revenue & Volume, By Operation, 2021-2026 ($)
Table 50: North America Playout Automation And Channel-In-A-Box Market, Revenue & Volume, By Channel Application, 2021-2026 ($)
Table 51: North America Playout Automation And Channel-In-A-Box Market, Revenue & Volume, By End User, 2021-2026 ($)
Table 52: South america Playout Automation And Channel-In-A-Box Market, Revenue & Volume, By Channel Type, 2021-2026 ($)
Table 53: South america Playout Automation And Channel-In-A-Box Market, Revenue & Volume, By Components, 2021-2026 ($)
Table 54: South america Playout Automation And Channel-In-A-Box Market, Revenue & Volume, By Operation, 2021-2026 ($)
Table 55: South america Playout Automation And Channel-In-A-Box Market, Revenue & Volume, By Channel Application, 2021-2026 ($)
Table 56: South america Playout Automation And Channel-In-A-Box Market, Revenue & Volume, By End User, 2021-2026 ($)
Table 57: Europe Playout Automation And Channel-In-A-Box Market, Revenue & Volume, By Channel Type, 2021-2026 ($)
Table 58: Europe Playout Automation And Channel-In-A-Box Market, Revenue & Volume, By Components, 2021-2026 ($)
Table 59: Europe Playout Automation And Channel-In-A-Box Market, Revenue & Volume, By Operation, 2021-2026 ($)
Table 60: Europe Playout Automation And Channel-In-A-Box Market, Revenue & Volume, By Channel Application, 2021-2026 ($)
Table 61: Europe Playout Automation And Channel-In-A-Box Market, Revenue & Volume, By End User, 2021-2026 ($)
Table 62: APAC Playout Automation And Channel-In-A-Box Market, Revenue & Volume, By Channel Type, 2021-2026 ($)
Table 63: APAC Playout Automation And Channel-In-A-Box Market, Revenue & Volume, By Components, 2021-2026 ($)
Table 64: APAC Playout Automation And Channel-In-A-Box Market, Revenue & Volume, By Operation, 2021-2026 ($)
Table 65: APAC Playout Automation And Channel-In-A-Box Market, Revenue & Volume, By Channel Application, 2021-2026 ($)
Table 66: APAC Playout Automation And Channel-In-A-Box Market, Revenue & Volume, By End User, 2021-2026 ($)
Table 67: Middle East & Africa Playout Automation And Channel-In-A-Box Market, Revenue & Volume, By Channel Type, 2021-2026 ($)
Table 68: Middle East & Africa Playout Automation And Channel-In-A-Box Market, Revenue & Volume, By Components, 2021-2026 ($)
Table 69: Middle East & Africa Playout Automation And Channel-In-A-Box Market, Revenue & Volume, By Operation, 2021-2026 ($)
Table 70: Middle East & Africa Playout Automation And Channel-In-A-Box Market, Revenue & Volume, By Channel Application, 2021-2026 ($)
Table 71: Middle East & Africa Playout Automation And Channel-In-A-Box Market, Revenue & Volume, By End User, 2021-2026 ($)
Table 72: Russia Playout Automation And Channel-In-A-Box Market, Revenue & Volume, By Channel Type, 2021-2026 ($)
Table 73: Russia Playout Automation And Channel-In-A-Box Market, Revenue & Volume, By Components, 2021-2026 ($)
Table 74: Russia Playout Automation And Channel-In-A-Box Market, Revenue & Volume, By Operation, 2021-2026 ($)
Table 75: Russia Playout Automation And Channel-In-A-Box Market, Revenue & Volume, By Channel Application, 2021-2026 ($)
Table 76: Russia Playout Automation And Channel-In-A-Box Market, Revenue & Volume, By End User, 2021-2026 ($)
Table 77: Israel Playout Automation And Channel-In-A-Box Market, Revenue & Volume, By Channel Type, 2021-2026 ($)
Table 78: Israel Playout Automation And Channel-In-A-Box Market, Revenue & Volume, By Components, 2021-2026 ($)
Table 79: Israel Playout Automation And Channel-In-A-Box Market, Revenue & Volume, By Operation, 2021-2026 ($)
Table 80: Israel Playout Automation And Channel-In-A-Box Market, Revenue & Volume, By Channel Application, 2021-2026 ($)
Table 81: Israel Playout Automation And Channel-In-A-Box Market, Revenue & Volume, By End User, 2021-2026 ($)
Table 82: Top Companies 2018 (US$)Playout Automation And Channel-In-A-Box Market, Revenue & Volume
Table 83: Product Launch 2018-2019Playout Automation And Channel-In-A-Box Market, Revenue & Volume
Table 84: Mergers & Acquistions 2018-2019Playout Automation And Channel-In-A-Box Market, Revenue & Volume
List of Figures
Figure 1: Overview of Playout Automation And Channel-In-A-Box Market 2021-2026
Figure 2: Market Share Analysis for Playout Automation And Channel-In-A-Box Market 2018 (US$)
Figure 3: Product Comparison in Playout Automation And Channel-In-A-Box Market 2018-2019 (US$)
Figure 4: End User Profile for Playout Automation And Channel-In-A-Box Market 2018-2019 (US$)
Figure 5: Patent Application and Grant in Playout Automation And Channel-In-A-Box Market 2013-2018* (US$)
Figure 6: Top 5 Companies Financial Analysis in Playout Automation And Channel-In-A-Box Market 2018-2019 (US$)
Figure 7: Market Entry Strategy in Playout Automation And Channel-In-A-Box Market 2018-2019
Figure 8: Ecosystem Analysis in Playout Automation And Channel-In-A-Box Market 2018
Figure 9: Average Selling Price in Playout Automation And Channel-In-A-Box Market 2021-2026
Figure 10: Top Opportunites in Playout Automation And Channel-In-A-Box Market 2018-2019
Figure 11: Market Life Cycle Analysis in Playout Automation And Channel-In-A-Box Market
Figure 12: GlobalBy Channel TypePlayout Automation And Channel-In-A-Box Market Revenue, 2021-2026 ($)
Figure 13: GlobalBy ComponentsPlayout Automation And Channel-In-A-Box Market Revenue, 2021-2026 ($)
Figure 14: GlobalBy OperationPlayout Automation And Channel-In-A-Box Market Revenue, 2021-2026 ($)
Figure 15: GlobalBy Channel ApplicationPlayout Automation And Channel-In-A-Box Market Revenue, 2021-2026 ($)
Figure 16: GlobalBy End UserPlayout Automation And Channel-In-A-Box Market Revenue, 2021-2026 ($)
Figure 17: Global Playout Automation And Channel-In-A-Box Market - By Geography
Figure 18: Global Playout Automation And Channel-In-A-Box Market Value & Volume, By Geography, 2021-2026 ($)
Figure 19: Global Playout Automation And Channel-In-A-Box Market CAGR, By Geography, 2021-2026 (%)
Figure 20: North America Playout Automation And Channel-In-A-Box Market Value & Volume, 2021-2026 ($)
Figure 21: US Playout Automation And Channel-In-A-Box Market Value & Volume, 2021-2026 ($)
Figure 22: US GDP and Population, 2018-2019 ($)
Figure 23: US GDP – Composition of 2018, By Sector of Origin
Figure 24: US Export and Import Value & Volume, 2018-2019 ($)
Figure 25: Canada Playout Automation And Channel-In-A-Box Market Value & Volume, 2021-2026 ($)
Figure 26: Canada GDP and Population, 2018-2019 ($)
Figure 27: Canada GDP – Composition of 2018, By Sector of Origin
Figure 28: Canada Export and Import Value & Volume, 2018-2019 ($)
Figure 29: Mexico Playout Automation And Channel-In-A-Box Market Value & Volume, 2021-2026 ($)
Figure 30: Mexico GDP and Population, 2018-2019 ($)
Figure 31: Mexico GDP – Composition of 2018, By Sector of Origin
Figure 32: Mexico Export and Import Value & Volume, 2018-2019 ($)
Figure 33: South America Playout Automation And Channel-In-A-Box Market Value & Volume, 2021-2026 ($)
Figure 34: Brazil Playout Automation And Channel-In-A-Box Market Value & Volume, 2021-2026 ($)
Figure 35: Brazil GDP and Population, 2018-2019 ($)
Figure 36: Brazil GDP – Composition of 2018, By Sector of Origin
Figure 37: Brazil Export and Import Value & Volume, 2018-2019 ($)
Figure 38: Venezuela Playout Automation And Channel-In-A-Box Market Value & Volume, 2021-2026 ($)
Figure 39: Venezuela GDP and Population, 2018-2019 ($)
Figure 40: Venezuela GDP – Composition of 2018, By Sector of Origin
Figure 41: Venezuela Export and Import Value & Volume, 2018-2019 ($)
Figure 42: Argentina Playout Automation And Channel-In-A-Box Market Value & Volume, 2021-2026 ($)
Figure 43: Argentina GDP and Population, 2018-2019 ($)
Figure 44: Argentina GDP – Composition of 2018, By Sector of Origin
Figure 45: Argentina Export and Import Value & Volume, 2018-2019 ($)
Figure 46: Ecuador Playout Automation And Channel-In-A-Box Market Value & Volume, 2021-2026 ($)
Figure 47: Ecuador GDP and Population, 2018-2019 ($)
Figure 48: Ecuador GDP – Composition of 2018, By Sector of Origin
Figure 49: Ecuador Export and Import Value & Volume, 2018-2019 ($)
Figure 50: Peru Playout Automation And Channel-In-A-Box Market Value & Volume, 2021-2026 ($)
Figure 51: Peru GDP and Population, 2018-2019 ($)
Figure 52: Peru GDP – Composition of 2018, By Sector of Origin
Figure 53: Peru Export and Import Value & Volume, 2018-2019 ($)
Figure 54: Colombia Playout Automation And Channel-In-A-Box Market Value & Volume, 2021-2026 ($)
Figure 55: Colombia GDP and Population, 2018-2019 ($)
Figure 56: Colombia GDP – Composition of 2018, By Sector of Origin
Figure 57: Colombia Export and Import Value & Volume, 2018-2019 ($)
Figure 58: Costa Rica Playout Automation And Channel-In-A-Box Market Value & Volume, 2021-2026 ($)
Figure 59: Costa Rica GDP and Population, 2018-2019 ($)
Figure 60: Costa Rica GDP – Composition of 2018, By Sector of Origin
Figure 61: Costa Rica Export and Import Value & Volume, 2018-2019 ($)
Figure 62: Europe Playout Automation And Channel-In-A-Box Market Value & Volume, 2021-2026 ($)
Figure 63: U.K Playout Automation And Channel-In-A-Box Market Value & Volume, 2021-2026 ($)
Figure 64: U.K GDP and Population, 2018-2019 ($)
Figure 65: U.K GDP – Composition of 2018, By Sector of Origin
Figure 66: U.K Export and Import Value & Volume, 2018-2019 ($)
Figure 67: Germany Playout Automation And Channel-In-A-Box Market Value & Volume, 2021-2026 ($)
Figure 68: Germany GDP and Population, 2018-2019 ($)
Figure 69: Germany GDP – Composition of 2018, By Sector of Origin
Figure 70: Germany Export and Import Value & Volume, 2018-2019 ($)
Figure 71: Italy Playout Automation And Channel-In-A-Box Market Value & Volume, 2021-2026 ($)
Figure 72: Italy GDP and Population, 2018-2019 ($)
Figure 73: Italy GDP – Composition of 2018, By Sector of Origin
Figure 74: Italy Export and Import Value & Volume, 2018-2019 ($)
Figure 75: France Playout Automation And Channel-In-A-Box Market Value & Volume, 2021-2026 ($)
Figure 76: France GDP and Population, 2018-2019 ($)
Figure 77: France GDP – Composition of 2018, By Sector of Origin
Figure 78: France Export and Import Value & Volume, 2018-2019 ($)
Figure 79: Netherlands Playout Automation And Channel-In-A-Box Market Value & Volume, 2021-2026 ($)
Figure 80: Netherlands GDP and Population, 2018-2019 ($)
Figure 81: Netherlands GDP – Composition of 2018, By Sector of Origin
Figure 82: Netherlands Export and Import Value & Volume, 2018-2019 ($)
Figure 83: Belgium Playout Automation And Channel-In-A-Box Market Value & Volume, 2021-2026 ($)
Figure 84: Belgium GDP and Population, 2018-2019 ($)
Figure 85: Belgium GDP – Composition of 2018, By Sector of Origin
Figure 86: Belgium Export and Import Value & Volume, 2018-2019 ($)
Figure 87: Spain Playout Automation And Channel-In-A-Box Market Value & Volume, 2021-2026 ($)
Figure 88: Spain GDP and Population, 2018-2019 ($)
Figure 89: Spain GDP – Composition of 2018, By Sector of Origin
Figure 90: Spain Export and Import Value & Volume, 2018-2019 ($)
Figure 91: Denmark Playout Automation And Channel-In-A-Box Market Value & Volume, 2021-2026 ($)
Figure 92: Denmark GDP and Population, 2018-2019 ($)
Figure 93: Denmark GDP – Composition of 2018, By Sector of Origin
Figure 94: Denmark Export and Import Value & Volume, 2018-2019 ($)
Figure 95: APAC Playout Automation And Channel-In-A-Box Market Value & Volume, 2021-2026 ($)
Figure 96: China Playout Automation And Channel-In-A-Box Market Value & Volume, 2021-2026
Figure 97: China GDP and Population, 2018-2019 ($)
Figure 98: China GDP – Composition of 2018, By Sector of Origin
Figure 99: China Export and Import Value & Volume, 2018-2019 ($)Playout Automation And Channel-In-A-Box Market China Export and Import Value & Volume, 2018-2019 ($)
Figure 100: Australia Playout Automation And Channel-In-A-Box Market Value & Volume, 2021-2026 ($)
Figure 101: Australia GDP and Population, 2018-2019 ($)
Figure 102: Australia GDP – Composition of 2018, By Sector of Origin
Figure 103: Australia Export and Import Value & Volume, 2018-2019 ($)
Figure 104: South Korea Playout Automation And Channel-In-A-Box Market Value & Volume, 2021-2026 ($)
Figure 105: South Korea GDP and Population, 2018-2019 ($)
Figure 106: South Korea GDP – Composition of 2018, By Sector of Origin
Figure 107: South Korea Export and Import Value & Volume, 2018-2019 ($)
Figure 108: India Playout Automation And Channel-In-A-Box Market Value & Volume, 2021-2026 ($)
Figure 109: India GDP and Population, 2018-2019 ($)
Figure 110: India GDP – Composition of 2018, By Sector of Origin
Figure 111: India Export and Import Value & Volume, 2018-2019 ($)
Figure 112: Taiwan Playout Automation And Channel-In-A-Box Market Value & Volume, 2021-2026 ($)
Figure 113: Taiwan GDP and Population, 2018-2019 ($)
Figure 114: Taiwan GDP – Composition of 2018, By Sector of Origin
Figure 115: Taiwan Export and Import Value & Volume, 2018-2019 ($)
Figure 116: Malaysia Playout Automation And Channel-In-A-Box Market Value & Volume, 2021-2026 ($)
Figure 117: Malaysia GDP and Population, 2018-2019 ($)
Figure 118: Malaysia GDP – Composition of 2018, By Sector of Origin
Figure 119: Malaysia Export and Import Value & Volume, 2018-2019 ($)
Figure 120: Hong Kong Playout Automation And Channel-In-A-Box Market Value & Volume, 2021-2026 ($)
Figure 121: Hong Kong GDP and Population, 2018-2019 ($)
Figure 122: Hong Kong GDP – Composition of 2018, By Sector of Origin
Figure 123: Hong Kong Export and Import Value & Volume, 2018-2019 ($)
Figure 124: Middle East & Africa Playout Automation And Channel-In-A-Box Market Middle East & Africa 3D Printing Market Value & Volume, 2021-2026 ($)
Figure 125: Russia Playout Automation And Channel-In-A-Box Market Value & Volume, 2021-2026 ($)
Figure 126: Russia GDP and Population, 2018-2019 ($)
Figure 127: Russia GDP – Composition of 2018, By Sector of Origin
Figure 128: Russia Export and Import Value & Volume, 2018-2019 ($)
Figure 129: Israel Playout Automation And Channel-In-A-Box Market Value & Volume, 2021-2026 ($)
Figure 130: Israel GDP and Population, 2018-2019 ($)
Figure 131: Israel GDP – Composition of 2018, By Sector of Origin
Figure 132: Israel Export and Import Value & Volume, 2018-2019 ($)
Figure 133: Entropy Share, By Strategies, 2018-2019* (%)Playout Automation And Channel-In-A-Box Market
Figure 134: Developments, 2018-2019*Playout Automation And Channel-In-A-Box Market
Figure 135: Company 1 Playout Automation And Channel-In-A-Box Market Net Revenue, By Years, 2018-2019* ($)
Figure 136: Company 1 Playout Automation And Channel-In-A-Box Market Net Revenue Share, By Business segments, 2018 (%)
Figure 137: Company 1 Playout Automation And Channel-In-A-Box Market Net Sales Share, By Geography, 2018 (%)
Figure 138: Company 2 Playout Automation And Channel-In-A-Box Market Net Revenue, By Years, 2018-2019* ($)
Figure 139: Company 2 Playout Automation And Channel-In-A-Box Market Net Revenue Share, By Business segments, 2018 (%)
Figure 140: Company 2 Playout Automation And Channel-In-A-Box Market Net Sales Share, By Geography, 2018 (%)
Figure 141: Company 3 Playout Automation And Channel-In-A-Box Market Net Revenue, By Years, 2018-2019* ($)
Figure 142: Company 3 Playout Automation And Channel-In-A-Box Market Net Revenue Share, By Business segments, 2018 (%)
Figure 143: Company 3 Playout Automation And Channel-In-A-Box Market Net Sales Share, By Geography, 2018 (%)
Figure 144: Company 4 Playout Automation And Channel-In-A-Box Market Net Revenue, By Years, 2018-2019* ($)
Figure 145: Company 4 Playout Automation And Channel-In-A-Box Market Net Revenue Share, By Business segments, 2018 (%)
Figure 146: Company 4 Playout Automation And Channel-In-A-Box Market Net Sales Share, By Geography, 2018 (%)
Figure 147: Company 5 Playout Automation And Channel-In-A-Box Market Net Revenue, By Years, 2018-2019* ($)
Figure 148: Company 5 Playout Automation And Channel-In-A-Box Market Net Revenue Share, By Business segments, 2018 (%)
Figure 149: Company 5 Playout Automation And Channel-In-A-Box Market Net Sales Share, By Geography, 2018 (%)
Figure 150: Company 6 Playout Automation And Channel-In-A-Box Market Net Revenue, By Years, 2018-2019* ($)
Figure 151: Company 6 Playout Automation And Channel-In-A-Box Market Net Revenue Share, By Business segments, 2018 (%)
Figure 152: Company 6 Playout Automation And Channel-In-A-Box Market Net Sales Share, By Geography, 2018 (%)
Figure 153: Company 7 Playout Automation And Channel-In-A-Box Market Net Revenue, By Years, 2018-2019* ($)
Figure 154: Company 7 Playout Automation And Channel-In-A-Box Market Net Revenue Share, By Business segments, 2018 (%)
Figure 155: Company 7 Playout Automation And Channel-In-A-Box Market Net Sales Share, By Geography, 2018 (%)
Figure 156: Company 8 Playout Automation And Channel-In-A-Box Market Net Revenue, By Years, 2018-2019* ($)
Figure 157: Company 8 Playout Automation And Channel-In-A-Box Market Net Revenue Share, By Business segments, 2018 (%)
Figure 158: Company 8 Playout Automation And Channel-In-A-Box Market Net Sales Share, By Geography, 2018 (%)
Figure 159: Company 9 Playout Automation And Channel-In-A-Box Market Net Revenue, By Years, 2018-2019* ($)
Figure 160: Company 9 Playout Automation And Channel-In-A-Box Market Net Revenue Share, By Business segments, 2018 (%)
Figure 161: Company 9 Playout Automation And Channel-In-A-Box Market Net Sales Share, By Geography, 2018 (%)
Figure 162: Company 10 Playout Automation And Channel-In-A-Box Market Net Revenue, By Years, 2018-2019* ($)
Figure 163: Company 10 Playout Automation And Channel-In-A-Box Market Net Revenue Share, By Business segments, 2018 (%)
Figure 164: Company 10 Playout Automation And Channel-In-A-Box Market Net Sales Share, By Geography, 2018 (%)
Figure 165: Company 11 Playout Automation And Channel-In-A-Box Market Net Revenue, By Years, 2018-2019* ($)
Figure 166: Company 11 Playout Automation And Channel-In-A-Box Market Net Revenue Share, By Business segments, 2018 (%)
Figure 167: Company 11 Playout Automation And Channel-In-A-Box Market Net Sales Share, By Geography, 2018 (%)
Figure 168: Company 12 Playout Automation And Channel-In-A-Box Market Net Revenue, By Years, 2018-2019* ($)
Figure 169: Company 12 Playout Automation And Channel-In-A-Box Market Net Revenue Share, By Business segments, 2018 (%)
Figure 170: Company 12 Playout Automation And Channel-In-A-Box Market Net Sales Share, By Geography, 2018 (%)
Figure 171: Company 13 Playout Automation And Channel-In-A-Box Market Net Revenue, By Years, 2018-2019* ($)
Figure 172: Company 13 Playout Automation And Channel-In-A-Box Market Net Revenue Share, By Business segments, 2018 (%)
Figure 173: Company 13 Playout Automation And Channel-In-A-Box Market Net Sales Share, By Geography, 2018 (%)
Figure 174: Company 14 Playout Automation And Channel-In-A-Box Market Net Revenue, By Years, 2018-2019* ($)
Figure 175: Company 14 Playout Automation And Channel-In-A-Box Market Net Revenue Share, By Business segments, 2018 (%)
Figure 176: Company 14 Playout Automation And Channel-In-A-Box Market Net Sales Share, By Geography, 2018 (%)
Figure 177: Company 15 Playout Automation And Channel-In-A-Box Market Net Revenue, By Years, 2018-2019* ($)
Figure 178: Company 15 Playout Automation And Channel-In-A-Box Market Net Revenue Share, By Business segments, 2018 (%)
Figure 179: Company 15 Playout Automation And Channel-In-A-Box Market Net Sales Share, By Geography, 2018 (%)