 Email
Email Print
Print


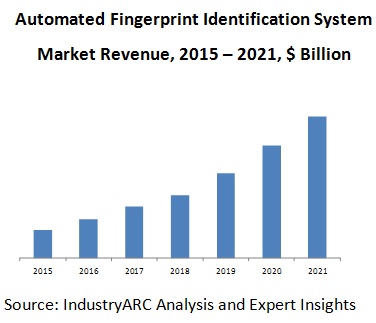
Automated Fingerprint Identification System Market - Forecast(2024 - 2030)
Automated fingerprint identification system is a process through which an individual’s fingerprints are captured as digital images and stored in a database for anytime retrieval. A fingerprint has features such as loops, arches, and whorls, which are exclusive to every individual. Automated fingerprint identification system is widely used by law enforcement agencies to compare finger prints and arrest criminals. However, with technological modernization, a version of automated fingerprint identification system is used by organizations to let employees to login/logout at their workplace. Fingerprints can not only be used to ensure that they have the permission to gain access to an office or use equipment but also to authenticate a person’s identity. Therefore, automated fingerprint identification system is used across instances wherein the sensitive information needs to be restricted.
The technological evolution from the manual processes to digital processes is one of the key drivers for the global automated fingerprint identification system market. Also, with the increase in demand to store and retrieve criminal records, the need for the digitization of the data through the use of automated fingerprint identification system would boost this market for law enforcement applications across the government sector. In addition, the need for safe transactions across the banking & finance industry is another factor propelling the global automated fingerprint identification system market. The rising preference and adoption of mobile payments is also analyzed to bolster the automated fingerprint identification system market to ensure safe transactions over instead of a password.
The global automated fingerprint identification system market is classified by analysis type as follows
The global automated fingerprint identification system market is segmented into components as follows:
The global automated fingerprint identification system market is classified into applications as follows:
The global automated fingerprint identification system market is further bifurcated on the basis of end-users into:
Lastly, the global automated fingerprint identification system market is segmented by regions into North America, Asia Pacific (APAC), Europe and Rest of the World (RoW). The market is expected to grow significantly across North America, due to the presence of several key players in the region.
Some of the key players operating in the global automated fingerprint identification system market are:
The technological evolution from the manual processes to digital processes is one of the key drivers for the global automated fingerprint identification system market. Also, with the increase in demand to store and retrieve criminal records, the need for the digitization of the data through the use of automated fingerprint identification system would boost this market for law enforcement applications across the government sector. In addition, the need for safe transactions across the banking & finance industry is another factor propelling the global automated fingerprint identification system market. The rising preference and adoption of mobile payments is also analyzed to bolster the automated fingerprint identification system market to ensure safe transactions over instead of a password.
The global automated fingerprint identification system market is classified by analysis type as follows
- Latent Analysis
- Ten-print Analysis.
The global automated fingerprint identification system market is segmented into components as follows:
- Hardware
- Displays
- Fingerprint Input Modules
- Microcontrollers/Microprocessor
- Others
- Software
- Services.
The global automated fingerprint identification system market is classified into applications as follows:
- Civil,
- Criminal
- Others.
The global automated fingerprint identification system market is further bifurcated on the basis of end-users into:
- Healthcare
- Banking & Finance
- Government
- Transportation
- Education & Research
- Hospitality
- Others.
Lastly, the global automated fingerprint identification system market is segmented by regions into North America, Asia Pacific (APAC), Europe and Rest of the World (RoW). The market is expected to grow significantly across North America, due to the presence of several key players in the region.
Some of the key players operating in the global automated fingerprint identification system market are:
- 3M Cogent, Inc. (U.S.)
- NEC Corporation (Japan)
- M2sys Technology (U.S.)
- Dermalog Identification Systems GmbH (Germany)
- Safran Group (France) among others.
1. Automated Fingerprint Identification System Market - Overview
1.1. Definitions and Scope
2. Automated Fingerprint Identification System Market - Executive summary
2.1. Market Revenue, Market Size and Key Trends by Company
2.2. Key Trends by type of Application
2.3. Key Trends segmented by Geography
3. Automated Fingerprint Identification System Market
3.1. Comparative analysis
3.1.1. Product Benchmarking - Top 10 companies
3.1.2. Top 5 Financials Analysis
3.1.3. Market Value split by Top 10 companies
3.1.4. Patent Analysis - Top 10 companies
3.1.5. Pricing Analysis
4. Automated Fingerprint Identification System Market – Startup companies Scenario Premium
4.1. Top 10 startup company Analysis by
4.1.1. Investment
4.1.2. Revenue
4.1.3. Market Shares
4.1.4. Market Size and Application Analysis
4.1.5. Venture Capital and Funding Scenario
5. Automated Fingerprint Identification System Market – Industry Market Entry Scenario Premium
5.1. Regulatory Framework Overview
5.2. New Business and Ease of Doing business index
5.3. Case studies of successful ventures
5.4. Customer Analysis – Top 10 companies
6. Automated Fingerprint Identification System Market Forces
6.1. Drivers
6.2. Constraints
6.3. Challenges
6.4. Porters five force model
6.4.1. Bargaining power of suppliers
6.4.2. Bargaining powers of customers
6.4.3. Threat of new entrants
6.4.4. Rivalry among existing players
6.4.5. Threat of substitutes
7. Automated Fingerprint Identification System Market -Strategic analysis
7.1. Value chain analysis
7.2. Opportunities analysis
7.3. Product life cycle
7.4. Suppliers and distributors Market Share
8. Automated Fingerprint Identification System Market – By Analysis Type (Market Size -$Million / $Billion)
8.1. Market Size and Market Share Analysis
8.2. Application Revenue and Trend Research
8.3. Product Segment Analysis
8.3.1. Introduction
8.3.2. Latent Analysis
8.3.3. Ten-print Analysis
9. Automated Fingerprint Identification System Market – By Components (Market Size -$Million / $Billion)
9.1. Introduction
9.2. Hardware
9.2.1. Displays
9.2.2. Fingerprint Input Modules
9.2.3. Microcontrollers/Microprocessors
9.2.4. Others
9.3. Software
9.4. Services
10. Automated Fingerprint Identification System Market – By Application (Market Size -$Million / $Billion)
10.1. Introduction
10.2. Civil
10.3. Criminal
10.4. Others
11. Automated Fingerprint Identification System – By End Use Industry(Market Size -$Million / $Billion)
11.1. Segment type Size and Market Share Analysis
11.2. Application Revenue and Trends by type of Application
11.3. Application Segment Analysis by Type
11.3.1. Introduction
11.3.2. Healthcare
11.3.3. Banking & Finance
11.3.4. Government
11.3.5. Transportation
11.3.6. Education & Research
11.3.7. Hospitality
11.3.8. Others
12. Automated Fingerprint Identification System - By Geography (Market Size -$Million / $Billion)
12.1. Automated Fingerprint Identification System Market - North America Segment Research
12.2. North America Market Research (Million / $Billion)
12.2.1. Segment type Size and Market Size Analysis
12.2.2. Revenue and Trends
12.2.3. Application Revenue and Trends by type of Application
12.2.4. Company Revenue and Product Analysis
12.2.5. North America Product type and Application Market Size
12.2.5.1. U.S.
12.2.5.2. Canada
12.2.5.3. Mexico
12.2.5.4. Rest of North America
12.3. Automated Fingerprint Identification System - South America Segment Research
12.4. South America Market Research (Market Size -$Million / $Billion)
12.4.1. Segment type Size and Market Size Analysis
12.4.2. Revenue and Trends
12.4.3. Application Revenue and Trends by type of Application
12.4.4. Company Revenue and Product Analysis
12.4.5. South America Product type and Application Market Size
12.4.5.1. Brazil
12.4.5.2. Venezuela
12.4.5.3. Argentina
12.4.5.4. Ecuador
12.4.5.5. Peru
12.4.5.6. Colombia
12.4.5.7. Costa Rica
12.4.5.8. Rest of South America
12.5. Automated Fingerprint Identification System - Europe Segment Research
12.6. Europe Market Research (Market Size -$Million / $Billion)
12.6.1. Segment type Size and Market Size Analysis
12.6.2. Revenue and Trends
12.6.3. Application Revenue and Trends by type of Application
12.6.4. Company Revenue and Product Analysis
12.6.5. Europe Segment Product type and Application Market Size
12.6.5.1. U.K
12.6.5.2. Germany
12.6.5.3. Italy
12.6.5.4. France
12.6.5.5. Netherlands
12.6.5.6. Belgium
12.6.5.7. Spain
12.6.5.8. Denmark
12.6.5.9. Rest of Europe
12.7. Automated Fingerprint Identification System – APAC Segment Research
12.8. APAC Market Research (Market Size -$Million / $Billion)
12.8.1. Segment type Size and Market Size Analysis
12.8.2. Revenue and Trends
12.8.3. Application Revenue and Trends by type of Application
12.8.4. Company Revenue and Product Analysis
12.8.5. APAC Segment – Product type and Application Market Size
12.8.5.1. China
12.8.5.2. Australia
12.8.5.3. Japan
12.8.5.4. South Korea
12.8.5.5. India
12.8.5.6. Taiwan
12.8.5.7. Malaysia
13. Automated Fingerprint Identification System Market - Entropy
13.1. New product launches
13.2. M&A's, collaborations, JVs and partnerships
14. Automated Fingerprint Identification System Market – Industry / Segment Competition landscape Premium
14.1. Market Share Analysis
14.1.1. Market Share by Country- Top companies
14.1.2. Market Share by Region- Top 10 companies
14.1.3. Market Share by type of Application – Top 10 companies
14.1.4. Market Share by type of Product / Product category- Top 10 companies
14.1.5. Market Share at global level- Top 10 companies
14.1.6. Best Practises for companies
15. Automated Fingerprint Identification System Market – Key Company List by Country Premium
16. Automated Fingerprint Identification System Market Company Analysis
16.1. Market Share, Company Revenue, Products, M&A, Developments
16.2. 3M Cogent, Inc. (U.S.)
16.3. NEC Corporation (Japan)
16.4. M2sys Technology (U.S.)
16.5. Dermalog Identification Systems GmbH (Germany)
16.6. Safran Group (France) among others.
16.7. Company 6
16.8. Company 7
16.9. Company 8
16.10. Company 9
16.11. Company 10 and More
"*Financials would be provided on a best efforts basis for private companies"
17. Automated Fingerprint Identification System Market -Appendix
17.1. Abbreviations
17.2. Sources
18. Automated Fingerprint Identification System Market -Methodology Premium
18.1. Research Methodology
18.1.1. Company Expert Interviews
18.1.2. Industry Databases
18.1.3. Associations
18.1.4. Company News
18.1.5. Company Annual Reports
18.1.6. Application Trends
18.1.7. New Products and Product database
18.1.8. Company Transcripts
18.1.9. R&D Trends
18.1.10. Key Opinion Leaders Interviews
18.1.11. Supply and Demand Trends
List of Tables:
Table 1: Automated Fingerprint Identification System Market Overview 2021-2026
Table 2: Automated Fingerprint Identification System Market Leader Analysis 2018-2019 (US$)
Table 3: Automated Fingerprint Identification System Market Product Analysis 2018-2019 (US$)
Table 4: Automated Fingerprint Identification System Market End User Analysis 2018-2019 (US$)
Table 5: Automated Fingerprint Identification System Market Patent Analysis 2013-2018* (US$)
Table 6: Automated Fingerprint Identification System Market Financial Analysis 2018-2019 (US$)
Table 7: Automated Fingerprint Identification System Market Driver Analysis 2018-2019 (US$)
Table 8: Automated Fingerprint Identification System Market Challenges Analysis 2018-2019 (US$)
Table 9: Automated Fingerprint Identification System Market Constraint Analysis 2018-2019 (US$)
Table 10: Automated Fingerprint Identification System Market Supplier Bargaining Power Analysis 2018-2019 (US$)
Table 11: Automated Fingerprint Identification System Market Buyer Bargaining Power Analysis 2018-2019 (US$)
Table 12: Automated Fingerprint Identification System Market Threat of Substitutes Analysis 2018-2019 (US$)
Table 13: Automated Fingerprint Identification System Market Threat of New Entrants Analysis 2018-2019 (US$)
Table 14: Automated Fingerprint Identification System Market Degree of Competition Analysis 2018-2019 (US$)
Table 15: Automated Fingerprint Identification System Market Value Chain Analysis 2018-2019 (US$)
Table 16: Automated Fingerprint Identification System Market Pricing Analysis 2021-2026 (US$)
Table 17: Automated Fingerprint Identification System Market Opportunities Analysis 2021-2026 (US$)
Table 18: Automated Fingerprint Identification System Market Product Life Cycle Analysis 2021-2026 (US$)
Table 19: Automated Fingerprint Identification System Market Supplier Analysis 2018-2019 (US$)
Table 20: Automated Fingerprint Identification System Market Distributor Analysis 2018-2019 (US$)
Table 21: Automated Fingerprint Identification System Market Trend Analysis 2018-2019 (US$)
Table 22: Automated Fingerprint Identification System Market Size 2018 (US$)
Table 23: Automated Fingerprint Identification System Market Forecast Analysis 2021-2026 (US$)
Table 24: Automated Fingerprint Identification System Market Sales Forecast Analysis 2021-2026 (Units)
Table 25: Automated Fingerprint Identification System Market, Revenue & Volume,By Analysis Type, 2021-2026 ($)
Table 26: Automated Fingerprint Identification System MarketBy Analysis Type, Revenue & Volume,By Latent Analysis, 2021-2026 ($)
Table 27: Automated Fingerprint Identification System MarketBy Analysis Type, Revenue & Volume,By Ten-print Analysis, 2021-2026 ($)
Table 28: Automated Fingerprint Identification System Market, Revenue & Volume,By Components, 2021-2026 ($)
Table 29: Automated Fingerprint Identification System MarketBy Components, Revenue & Volume,By Hardware, 2021-2026 ($)
Table 30: Automated Fingerprint Identification System MarketBy Components, Revenue & Volume,By Software, 2021-2026 ($)
Table 31: Automated Fingerprint Identification System Market, Revenue & Volume,By Application, 2021-2026 ($)
Table 32: Automated Fingerprint Identification System MarketBy Application, Revenue & Volume,By Civil, 2021-2026 ($)
Table 33: Automated Fingerprint Identification System MarketBy Application, Revenue & Volume,By Criminal, 2021-2026 ($)
Table 34: Automated Fingerprint Identification System Market, Revenue & Volume,By End-users, 2021-2026 ($)
Table 35: Automated Fingerprint Identification System MarketBy End-users, Revenue & Volume,By Healthcare, 2021-2026 ($)
Table 36: Automated Fingerprint Identification System MarketBy End-users, Revenue & Volume,By Banking & Finance, 2021-2026 ($)
Table 37: Automated Fingerprint Identification System MarketBy End-users, Revenue & Volume,By Government, 2021-2026 ($)
Table 38: Automated Fingerprint Identification System MarketBy End-users, Revenue & Volume,By Transportation, 2021-2026 ($)
Table 39: Automated Fingerprint Identification System MarketBy End-users, Revenue & Volume,By Education & Research, 2021-2026 ($)
Table 40: North America Automated Fingerprint Identification System Market, Revenue & Volume,By Analysis Type, 2021-2026 ($)
Table 41: North America Automated Fingerprint Identification System Market, Revenue & Volume,By Components, 2021-2026 ($)
Table 42: North America Automated Fingerprint Identification System Market, Revenue & Volume,By Application, 2021-2026 ($)
Table 43: North America Automated Fingerprint Identification System Market, Revenue & Volume,By End-users, 2021-2026 ($)
Table 44: South america Automated Fingerprint Identification System Market, Revenue & Volume,By Analysis Type, 2021-2026 ($)
Table 45: South america Automated Fingerprint Identification System Market, Revenue & Volume,By Components, 2021-2026 ($)
Table 46: South america Automated Fingerprint Identification System Market, Revenue & Volume,By Application, 2021-2026 ($)
Table 47: South america Automated Fingerprint Identification System Market, Revenue & Volume,By End-users, 2021-2026 ($)
Table 48: Europe Automated Fingerprint Identification System Market, Revenue & Volume,By Analysis Type, 2021-2026 ($)
Table 49: Europe Automated Fingerprint Identification System Market, Revenue & Volume,By Components, 2021-2026 ($)
Table 50: Europe Automated Fingerprint Identification System Market, Revenue & Volume,By Application, 2021-2026 ($)
Table 51: Europe Automated Fingerprint Identification System Market, Revenue & Volume,By End-users, 2021-2026 ($)
Table 52: APAC Automated Fingerprint Identification System Market, Revenue & Volume,By Analysis Type, 2021-2026 ($)
Table 53: APAC Automated Fingerprint Identification System Market, Revenue & Volume,By Components, 2021-2026 ($)
Table 54: APAC Automated Fingerprint Identification System Market, Revenue & Volume,By Application, 2021-2026 ($)
Table 55: APAC Automated Fingerprint Identification System Market, Revenue & Volume,By End-users, 2021-2026 ($)
Table 56: Middle East & Africa Automated Fingerprint Identification System Market, Revenue & Volume,By Analysis Type, 2021-2026 ($)
Table 57: Middle East & Africa Automated Fingerprint Identification System Market, Revenue & Volume,By Components, 2021-2026 ($)
Table 58: Middle East & Africa Automated Fingerprint Identification System Market, Revenue & Volume,By Application, 2021-2026 ($)
Table 59: Middle East & Africa Automated Fingerprint Identification System Market, Revenue & Volume,By End-users, 2021-2026 ($)
Table 60: Russia Automated Fingerprint Identification System Market, Revenue & Volume,By Analysis Type, 2021-2026 ($)
Table 61: Russia Automated Fingerprint Identification System Market, Revenue & Volume,By Components, 2021-2026 ($)
Table 62: Russia Automated Fingerprint Identification System Market, Revenue & Volume,By Application, 2021-2026 ($)
Table 63: Russia Automated Fingerprint Identification System Market, Revenue & Volume,By End-users, 2021-2026 ($)
Table 64: Israel Automated Fingerprint Identification System Market, Revenue & Volume,By Analysis Type, 2021-2026 ($)
Table 65: Israel Automated Fingerprint Identification System Market, Revenue & Volume,By Components, 2021-2026 ($)
Table 66: Israel Automated Fingerprint Identification System Market, Revenue & Volume,By Application, 2021-2026 ($)
Table 67: Israel Automated Fingerprint Identification System Market, Revenue & Volume,By End-users, 2021-2026 ($)
Table 68: Top Companies 2018 (US$)Automated Fingerprint Identification System Market, Revenue & Volume
Table 69: Product Launch 2018-2019 Automated Fingerprint Identification System Market, Revenue & Volume
Table 70: Mergers & Acquistions 2018-2019 Automated Fingerprint Identification System Market, Revenue & Volume
List of Figures:
Figure 1: Overview of Automated Fingerprint Identification System Market 2021-2026
Figure 2: Market Share Analysis for Automated Fingerprint Identification System Market 2018 (US$)
Figure 3: Product Comparison in Automated Fingerprint Identification System Market 2018-2019 (US$)
Figure 4: End User Profile for Automated Fingerprint Identification System Market 2018-2019 (US$)
Figure 5: Patent Application and Grant in Automated Fingerprint Identification System Market 2013-2018* (US$)
Figure 6: Top 5 Companies Financial Analysis in Automated Fingerprint Identification System Market 2018-2019 (US$)
Figure 7: Market Entry Strategy in Automated Fingerprint Identification System Market 2018-2019
Figure 8: Ecosystem Analysis in Automated Fingerprint Identification System Market2018
Figure 9: Average Selling Price in Automated Fingerprint Identification System Market 2021-2026
Figure 10: Top Opportunites in Automated Fingerprint Identification System Market 2018-2019
Figure 11: Market Life Cycle Analysis in Automated Fingerprint Identification System Market
Figure 12: GlobalBy Analysis TypeAutomated Fingerprint Identification System Market Revenue, 2021-2026 ($)
Figure 13: GlobalBy ComponentsAutomated Fingerprint Identification System Market Revenue, 2021-2026 ($)
Figure 14: GlobalBy ApplicationAutomated Fingerprint Identification System Market Revenue, 2021-2026 ($)
Figure 15: GlobalBy End-usersAutomated Fingerprint Identification System Market Revenue, 2021-2026 ($)
Figure 16: Global Automated Fingerprint Identification System Market - By Geography
Figure 17: Global Automated Fingerprint Identification System Market Value & Volume, By Geography, 2021-2026 ($)
Figure 18: Global Automated Fingerprint Identification System Market CAGR, By Geography, 2021-2026 (%)
Figure 19: North America Automated Fingerprint Identification System Market Value & Volume, 2021-2026 ($)
Figure 20: US Automated Fingerprint Identification System Market Value & Volume, 2021-2026 ($)
Figure 21: US GDP and Population, 2018-2019 ($)
Figure 22: US GDP – Composition of 2018, By Sector of Origin
Figure 23: US Export and Import Value & Volume, 2018-2019 ($)
Figure 24: Canada Automated Fingerprint Identification System Market Value & Volume, 2021-2026 ($)
Figure 25: Canada GDP and Population, 2018-2019 ($)
Figure 26: Canada GDP – Composition of 2018, By Sector of Origin
Figure 27: Canada Export and Import Value & Volume, 2018-2019 ($)
Figure 28: Mexico Automated Fingerprint Identification System Market Value & Volume, 2021-2026 ($)
Figure 29: Mexico GDP and Population, 2018-2019 ($)
Figure 30: Mexico GDP – Composition of 2018, By Sector of Origin
Figure 31: Mexico Export and Import Value & Volume, 2018-2019 ($)
Figure 32: South America Automated Fingerprint Identification System MarketSouth America 3D Printing Market Value & Volume, 2021-2026 ($)
Figure 33: Brazil Automated Fingerprint Identification System Market Value & Volume, 2021-2026 ($)
Figure 34: Brazil GDP and Population, 2018-2019 ($)
Figure 35: Brazil GDP – Composition of 2018, By Sector of Origin
Figure 36: Brazil Export and Import Value & Volume, 2018-2019 ($)
Figure 37: Venezuela Automated Fingerprint Identification System Market Value & Volume, 2021-2026 ($)
Figure 38: Venezuela GDP and Population, 2018-2019 ($)
Figure 39: Venezuela GDP – Composition of 2018, By Sector of Origin
Figure 40: Venezuela Export and Import Value & Volume, 2018-2019 ($)
Figure 41: Argentina Automated Fingerprint Identification System Market Value & Volume, 2021-2026 ($)
Figure 42: Argentina GDP and Population, 2018-2019 ($)
Figure 43: Argentina GDP – Composition of 2018, By Sector of Origin
Figure 44: Argentina Export and Import Value & Volume, 2018-2019 ($)
Figure 45: Ecuador Automated Fingerprint Identification System Market Value & Volume, 2021-2026 ($)
Figure 46: Ecuador GDP and Population, 2018-2019 ($)
Figure 47: Ecuador GDP – Composition of 2018, By Sector of Origin
Figure 48: Ecuador Export and Import Value & Volume, 2018-2019 ($)
Figure 49: Peru Automated Fingerprint Identification System Market Value & Volume, 2021-2026 ($)
Figure 50: Peru GDP and Population, 2018-2019 ($)
Figure 51: Peru GDP – Composition of 2018, By Sector of Origin
Figure 52: Peru Export and Import Value & Volume, 2018-2019 ($)
Figure 53: Colombia Automated Fingerprint Identification System Market Value & Volume, 2021-2026 ($)
Figure 54: Colombia GDP and Population, 2018-2019 ($)
Figure 55: Colombia GDP – Composition of 2018, By Sector of Origin
Figure 56: Colombia Export and Import Value & Volume, 2018-2019 ($)
Figure 57: Costa Rica Automated Fingerprint Identification System MarketCosta Rica 3D Printing Market Value & Volume, 2021-2026 ($)
Figure 58: Costa Rica GDP and Population, 2018-2019 ($)
Figure 59: Costa Rica GDP – Composition of 2018, By Sector of Origin
Figure 60: Costa Rica Export and Import Value & Volume, 2018-2019 ($)
Figure 61: Europe Automated Fingerprint Identification System Market Value & Volume, 2021-2026 ($)
Figure 62: U.K Automated Fingerprint Identification System Market Value & Volume, 2021-2026 ($)
Figure 63: U.K GDP and Population, 2018-2019 ($)
Figure 64: U.K GDP – Composition of 2018, By Sector of Origin
Figure 65: U.K Export and Import Value & Volume, 2018-2019 ($)
Figure 66: Germany Automated Fingerprint Identification System Market Value & Volume, 2021-2026 ($)
Figure 67: Germany GDP and Population, 2018-2019 ($)
Figure 68: Germany GDP – Composition of 2018, By Sector of Origin
Figure 69: Germany Export and Import Value & Volume, 2018-2019 ($)
Figure 70: Italy Automated Fingerprint Identification System Market Value & Volume, 2021-2026 ($)
Figure 71: Italy GDP and Population, 2018-2019 ($)
Figure 72: Italy GDP – Composition of 2018, By Sector of Origin
Figure 73: Italy Export and Import Value & Volume, 2018-2019 ($)
Figure 74: France Automated Fingerprint Identification System Market Value & Volume, 2021-2026 ($)
Figure 75: France GDP and Population, 2018-2019 ($)
Figure 76: France GDP – Composition of 2018, By Sector of Origin
Figure 77: France Export and Import Value & Volume, 2018-2019 ($)
Figure 78: Netherlands Automated Fingerprint Identification System Market Value & Volume, 2021-2026 ($)
Figure 79: Netherlands GDP and Population, 2018-2019 ($)
Figure 80: Netherlands GDP – Composition of 2018, By Sector of Origin
Figure 81: Netherlands Export and Import Value & Volume, 2018-2019 ($)
Figure 82: Belgium Automated Fingerprint Identification System Market Value & Volume, 2021-2026 ($)
Figure 83: Belgium GDP and Population, 2018-2019 ($)
Figure 84: Belgium GDP – Composition of 2018, By Sector of Origin
Figure 85: Belgium Export and Import Value & Volume, 2018-2019 ($)
Figure 86: Spain Automated Fingerprint Identification System Market Value & Volume, 2021-2026 ($)
Figure 87: Spain GDP and Population, 2018-2019 ($)
Figure 88: Spain GDP – Composition of 2018, By Sector of Origin
Figure 89: Spain Export and Import Value & Volume, 2018-2019 ($)
Figure 90: Denmark Automated Fingerprint Identification System Market Value & Volume, 2021-2026 ($)
Figure 91: Denmark GDP and Population, 2018-2019 ($)
Figure 92: Denmark GDP – Composition of 2018, By Sector of Origin
Figure 93: Denmark Export and Import Value & Volume, 2018-2019 ($)
Figure 94: APAC Automated Fingerprint Identification System Market Value & Volume, 2021-2026 ($)
Figure 95: China Automated Fingerprint Identification System MarketValue & Volume, 2021-2026
Figure 96: China GDP and Population, 2018-2019 ($)
Figure 97: China GDP – Composition of 2018, By Sector of Origin
Figure 98: China Export and Import Value & Volume, 2018-2019 ($)Automated Fingerprint Identification System MarketChina Export and Import Value & Volume, 2018-2019 ($)
Figure 99: Australia Automated Fingerprint Identification System Market Value & Volume, 2021-2026 ($)
Figure 100: Australia GDP and Population, 2018-2019 ($)
Figure 101: Australia GDP – Composition of 2018, By Sector of Origin
Figure 102: Australia Export and Import Value & Volume, 2018-2019 ($)
Figure 103: South Korea Automated Fingerprint Identification System Market Value & Volume, 2021-2026 ($)
Figure 104: South Korea GDP and Population, 2018-2019 ($)
Figure 105: South Korea GDP – Composition of 2018, By Sector of Origin
Figure 106: South Korea Export and Import Value & Volume, 2018-2019 ($)
Figure 107: India Automated Fingerprint Identification System Market Value & Volume, 2021-2026 ($)
Figure 108: India GDP and Population, 2018-2019 ($)
Figure 109: India GDP – Composition of 2018, By Sector of Origin
Figure 110: India Export and Import Value & Volume, 2018-2019 ($)
Figure 111: Taiwan Automated Fingerprint Identification System MarketTaiwan 3D Printing Market Value & Volume, 2021-2026 ($)
Figure 112: Taiwan GDP and Population, 2018-2019 ($)
Figure 113: Taiwan GDP – Composition of 2018, By Sector of Origin
Figure 114: Taiwan Export and Import Value & Volume, 2018-2019 ($)
Figure 115: Malaysia Automated Fingerprint Identification System MarketMalaysia 3D Printing Market Value & Volume, 2021-2026 ($)
Figure 116: Malaysia GDP and Population, 2018-2019 ($)
Figure 117: Malaysia GDP – Composition of 2018, By Sector of Origin
Figure 118: Malaysia Export and Import Value & Volume, 2018-2019 ($)
Figure 119: Hong Kong Automated Fingerprint Identification System MarketHong Kong 3D Printing Market Value & Volume, 2021-2026 ($)
Figure 120: Hong Kong GDP and Population, 2018-2019 ($)
Figure 121: Hong Kong GDP – Composition of 2018, By Sector of Origin
Figure 122: Hong Kong Export and Import Value & Volume, 2018-2019 ($)
Figure 123: Middle East & Africa Automated Fingerprint Identification System MarketMiddle East & Africa 3D Printing Market Value & Volume, 2021-2026 ($)
Figure 124: Russia Automated Fingerprint Identification System MarketRussia 3D Printing Market Value & Volume, 2021-2026 ($)
Figure 125: Russia GDP and Population, 2018-2019 ($)
Figure 126: Russia GDP – Composition of 2018, By Sector of Origin
Figure 127: Russia Export and Import Value & Volume, 2018-2019 ($)
Figure 128: Israel Automated Fingerprint Identification System Market Value & Volume, 2021-2026 ($)
Figure 129: Israel GDP and Population, 2018-2019 ($)
Figure 130: Israel GDP – Composition of 2018, By Sector of Origin
Figure 131: Israel Export and Import Value & Volume, 2018-2019 ($)
Figure 132: Entropy Share, By Strategies, 2018-2019* (%)Automated Fingerprint Identification System Market
Figure 133: Developments, 2018-2019*Automated Fingerprint Identification System Market
Figure 134: Company 1 Automated Fingerprint Identification System Market Net Revenue, By Years, 2018-2019* ($)
Figure 135: Company 1 Automated Fingerprint Identification System Market Net Revenue Share, By Business segments, 2018 (%)
Figure 136: Company 1 Automated Fingerprint Identification System Market Net Sales Share, By Geography, 2018 (%)
Figure 137: Company 2 Automated Fingerprint Identification System Market Net Revenue, By Years, 2018-2019* ($)
Figure 138: Company 2 Automated Fingerprint Identification System Market Net Revenue Share, By Business segments, 2018 (%)
Figure 139: Company 2 Automated Fingerprint Identification System Market Net Sales Share, By Geography, 2018 (%)
Figure 140: Company 3Automated Fingerprint Identification System Market Net Revenue, By Years, 2018-2019* ($)
Figure 141: Company 3Automated Fingerprint Identification System Market Net Revenue Share, By Business segments, 2018 (%)
Figure 142: Company 3Automated Fingerprint Identification System Market Net Sales Share, By Geography, 2018 (%)
Figure 143: Company 4 Automated Fingerprint Identification System Market Net Revenue, By Years, 2018-2019* ($)
Figure 144: Company 4 Automated Fingerprint Identification System Market Net Revenue Share, By Business segments, 2018 (%)
Figure 145: Company 4 Automated Fingerprint Identification System Market Net Sales Share, By Geography, 2018 (%)
Figure 146: Company 5 Automated Fingerprint Identification System Market Net Revenue, By Years, 2018-2019* ($)
Figure 147: Company 5 Automated Fingerprint Identification System Market Net Revenue Share, By Business segments, 2018 (%)
Figure 148: Company 5 Automated Fingerprint Identification System Market Net Sales Share, By Geography, 2018 (%)
Figure 149: Company 6 Automated Fingerprint Identification System Market Net Revenue, By Years, 2018-2019* ($)
Figure 150: Company 6 Automated Fingerprint Identification System Market Net Revenue Share, By Business segments, 2018 (%)
Figure 151: Company 6 Automated Fingerprint Identification System Market Net Sales Share, By Geography, 2018 (%)
Figure 152: Company 7 Automated Fingerprint Identification System Market Net Revenue, By Years, 2018-2019* ($)
Figure 153: Company 7 Automated Fingerprint Identification System Market Net Revenue Share, By Business segments, 2018 (%)
Figure 154: Company 7 Automated Fingerprint Identification System Market Net Sales Share, By Geography, 2018 (%)
Figure 155: Company 8 Automated Fingerprint Identification System Market Net Revenue, By Years, 2018-2019* ($)
Figure 156: Company 8 Automated Fingerprint Identification System Market Net Revenue Share, By Business segments, 2018 (%)
Figure 157: Company 8 Automated Fingerprint Identification System Market Net Sales Share, By Geography, 2018 (%)
Figure 158: Company 9 Automated Fingerprint Identification System Market Net Revenue, By Years, 2018-2019* ($)
Figure 159: Company 9 Automated Fingerprint Identification System Market Net Revenue Share, By Business segments, 2018 (%)
Figure 160: Company 9 Automated Fingerprint Identification System Market Net Sales Share, By Geography, 2018 (%)
Figure 161: Company 10 Automated Fingerprint Identification System Market Net Revenue, By Years, 2018-2019* ($)
Figure 162: Company 10 Automated Fingerprint Identification System Market Net Revenue Share, By Business segments, 2018 (%)
Figure 163: Company 10 Automated Fingerprint Identification System Market Net Sales Share, By Geography, 2018 (%)
Figure 164: Company 11 Automated Fingerprint Identification System Market Net Revenue, By Years, 2018-2019* ($)
Figure 165: Company 11 Automated Fingerprint Identification System Market Net Revenue Share, By Business segments, 2018 (%)
Figure 166: Company 11 Automated Fingerprint Identification System Market Net Sales Share, By Geography, 2018 (%)
Figure 167: Company 12 Automated Fingerprint Identification System Market Net Revenue, By Years, 2018-2019* ($)
Figure 168: Company 12 Automated Fingerprint Identification System Market Net Revenue Share, By Business segments, 2018 (%)
Figure 169: Company 12 Automated Fingerprint Identification System Market Net Sales Share, By Geography, 2018 (%)
Figure 170: Company 13Automated Fingerprint Identification System Market Net Revenue, By Years, 2018-2019* ($)
Figure 171: Company 13Automated Fingerprint Identification System Market Net Revenue Share, By Business segments, 2018 (%)
Figure 172: Company 13Automated Fingerprint Identification System Market Net Sales Share, By Geography, 2018 (%)
Figure 173: Company 14 Automated Fingerprint Identification System Market Net Revenue, By Years, 2018-2019* ($)
Figure 174: Company 14 Automated Fingerprint Identification System Market Net Revenue Share, By Business segments, 2018 (%)
Figure 175: Company 14 Automated Fingerprint Identification System Market Net Sales Share, By Geography, 2018 (%)
Figure 176: Company 15 Automated Fingerprint Identification System Market Net Revenue, By Years, 2018-2019* ($)
Figure 177: Company 15 Automated Fingerprint Identification System Market Net Revenue Share, By Business segments, 2018 (%)
Figure 178: Company 15 Automated Fingerprint Identification System Market Net Sales Share, By Geography, 2018 (%)