 Email
Email Print
Print


3D Printed Medical Devices Market - Forecast(2024 - 2030)
3D Printed Medical Devices Market - Overview
3D Printed Medical Devices Market size is estimated to reach $8.6 billion by 2030, growing at a CAGR of 14% during the forecast period 2024-2030. 3D printers are utilized to produce an assortment of medical devices with complicated geometry or characteristics that match the rare anatomy of a patient. Certain instruments are printed from a standard design to prepare numerous exact copies of the identical device. Medical devices produced by 3D printing include orthopedic and cranial implants, surgical instruments, dental restorations such as crowns, and external prosthetics. The 3D printed medical devices market has witnessed exponential growth, fueled by advancements in additive manufacturing technology and the increasing demand for customized healthcare solutions. The market is experiencing a surge in personalized medical devices tailored to individual patient needs, ranging from orthopedic implants to prosthetics, facilitated by the precise and flexible nature of 3D printing. This trend reflects a paradigm shift towards patient-centric care and improved treatment outcomes. Additionally, regulatory frameworks are evolving to accommodate the unique characteristics of 3D printed medical devices, ensuring safety, efficacy, and quality standards. Regulatory bodies are actively collaborating with industry stakeholders to streamline approval processes and establish clear guidelines, fostering innovation while maintaining patient safety. As a result, the 3D printed medical devices market is poised for continued expansion, with projections indicating sustained growth across various medical specialties and applications.
Report Coverage
The report: “3D Printed Medical Devices Market Forecast (2024-2030)”, by Industry ARC, covers an in-depth analysis of the following segments of the 3D Printed Medical Devices Market.
By Type: Surgical Guides, Surgical Instruments, Prosthetics and Implants, Tissue Engineering Products, Others.
By Technology: Photopolymerization, Droplet Deposition (DD) Or Extrusion-Based Technologies, Laser Beam Melting, Electron Beam Melting (EBM), Three-Dimensional Printing (3DP) Or Adhesion Bonding.
By Geography: North America (the U.S, Canada, and Mexico), Europe (Germany, France, UK, Italy, Spain, Russia and Rest of Europe), Asia-Pacific (China, Japan, South Korea, India, Australia & New Zealand, and Rest of Asia-Pacific), South America (Brazil, Argentina, Chile, Colombia, Rest of South America), and Rest of The World (Middle East, Africa).
Key Takeaways
• Geographically, North America 3D Printed Medical Devices Market accounted for the highest revenue share in 2023 and it is poised to dominate the market over the period 2024-2030 owing to the surging high-quality products being provided utilizing progressive technology like 3d printing technology ensuing from considerable financing in research and development in the North American region.
• 3D Printed Medical Devices Market growth is being driven by the proliferating medical applications of 3d Printing Technology in the healthcare industry by offering advantages like customizations, personalization of medical products, and enhanced productivity. However, the deficiency of a proficient workforce owing to restricted specialized training in additive manufacturing is one of the major factors hampering the growth of the 3D Printed Medical Devices Market.
• 3D Printed Medical Devices Market Detailed Analysis on the Strength, Weakness, and Opportunities of the prominent players operating in the market will be provided in the 3D Printed Medical Devices Market report.
3D Printed Medical Devices Market Segment Analysis- By Type
The Prosthetics and Implants Segment held the largest market share of 55% in 2023. This growth is owing to the soaring application of 3d printing technology for customization of prosthetics and implants offering value addition to both patients and physicians. Customized implants have a positive effect on the time needed for surgery, patient recovery time, and the success of the implant. The surging benefits of 3D printed implants like being MRI-compatible and reduction in hazard of infections are further propelling the growth of the Prosthetics and Implants segment.
Furthermore, the Surgical Guides segment is estimated to grow with the fastest CAGR of 15.5% during the forecast period 2024-2030 owing to the soaring application of 3d printed surgical guides based on the DICOM data which is patient-particular for the precise positioning of the implant in the bone structure in conjunction with the application of other surgical instruments.
3D Printed Medical Devices Market Segment Analysis- By Technology
The Photopolymerization Segment held the largest share attributing to 48% of the overall market in 2023 owing to the soaring application of photopolymerization across the medical industry for prosthetics, implants, dental restorations, and porous scaffolds. The advantages of photopolymerization like being solvent-free and energy-effective and the ability to be utilized for heat-sensitive substances are further propelling the growth of this segment.
Furthermore, the Three-Dimensional Printing (3DP) Or Adhesion Bonding segment is estimated to grow with the fastest CAGR of 16% during the forecast period 2024-2030 owing to the surging application of 3d printing technology attributed to its advantages like malleable design, accelerated prototyping, print on demand, robust and lightweight parts, and quick design and manufacture in conjunction with benefits of adhesion bonding like continuous bond and enhanced appearance.
3D Printed Medical Devices Market Segment Analysis- Geography
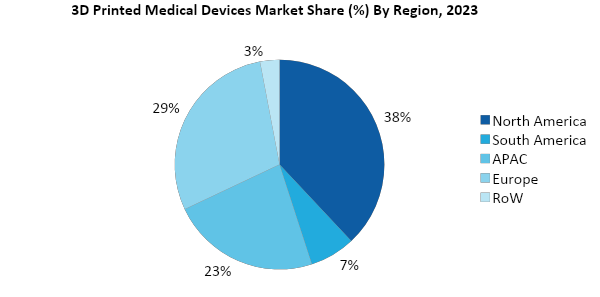
North America (3D Printed Medical Devices Market) held the largest share with 38% of the overall market in 2023. The growth of this region is owing to the existence of the U.S. which is the biggest global producer and consumer of medical devices including surgical instruments in the region. The soaring acceptance of 3D printed medical devices by leading hospitals and laboratories as part of their medical practice and research endeavors are further driving the growth of the 3D Printed Medical Devices Market in this region. The accelerated incorporation of progressive technologies like artificial intelligence in 3D printed medical devices is further propelling the growth of the 3D Printed Medical Devices Market in the North American region.
Furthermore, the Asia-Pacific region is estimated to be the region with the fastest CAGR rate of 17% over the forecast period 2024-2030. This growth is owing to factors like surging government initiatives and R&D Activities in the Asia-Pacific region. The increasing predominance of cardiac ailments which may involve the application of surgical instruments and the proliferating demand for progressive healthcare services are further fueling the progress of the 3D Printed Medical Devices Market in the Asia-Pacific region.
Drivers – 3D Printed Medical Devices Market
• Surging Applications Of 3D Printing for Orthopaedic Surgery Are Projected to Drive the Growth Of 3D Printed Medical Devices Market
Three-dimensional (3D) printing is a more and more evolving technology with the possibility to provide considerable contributions to a surgical practice involving surgical instruments. This is a kind of manufacturing procedure in which materials like plastic or metal are collected in layers to build a 3D object from a digital model. Orthopaedics has been among the earliest medical fields to utilize 3D printing. Orthopaedic surgeons utilize it in their clinical practice for patient-particular orthopaedic uses. 3D printed models not only minimize the rate of re-operation but play an important role in surgical planning and in the coaching of apprenticed surgeons. The advantages of the application of 3D printed models to orthopaedics surgery include describing to patients or students the particulars of surgery or to practice the surgery itself. With 3D printing technology, surgeons can presently analyze patient anatomy in a more concrete manner and permit enhanced, more detailed surgical planning in comparison with the conventional 2-dimensional radiological images. Pre-operations can also be performed on plastic models which can be basic support in the placement of screws or surgical plates, to envision the ultimate result of the interference. The surging applications of 3D Printing for Orthopaedic Surgery are therefore fuelling the growth of the 3D Printed Medical Devices Market during the forecast period 2024-2030.
• Proliferating Applications Of 3d Bioprinting Are Expected to Boost the Demand Of 3D Printed Medical Devices Market
Bioprinters or 3D bioprinters are automatized instruments for the additive fabrication of 3D functional tissues and organs based on the digital models that are built through different scans utilizing biomaterials. These bioprinters perform on distinct mechanisms and are typically utilized for distinct purposes relying on the kind of biomaterials utilized. Tissue engineering is one of the most outstanding uses of 3D bioprinting. It permits the fabrication of complicated tissues and organs that can take the place of failed or lost tissues. Typical examples of tissues that have been bio-printed for different purposes include skin, bone and cartilage, blood vessels, and liver tissue. Drug discovery needs time-consuming and expensive procedures that demand considerable financial investment and workforce. Therefore, the development of a method to enhance the capability to predict the efficiency and toxicity of newly established medications earlier in the drug discovery procedure assists in minimizing the time and money needed. Bioprinting can manufacture 3D tissue models that look like that of native tissue and are capable of high throughput assays. Most typically, liver and tumour tissues are the fundamental focus to building tissue models for pharmaceuticals. The proliferating applications of 3d Bioprinting are driving the growth of the 3D Printed Medical Devices Market during the forecast period 2024-2030.
Challenges – 3D Printed Medical Devices Market
Challenge Of Sterilizing Polymers Is Hampering the Growth of the 3D Printed Medical Devices Market
It is quite concerning that medical materials are required to be sterilized frequently. Certain polymers may conform with the regulation on chemical stability or strength. However, they may collapse too soon with expanded and repetitive exposure to sterilization techniques that utilize heat. For 3D printing procedures that utilize temperature to shape polymers, requiring soaring thermal resistance means greater processing temperatures. This may need a special high-temperature printer, heated bed, and probably an enclosed build space to curb environmental conditions to avert bending and contraction. It is not simply heated that can prove challenging for sterilizing medical materials but also cleaning the housing of an instrument with a disinfectant that can deteriorate polymers over time. Eastman Chemical has been tracking polymers in medical devices and have found disinfecting polymers with solvents and other chemicals is responsible for premature failures. These issues are thus hampering the growth of the 3D Printed Medical Devices Market.
Market Landscape
Product launches, mergers and acquisitions, joint ventures, and R&D Activities are key strategies adopted by players in the 3D Printed Medical Devices Market. Key companies of this market are
1. Materialise NV
2. Medprin
3. 3D Incredible
4. Protolab
5. Nexxt Spine, LLC
6. Osseus
7. OSSIS
8. Stryker Corporation
9. Zimmer Biomet
10. Anatomics Pty Ltd
Developments:
In August 2023, Materialise opened a new 3D printing facility in Plymouth, Michigan to speed up the delivery of patient-specific medical implants. The facility will focus on 3D printing personalized titanium craniomaxillofacial (CMF) implants, which are used in facial reconstructive surgeries.
In June 2023, Precision ADM, Orthopaedic Innovation Centre (OIC), Tecomet, and EOS announced a partnership to provide an end-to-end solution for medical device additive manufacturing. The partnership will enable rapid development of additively manufactured medical devices.
1. 3D Printed Medical Devices Market Overview
1.1 Definitions and Scope
2. 3D Printed Medical Devices Market - Executive Summary
3. 3D Printed Medical Devices Market– Market Landscape
3.1 Company Benchmarking- Key Companies
3.2 Key Company Financial Analysis
3.3 Market Share Analysis
3.4 Patent Analysis
3.5 Pricing Analysis (Comparison of General Price Offerings in the Market)
4. 3D Printed Medical Devices Market– Startup Company Scenario (Premium)
4.1 Investment
4.2 Revenue
4.3 Venture Capital and Funding Scenario
5. 3D Printed Medical Devices Market– Industry Market Entry Scenario Premium Premium (Premium)
5.1 Regulatory Scenario
5.2 New Business and Ease of Doing business index
5.3 Case Studies of Successful Ventures
6. 3D Printed Medical Devices Market- Market Forces
6.1 Market Drivers
6.2 Market Constraints
6.3 Porters five force model
6.3.1 Bargaining power of suppliers
6.3.2 Bargaining powers of customers
6.3.3 Threat of new entrants
6.3.4 Rivalry among existing players
6.3.5 Threat of substitutes
7. 3D Printed Medical Devices Market– By Strategic Analysis
7.1 Value Chain Analysis
7.2 Opportunities Analysis
7.3 Market Life Cycle Analysis
8. 3D Printed Medical Devices Market - By Type (Market Size –$Million/$Billion)
8.1 Surgical Guides
8.2 Surgical Instruments
8.3 Prosthetics and Implants
8.4 Tissue Engineering Products
8.5 Others
9. 3D Printed Medical Devices Market – By Technology (Market Size –$Million/$Billion)
9.1 Photopolymerization
9.2 Droplet Deposition (DD) Or Extrusion-Based Technologies
9.3 Laser Beam Melting
9.4 Electron Beam Melting (EBM)
9.5 Three-Dimensional Printing (3DP) Or Adhesion Bonding
10. 3D Printed Medical Devices Market- By Geography (Market Size -$Million/Billion)
10.1 North America
10.1.1 U.S
10.1.2 Canada
10.1.3 Mexico
10.2 Europe
10.2.1 Germany
10.2.2 France
10.2.3 UK
10.2.4 Italy
10.2.5 Spain
10.2.6 Russia
10.2.7 Rest of Europe
10.3 Asia-Pacific
10.3.1 China
10.3.2 Japan
10.3.3 South Korea
10.3.4 India
10.3.5 Australia & New Zealand
10.3.6 Rest of Asia-Pacific
10.4 South America
10.4.1 Brazil
10.4.2 Argentina
10.4.3 Chile
10.4.4 Colombia
10.4.5 Rest of South America
10.5 Rest Of The World
10.5.1 Middle East
10.5.2 Africa
11. 3D Printed Medical Devices Market- Market Entropy
11.1 New product launches
11.2 M&A's, collaborations, JVs, and partnerships
12. 3D Printed Medical Devices Market– Industry Competition Landscape (Premium)
12.1 Market Share Analysis
12.1.1 Global Market Share – Key Companies
12.1.2 Market Share by Region – Key Companies
12.1.3 Market Share by Countries – Key Companies
12.2 Competition Matrix
12.3 Best Practices for Companies
13. 3D Printed Medical Devices Market– Key Company List by Country Premium Premium (Premium)
14. 3D Printed Medical Devices Market- Company Analysis
14.1 Materialise NV
14.2 Medprin
14.3 3D Incredible
14.4 Protolab
14.5 Nexxt Spine, LLC
14.6 Osseus Fusion Systems
14.7 OSSIS
14.8 Stryker Corporation
14.9 Zimmer Biomet
14.10 Anatomics Pty Ltd
"*Financials would be provided on a best-efforts basis for private companies"
Connect with our experts to get customized reports that best suit your requirements. Our reports include global-level data, niche markets and competitive landscape.
List of Tables
Table1 3D Printed Medical Devices Market Analysis Overview 2021-2026
Table2 3D Printed Medical Devices Market Analysis Leader Analysis 2018-2019 (US$)
Table3 3D Printed Medical Devices Market AnalysisProduct Analysis 2018-2019 (US$)
Table4 3D Printed Medical Devices Market AnalysisEnd User Analysis 2018-2019 (US$)
Table5 3D Printed Medical Devices Market AnalysisPatent Analysis 2013-2018* (US$)
Table6 3D Printed Medical Devices Market AnalysisFinancial Analysis 2018-2019 (US$)
Table7 3D Printed Medical Devices Market Analysis Driver Analysis 2018-2019 (US$)
Table8 3D Printed Medical Devices Market AnalysisChallenges Analysis 2018-2019 (US$)
Table9 3D Printed Medical Devices Market AnalysisConstraint Analysis 2018-2019 (US$)
Table10 3D Printed Medical Devices Market Analysis Supplier Bargaining Power Analysis 2018-2019 (US$)
Table11 3D Printed Medical Devices Market Analysis Buyer Bargaining Power Analysis 2018-2019 (US$)
Table12 3D Printed Medical Devices Market Analysis Threat of Substitutes Analysis 2018-2019 (US$)
Table13 3D Printed Medical Devices Market Analysis Threat of New Entrants Analysis 2018-2019 (US$)
Table14 3D Printed Medical Devices Market Analysis Degree of Competition Analysis 2018-2019 (US$)
Table15 3D Printed Medical Devices Market AnalysisValue Chain Analysis 2018-2019 (US$)
Table16 3D Printed Medical Devices Market AnalysisPricing Analysis 2021-2026 (US$)
Table17 3D Printed Medical Devices Market AnalysisOpportunities Analysis 2021-2026 (US$)
Table18 3D Printed Medical Devices Market AnalysisProduct Life Cycle Analysis 2021-2026 (US$)
Table19 3D Printed Medical Devices Market AnalysisSupplier Analysis 2018-2019 (US$)
Table20 3D Printed Medical Devices Market AnalysisDistributor Analysis 2018-2019 (US$)
Table21 3D Printed Medical Devices Market Analysis Trend Analysis 2018-2019 (US$)
Table22 3D Printed Medical Devices Market Analysis Size 2018 (US$)
Table23 3D Printed Medical Devices Market Analysis Forecast Analysis 2021-2026 (US$)
Table24 3D Printed Medical Devices Market Analysis Sales Forecast Analysis 2021-2026 (Units)
Table25 3D Printed Medical Devices Market Analysis, Revenue & Volume,By Component, 2021-2026 ($)
Table26 3D Printed Medical Devices Market AnalysisBy Component, Revenue & Volume,3D printers, 2021-2026 ($)
Table27 3D Printed Medical Devices Market AnalysisBy Component, Revenue & Volume,3D bioprinters, 2021-2026 ($)
Table28 3D Printed Medical Devices Market AnalysisBy Component, Revenue & Volume,Materials, 2021-2026 ($)
Table29 3D Printed Medical Devices Market AnalysisBy Component, Revenue & Volume,Tools, 2021-2026 ($)
Table30 3D Printed Medical Devices Market Analysis, Revenue & Volume,By Products, 2021-2026 ($)
Table31 3D Printed Medical Devices Market AnalysisBy Products, Revenue & Volume,Surgical Guides, 2021-2026 ($)
Table32 3D Printed Medical Devices Market AnalysisBy Products, Revenue & Volume,Equipment, 2021-2026 ($)
Table33 3D Printed Medical Devices Market AnalysisBy Products, Revenue & Volume,Implants, 2021-2026 ($)
Table34 3D Printed Medical Devices Market Analysis, Revenue & Volume,By Technology, 2021-2026 ($)
Table35 3D Printed Medical Devices Market AnalysisBy Technology, Revenue & Volume,Electron Beam Melting Technology, 2021-2026 ($)
Table36 3D Printed Medical Devices Market AnalysisBy Technology, Revenue & Volume,Laser Beam Melting Technology, 2021-2026 ($)
Table37 3D Printed Medical Devices Market AnalysisBy Technology, Revenue & Volume,Photopolymerization Technology, 2021-2026 ($)
Table38 3D Printed Medical Devices Market AnalysisBy Technology, Revenue & Volume,3D Printing Technology, 2021-2026 ($)
Table39 3D Printed Medical Devices Market AnalysisBy Technology, Revenue & Volume,Droplet Deposition Technology, 2021-2026 ($)
Table40 3D Printed Medical Devices Market Analysis, Revenue & Volume,By Application, 2021-2026 ($)
Table41 3D Printed Medical Devices Market AnalysisBy Application, Revenue & Volume,By Application 1, 2021-2026 ($)
Table42 3D Printed Medical Devices Market AnalysisBy Application, Revenue & Volume,By Application 2, 2021-2026 ($)
Table43 3D Printed Medical Devices Market AnalysisBy Application, Revenue & Volume,By Application 3, 2021-2026 ($)
Table44 3D Printed Medical Devices Market AnalysisBy Application, Revenue & Volume,By Application 4, 2021-2026 ($)
Table45 3D Printed Medical Devices Market AnalysisBy Application, Revenue & Volume,By Application 5, 2021-2026 ($)
Table46 North America 3D Printed Medical Devices Market Analysis, Revenue & Volume,By Component, 2021-2026 ($)
Table47 North America 3D Printed Medical Devices Market Analysis, Revenue & Volume,By Products, 2021-2026 ($)
Table48 North America 3D Printed Medical Devices Market Analysis, Revenue & Volume,By Technology, 2021-2026 ($)
Table49 North America 3D Printed Medical Devices Market Analysis, Revenue & Volume,By Application, 2021-2026 ($)
Table50 South america 3D Printed Medical Devices Market Analysis, Revenue & Volume,By Component, 2021-2026 ($)
Table51 South america 3D Printed Medical Devices Market Analysis, Revenue & Volume,By Products, 2021-2026 ($)
Table52 South america 3D Printed Medical Devices Market Analysis, Revenue & Volume,By Technology, 2021-2026 ($)
Table53 South america 3D Printed Medical Devices Market Analysis, Revenue & Volume,By Application, 2021-2026 ($)
Table54 Europe 3D Printed Medical Devices Market Analysis, Revenue & Volume,By Component, 2021-2026 ($)
Table55 Europe 3D Printed Medical Devices Market Analysis, Revenue & Volume,By Products, 2021-2026 ($)
Table56 Europe 3D Printed Medical Devices Market Analysis, Revenue & Volume,By Technology, 2021-2026 ($)
Table57 Europe 3D Printed Medical Devices Market Analysis, Revenue & Volume,By Application, 2021-2026 ($)
Table58 APAC 3D Printed Medical Devices Market Analysis, Revenue & Volume,By Component, 2021-2026 ($)
Table59 APAC 3D Printed Medical Devices Market Analysis, Revenue & Volume,By Products, 2021-2026 ($)
Table60 APAC 3D Printed Medical Devices Market Analysis, Revenue & Volume,By Technology, 2021-2026 ($)
Table61 APAC 3D Printed Medical Devices Market Analysis, Revenue & Volume,By Application, 2021-2026 ($)
Table62 Middle East & Africa 3D Printed Medical Devices Market Analysis, Revenue & Volume,By Component, 2021-2026 ($)
Table63 Middle East & Africa 3D Printed Medical Devices Market Analysis, Revenue & Volume,By Products, 2021-2026 ($)
Table64 Middle East & Africa 3D Printed Medical Devices Market Analysis, Revenue & Volume,By Technology, 2021-2026 ($)
Table65 Middle East & Africa 3D Printed Medical Devices Market Analysis, Revenue & Volume,By Application, 2021-2026 ($)
Table66 Russia 3D Printed Medical Devices Market Analysis, Revenue & Volume,By Component, 2021-2026 ($)
Table67 Russia 3D Printed Medical Devices Market Analysis, Revenue & Volume,By Products, 2021-2026 ($)
Table68 Russia 3D Printed Medical Devices Market Analysis, Revenue & Volume,By Technology, 2021-2026 ($)
Table69 Russia 3D Printed Medical Devices Market Analysis, Revenue & Volume,By Application, 2021-2026 ($)
Table70 Israel 3D Printed Medical Devices Market Analysis, Revenue & Volume,By Component, 2021-2026 ($)
Table71 Israel 3D Printed Medical Devices Market Analysis, Revenue & Volume,By Products, 2021-2026 ($)
Table72 Israel 3D Printed Medical Devices Market Analysis, Revenue & Volume,By Technology, 2021-2026 ($)
Table73 Israel 3D Printed Medical Devices Market Analysis, Revenue & Volume,By Application, 2021-2026 ($)
Table74 Top Companies 2018 (US$)3D Printed Medical Devices Market Analysis, Revenue & Volume,,
Table75 Product Launch 2018-20193D Printed Medical Devices Market Analysis, Revenue & Volume,,
Table76 Mergers & Acquistions 2018-20193D Printed Medical Devices Market Analysis, Revenue & Volume,,
List of Figures
Figure 1 Overview of 3D Printed Medical Devices Market Analysis 2021-2026
Figure 2 Market Share Analysis for 3D Printed Medical Devices Market Analysis 2018 (US$)
Figure 3 Product Comparison in 3D Printed Medical Devices Market Analysis 2018-2019 (US$)
Figure 4 End User Profile for 3D Printed Medical Devices Market Analysis 2018-2019 (US$)
Figure 5 Patent Application and Grant in 3D Printed Medical Devices Market Analysis 2013-2018* (US$)
Figure 6 Top 5 Companies Financial Analysis in 3D Printed Medical Devices Market Analysis 2018-2019 (US$)
Figure 7 Market Entry Strategy in 3D Printed Medical Devices Market Analysis 2018-2019
Figure 8 Ecosystem Analysis in 3D Printed Medical Devices Market Analysis2018
Figure 9 Average Selling Price in 3D Printed Medical Devices Market Analysis 2021-2026
Figure 10 Top Opportunites in 3D Printed Medical Devices Market Analysis 2018-2019
Figure 11 Market Life Cycle Analysis in 3D Printed Medical Devices Market Analysis
Figure 12 GlobalBy Component3D Printed Medical Devices Market Analysis Revenue, 2021-2026 ($)
Figure 13 GlobalBy Products3D Printed Medical Devices Market Analysis Revenue, 2021-2026 ($)
Figure 14 GlobalBy Technology3D Printed Medical Devices Market Analysis Revenue, 2021-2026 ($)
Figure 15 GlobalBy Application3D Printed Medical Devices Market Analysis Revenue, 2021-2026 ($)
Figure 16 GlobalBy End Use3D Printed Medical Devices Market Analysis Revenue, 2021-2026 ($)
Figure 17 Global 3D Printed Medical Devices Market Analysis - By Geography
Figure 18 Global 3D Printed Medical Devices Market Analysis Value & Volume, By Geography, 2021-2026 ($)
Figure 19 Global 3D Printed Medical Devices Market Analysis CAGR, By Geography, 2021-2026 (%)
Figure 20 North America 3D Printed Medical Devices Market Analysis Value & Volume, 2021-2026 ($)
Figure 21 US 3D Printed Medical Devices Market Analysis Value & Volume, 2021-2026 ($)
Figure 22 US GDP and Population, 2018-2019 ($)
Figure 23 US GDP – Composition of 2018, By Sector of Origin
Figure 24 US Export and Import Value & Volume, 2018-2019 ($)
Figure 25 Canada 3D Printed Medical Devices Market Analysis Value & Volume, 2021-2026 ($)
Figure 26 Canada GDP and Population, 2018-2019 ($)
Figure 27 Canada GDP – Composition of 2018, By Sector of Origin
Figure 28 Canada Export and Import Value & Volume, 2018-2019 ($)
Figure 29 Mexico 3D Printed Medical Devices Market Analysis Value & Volume, 2021-2026 ($)
Figure 30 Mexico GDP and Population, 2018-2019 ($)
Figure 31 Mexico GDP – Composition of 2018, By Sector of Origin
Figure 32 Mexico Export and Import Value & Volume, 2018-2019 ($)
Figure 33 South America 3D Printed Medical Devices Market AnalysisSouth America 3D Printing Market Value & Volume, 2021-2026 ($)
Figure 34 Brazil 3D Printed Medical Devices Market Analysis Value & Volume, 2021-2026 ($)
Figure 35 Brazil GDP and Population, 2018-2019 ($)
Figure 36 Brazil GDP – Composition of 2018, By Sector of Origin
Figure 37 Brazil Export and Import Value & Volume, 2018-2019 ($)
Figure 38 Venezuela 3D Printed Medical Devices Market Analysis Value & Volume, 2021-2026 ($)
Figure 39 Venezuela GDP and Population, 2018-2019 ($)
Figure 40 Venezuela GDP – Composition of 2018, By Sector of Origin
Figure 41 Venezuela Export and Import Value & Volume, 2018-2019 ($)
Figure 42 Argentina 3D Printed Medical Devices Market Analysis Value & Volume, 2021-2026 ($)
Figure 43 Argentina GDP and Population, 2018-2019 ($)
Figure 44 Argentina GDP – Composition of 2018, By Sector of Origin
Figure 45 Argentina Export and Import Value & Volume, 2018-2019 ($)
Figure 46 Ecuador 3D Printed Medical Devices Market Analysis Value & Volume, 2021-2026 ($)
Figure 47 Ecuador GDP and Population, 2018-2019 ($)
Figure 48 Ecuador GDP – Composition of 2018, By Sector of Origin
Figure 49 Ecuador Export and Import Value & Volume, 2018-2019 ($)
Figure 50 Peru 3D Printed Medical Devices Market Analysis Value & Volume, 2021-2026 ($)
Figure 51 Peru GDP and Population, 2018-2019 ($)
Figure 52 Peru GDP – Composition of 2018, By Sector of Origin
Figure 53 Peru Export and Import Value & Volume, 2018-2019 ($)
Figure 54 Colombia 3D Printed Medical Devices Market Analysis Value & Volume, 2021-2026 ($)
Figure 55 Colombia GDP and Population, 2018-2019 ($)
Figure 56 Colombia GDP – Composition of 2018, By Sector of Origin
Figure 57 Colombia Export and Import Value & Volume, 2018-2019 ($)
Figure 58 Costa Rica 3D Printed Medical Devices Market AnalysisCosta Rica 3D Printing Market Value & Volume, 2021-2026 ($)
Figure 59 Costa Rica GDP and Population, 2018-2019 ($)
Figure 60 Costa Rica GDP – Composition of 2018, By Sector of Origin
Figure 61 Costa Rica Export and Import Value & Volume, 2018-2019 ($)
Figure 62 Europe 3D Printed Medical Devices Market Analysis Value & Volume, 2021-2026 ($)
Figure 63 U.K 3D Printed Medical Devices Market Analysis Value & Volume, 2021-2026 ($)
Figure 64 U.K GDP and Population, 2018-2019 ($)
Figure 65 U.K GDP – Composition of 2018, By Sector of Origin
Figure 66 U.K Export and Import Value & Volume, 2018-2019 ($)
Figure 67 Germany 3D Printed Medical Devices Market Analysis Value & Volume, 2021-2026 ($)
Figure 68 Germany GDP and Population, 2018-2019 ($)
Figure 69 Germany GDP – Composition of 2018, By Sector of Origin
Figure 70 Germany Export and Import Value & Volume, 2018-2019 ($)
Figure 71 Italy 3D Printed Medical Devices Market Analysis Value & Volume, 2021-2026 ($)
Figure 72 Italy GDP and Population, 2018-2019 ($)
Figure 73 Italy GDP – Composition of 2018, By Sector of Origin
Figure 74 Italy Export and Import Value & Volume, 2018-2019 ($)
Figure 75 France 3D Printed Medical Devices Market Analysis Value & Volume, 2021-2026 ($)
Figure 76 France GDP and Population, 2018-2019 ($)
Figure 77 France GDP – Composition of 2018, By Sector of Origin
Figure 78 France Export and Import Value & Volume, 2018-2019 ($)
Figure 79 Netherlands 3D Printed Medical Devices Market Analysis Value & Volume, 2021-2026 ($)
Figure 80 Netherlands GDP and Population, 2018-2019 ($)
Figure 81 Netherlands GDP – Composition of 2018, By Sector of Origin
Figure 82 Netherlands Export and Import Value & Volume, 2018-2019 ($)
Figure 83 Belgium 3D Printed Medical Devices Market Analysis Value & Volume, 2021-2026 ($)
Figure 84 Belgium GDP and Population, 2018-2019 ($)
Figure 85 Belgium GDP – Composition of 2018, By Sector of Origin
Figure 86 Belgium Export and Import Value & Volume, 2018-2019 ($)
Figure 87 Spain 3D Printed Medical Devices Market Analysis Value & Volume, 2021-2026 ($)
Figure 88 Spain GDP and Population, 2018-2019 ($)
Figure 89 Spain GDP – Composition of 2018, By Sector of Origin
Figure 90 Spain Export and Import Value & Volume, 2018-2019 ($)
Figure 91 Denmark 3D Printed Medical Devices Market Analysis Value & Volume, 2021-2026 ($)
Figure 92 Denmark GDP and Population, 2018-2019 ($)
Figure 93 Denmark GDP – Composition of 2018, By Sector of Origin
Figure 94 Denmark Export and Import Value & Volume, 2018-2019 ($)
Figure 95 APAC 3D Printed Medical Devices Market Analysis Value & Volume, 2021-2026 ($)
Figure 96 China 3D Printed Medical Devices Market AnalysisValue & Volume, 2021-2026
Figure 97 China GDP and Population, 2018-2019 ($)
Figure 98 China GDP – Composition of 2018, By Sector of Origin
Figure 99 China Export and Import Value & Volume, 2018-2019 ($)3D Printed Medical Devices Market AnalysisChina Export and Import Value & Volume, 2018-2019 ($)
Figure 100 Australia 3D Printed Medical Devices Market Analysis Value & Volume, 2021-2026 ($)
Figure 101 Australia GDP and Population, 2018-2019 ($)
Figure 102 Australia GDP – Composition of 2018, By Sector of Origin
Figure 103 Australia Export and Import Value & Volume, 2018-2019 ($)
Figure 104 South Korea 3D Printed Medical Devices Market Analysis Value & Volume, 2021-2026 ($)
Figure 105 South Korea GDP and Population, 2018-2019 ($)
Figure 106 South Korea GDP – Composition of 2018, By Sector of Origin
Figure 107 South Korea Export and Import Value & Volume, 2018-2019 ($)
Figure 108 India 3D Printed Medical Devices Market Analysis Value & Volume, 2021-2026 ($)
Figure 109 India GDP and Population, 2018-2019 ($)
Figure 110 India GDP – Composition of 2018, By Sector of Origin
Figure 111 India Export and Import Value & Volume, 2018-2019 ($)
Figure 112 Taiwan 3D Printed Medical Devices Market AnalysisTaiwan 3D Printing Market Value & Volume, 2021-2026 ($)
Figure 113 Taiwan GDP and Population, 2018-2019 ($)
Figure 114 Taiwan GDP – Composition of 2018, By Sector of Origin
Figure 115 Taiwan Export and Import Value & Volume, 2018-2019 ($)
Figure 116 Malaysia 3D Printed Medical Devices Market AnalysisMalaysia 3D Printing Market Value & Volume, 2021-2026 ($)
Figure 117 Malaysia GDP and Population, 2018-2019 ($)
Figure 118 Malaysia GDP – Composition of 2018, By Sector of Origin
Figure 119 Malaysia Export and Import Value & Volume, 2018-2019 ($)
Figure 120 Hong Kong 3D Printed Medical Devices Market AnalysisHong Kong 3D Printing Market Value & Volume, 2021-2026 ($)
Figure 121 Hong Kong GDP and Population, 2018-2019 ($)
Figure 122 Hong Kong GDP – Composition of 2018, By Sector of Origin
Figure 123 Hong Kong Export and Import Value & Volume, 2018-2019 ($)
Figure 124 Middle East & Africa 3D Printed Medical Devices Market AnalysisMiddle East & Africa 3D Printing Market Value & Volume, 2021-2026 ($)
Figure 125 Russia 3D Printed Medical Devices Market AnalysisRussia 3D Printing Market Value & Volume, 2021-2026 ($)
Figure 126 Russia GDP and Population, 2018-2019 ($)
Figure 127 Russia GDP – Composition of 2018, By Sector of Origin
Figure 128 Russia Export and Import Value & Volume, 2018-2019 ($)
Figure 129 Israel 3D Printed Medical Devices Market Analysis Value & Volume, 2021-2026 ($)
Figure 130 Israel GDP and Population, 2018-2019 ($)
Figure 131 Israel GDP – Composition of 2018, By Sector of Origin
Figure 132 Israel Export and Import Value & Volume, 2018-2019 ($)
Figure 133 Entropy Share, By Strategies, 2018-2019* (%)3D Printed Medical Devices Market Analysis
Figure 134 Developments, 2018-2019*3D Printed Medical Devices Market Analysis
Figure 135 Company 1 3D Printed Medical Devices Market Analysis Net Revenue, By Years, 2018-2019* ($)
Figure 136 Company 1 3D Printed Medical Devices Market Analysis Net Revenue Share, By Business segments, 2018 (%)
Figure 137 Company 1 3D Printed Medical Devices Market Analysis Net Sales Share, By Geography, 2018 (%)
Figure 138 Company 2 3D Printed Medical Devices Market Analysis Net Revenue, By Years, 2018-2019* ($)
Figure 139 Company 2 3D Printed Medical Devices Market Analysis Net Revenue Share, By Business segments, 2018 (%)
Figure 140 Company 2 3D Printed Medical Devices Market Analysis Net Sales Share, By Geography, 2018 (%)
Figure 141 Company 33D Printed Medical Devices Market Analysis Net Revenue, By Years, 2018-2019* ($)
Figure 142 Company 33D Printed Medical Devices Market Analysis Net Revenue Share, By Business segments, 2018 (%)
Figure 143 Company 33D Printed Medical Devices Market Analysis Net Sales Share, By Geography, 2018 (%)
Figure 144 Company 4 3D Printed Medical Devices Market Analysis Net Revenue, By Years, 2018-2019* ($)
Figure 145 Company 4 3D Printed Medical Devices Market Analysis Net Revenue Share, By Business segments, 2018 (%)
Figure 146 Company 4 3D Printed Medical Devices Market Analysis Net Sales Share, By Geography, 2018 (%)
Figure 147 Company 5 3D Printed Medical Devices Market Analysis Net Revenue, By Years, 2018-2019* ($)
Figure 148 Company 5 3D Printed Medical Devices Market Analysis Net Revenue Share, By Business segments, 2018 (%)
Figure 149 Company 5 3D Printed Medical Devices Market Analysis Net Sales Share, By Geography, 2018 (%)
Figure 150 Company 6 3D Printed Medical Devices Market Analysis Net Revenue, By Years, 2018-2019* ($)
Figure 151 Company 6 3D Printed Medical Devices Market Analysis Net Revenue Share, By Business segments, 2018 (%)
Figure 152 Company 6 3D Printed Medical Devices Market Analysis Net Sales Share, By Geography, 2018 (%)
Figure 153 Company 7 3D Printed Medical Devices Market Analysis Net Revenue, By Years, 2018-2019* ($)
Figure 154 Company 7 3D Printed Medical Devices Market Analysis Net Revenue Share, By Business segments, 2018 (%)
Figure 155 Company 7 3D Printed Medical Devices Market Analysis Net Sales Share, By Geography, 2018 (%)
Figure 156 Company 8 3D Printed Medical Devices Market Analysis Net Revenue, By Years, 2018-2019* ($)
Figure 157 Company 8 3D Printed Medical Devices Market Analysis Net Revenue Share, By Business segments, 2018 (%)
Figure 158 Company 8 3D Printed Medical Devices Market Analysis Net Sales Share, By Geography, 2018 (%)
Figure 159 Company 9 3D Printed Medical Devices Market Analysis Net Revenue, By Years, 2018-2019* ($)
Figure 160 Company 9 3D Printed Medical Devices Market Analysis Net Revenue Share, By Business segments, 2018 (%)
Figure 161 Company 9 3D Printed Medical Devices Market Analysis Net Sales Share, By Geography, 2018 (%)
Figure 162 Company 10 3D Printed Medical Devices Market Analysis Net Revenue, By Years, 2018-2019* ($)
Figure 163 Company 10 3D Printed Medical Devices Market Analysis Net Revenue Share, By Business segments, 2018 (%)
Figure 164 Company 10 3D Printed Medical Devices Market Analysis Net Sales Share, By Geography, 2018 (%)
Figure 165 Company 11 3D Printed Medical Devices Market Analysis Net Revenue, By Years, 2018-2019* ($)
Figure 166 Company 11 3D Printed Medical Devices Market Analysis Net Revenue Share, By Business segments, 2018 (%)
Figure 167 Company 11 3D Printed Medical Devices Market Analysis Net Sales Share, By Geography, 2018 (%)
Figure 168 Company 12 3D Printed Medical Devices Market Analysis Net Revenue, By Years, 2018-2019* ($)
Figure 169 Company 12 3D Printed Medical Devices Market Analysis Net Revenue Share, By Business segments, 2018 (%)
Figure 170 Company 12 3D Printed Medical Devices Market Analysis Net Sales Share, By Geography, 2018 (%)
Figure 171 Company 133D Printed Medical Devices Market Analysis Net Revenue, By Years, 2018-2019* ($)
Figure 172 Company 133D Printed Medical Devices Market Analysis Net Revenue Share, By Business segments, 2018 (%)
Figure 173 Company 133D Printed Medical Devices Market Analysis Net Sales Share, By Geography, 2018 (%)
Figure 174 Company 14 3D Printed Medical Devices Market Analysis Net Revenue, By Years, 2018-2019* ($)
Figure 175 Company 14 3D Printed Medical Devices Market Analysis Net Revenue Share, By Business segments, 2018 (%)
Figure 176 Company 14 3D Printed Medical Devices Market Analysis Net Sales Share, By Geography, 2018 (%)
Figure 177 Company 15 3D Printed Medical Devices Market Analysis Net Revenue, By Years, 2018-2019* ($)
Figure 178 Company 15 3D Printed Medical Devices Market Analysis Net Revenue Share, By Business segments, 2018 (%)
Figure 179 Company 15 3D Printed Medical Devices Market Analysis Net Sales Share, By Geography, 2018 (%)