 Email
Email Print
Print


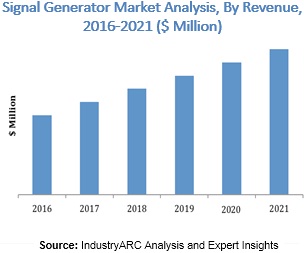
A signal generator is a device which is used to create a number of electronic signals and waveforms. Depending on the application for which the generator is used for, the waveforms and signals can either be created in a repeating or in a non-repeating fashion. A repeating fashion would normally be used for the case of testing wherein the user is trying to check the results of a device by ensuring that a number of factors are constant (hence, the repeating signal) over a period of time. The market for signal generators is primarily driven by the telecommunications segment which has seen a vast number of devices which have been developed over the last decade. The telecommunications sector is ever evolving but more importantly, it is a sector where the absolute figure of end-users is enormous which requires constant monitoring and testing to ensure that everything is working as is. With the advent of numerous telecommunication technologies, the need for signal generators have further increased as a result of the required testing and development processes.
As a result of the telecommunications sector being the largest contributor to the signal generator market, North America is the leading contributor to the market in terms of geographical contribution. Following this, the electronics manufacturing industry is the next leading contributor to the signal generator market. As such, the APAC region is the global hub for electronics manufacturing and is a key contributor to the signal generator market.
The Signal Generator market can be segmented on the basis of technology 2G, GSM, CDMA, 3G, WDCMA, CDMA2000, 5G, 4G, 3GPP LTE and WiMax. In terms of products, the Signal Generator market has been segmented across the following Arbitary Waveform Generator, Rf Generator, Microwave Generator, Video Signal Generator, Audio Signal Generator, Pitch Generator, Analog Function Generator, Digital Function Generator and Sweep Function Generator. In terms of application, the Signal Generator market has been segmented across the following Design, Testing, Certification, Manufacturing, Trouble Shooting and Repair.
In terms of end-users, the Signal Generator market has been segmented across the following Telecommunication, Electronics Manufacturing, Industrial, Aerospace & Defense, Automotive , Education and Medical Design and Others. The market has been segmented based on the following geographies North America, South America, APAC, Europe, Middle East and Africa.
Following are just a few of the companies that are operating in the signal generator market:
- Anritsu Corporation
- B&K Precision Corporation
- Keithley Instruments Inc.
- Keysight Technologies Inc.
- Leader Electronics Corp
1. Signal Generator – Market Overview
2. Executive Summary
3. Signal Generator – Market Landscape
3.1. Market Share Analysis
3.2. Comparative Analysis
3.2.1. Product Benchmarking
3.2.2. End User Profiling
3.2.3. Top 5 Financials Analysis
4. Signal Generator – Market Forces
4.1. Market Drivers
4.2. Market Constraints
4.3. Market Challenges
4.4. Attractiveness of the Signal Generator Market
4.4.1. Power of Suppliers
4.4.2. Power of Customers
4.4.3. Threat of New Entrants
4.4.4. Threat of Substitution
4.4.5. Degree of Competition
5. Signal Generator Market – Strategic Analysis
5.1. Value Chain Analysis
5.2. Pricing Analysis
5.3. Opportunities Analysis
5.4. Product/Market Life Cycle Analysis
5.5. Suppliers and Distributors
6. Signal Generator Market– By Technology
6.1. 2G
6.2. GSM
6.3. CDMA
6.4. 3G
6.5. WDCMA
6.6. CDMA2000
6.7. 5G
6.8. 4G
6.9. 3GPP LTE
6.10. WiMax
7. Signal Generator Market– By Product
7.1. Arbitrary Waveform Generator
7.2. RF Generator
7.3. Microwave Generator
7.4. Video Signal Generator
7.5. Audio Signal Generator
7.6. Pitch Generator
7.7. Analog Function Generator
7.8. Digital Function Generator
7.9. Sweep Function Generator
8. Signal Generator Market– By Application
8.1. Design
8.2. Testing
8.3. Certification
8.4. Manufacturing
8.5. Trouble Shooting and Repair
9. Signal Generator Market– By End-user
9.1. Telecommunication
9.2. Electronics Manufacturing
9.3. Industrial
9.4. Aerospace & Defense
9.5. Automotive
9.6. Education
9.7. Medical Design
9.8. Others
10. Signal Generator Market– By Geography
10.1. Introduction
10.2. Global Study
10.3. Americas
10.3.1. North America
10.3.2. Brazil
10.3.3. Argentina
10.3.4. Others
10.4. Europe
10.4.1. U.K.
10.4.2. France
10.4.3. Germany
10.4.4. Others
10.5. APAC
10.5.1. China
10.5.2. Japan
10.5.3. India
10.5.4. Others
10.6. ROW
11. Signal Generator Market Entropy
11.1. New Product Launches
11.2. M&As, Collaborations, JVs and Partnerships
12. Company Profiles
"*Financials would be provided on a best efforts basis for private companies"
13. Appendix
13.1. Abbreviations
13.2. Sources
13.3. Research Methodology
13.4. Bibliography
13.5. Compilation of Expert Insights
13.6. Disclaimer
2. Executive Summary
3. Signal Generator – Market Landscape
3.1. Market Share Analysis
3.2. Comparative Analysis
3.2.1. Product Benchmarking
3.2.2. End User Profiling
3.2.3. Top 5 Financials Analysis
4. Signal Generator – Market Forces
4.1. Market Drivers
4.2. Market Constraints
4.3. Market Challenges
4.4. Attractiveness of the Signal Generator Market
4.4.1. Power of Suppliers
4.4.2. Power of Customers
4.4.3. Threat of New Entrants
4.4.4. Threat of Substitution
4.4.5. Degree of Competition
5. Signal Generator Market – Strategic Analysis
5.1. Value Chain Analysis
5.2. Pricing Analysis
5.3. Opportunities Analysis
5.4. Product/Market Life Cycle Analysis
5.5. Suppliers and Distributors
6. Signal Generator Market– By Technology
6.1. 2G
6.2. GSM
6.3. CDMA
6.4. 3G
6.5. WDCMA
6.6. CDMA2000
6.7. 5G
6.8. 4G
6.9. 3GPP LTE
6.10. WiMax
7. Signal Generator Market– By Product
7.1. Arbitrary Waveform Generator
7.2. RF Generator
7.3. Microwave Generator
7.4. Video Signal Generator
7.5. Audio Signal Generator
7.6. Pitch Generator
7.7. Analog Function Generator
7.8. Digital Function Generator
7.9. Sweep Function Generator
8. Signal Generator Market– By Application
8.1. Design
8.2. Testing
8.3. Certification
8.4. Manufacturing
8.5. Trouble Shooting and Repair
9. Signal Generator Market– By End-user
9.1. Telecommunication
9.2. Electronics Manufacturing
9.3. Industrial
9.4. Aerospace & Defense
9.5. Automotive
9.6. Education
9.7. Medical Design
9.8. Others
10. Signal Generator Market– By Geography
10.1. Introduction
10.2. Global Study
10.3. Americas
10.3.1. North America
10.3.2. Brazil
10.3.3. Argentina
10.3.4. Others
10.4. Europe
10.4.1. U.K.
10.4.2. France
10.4.3. Germany
10.4.4. Others
10.5. APAC
10.5.1. China
10.5.2. Japan
10.5.3. India
10.5.4. Others
10.6. ROW
11. Signal Generator Market Entropy
11.1. New Product Launches
11.2. M&As, Collaborations, JVs and Partnerships
12. Company Profiles
12.1. Company 1
12.2. Company 2
12.3. Company 3
12.4. Company 4
12.5. Company 5
12.6. Company 6
12.7. Company 7
12.8. Company 8
12.9. Company 9
12.10. Company 10
*More than 40 Companies are profiled in this Research Report, Complete List available on Request*"*Financials would be provided on a best efforts basis for private companies"
13. Appendix
13.1. Abbreviations
13.2. Sources
13.3. Research Methodology
13.4. Bibliography
13.5. Compilation of Expert Insights
13.6. Disclaimer
List of Tables
Table 1 Signal Generator Market Overview 2021-2026
Table 2 Signal Generator Market Leader Analysis 2018-2019 (US$)
Table 3 Signal Generator Market Product Analysis 2018-2019 (US$)
Table 4 Signal Generator Market End User Analysis 2018-2019 (US$)
Table 5 Signal Generator Market Patent Analysis 2013-2018* (US$)
Table 6 Signal Generator Market Financial Analysis 2018-2019 (US$)
Table 7 Signal Generator Market Driver Analysis 2018-2019 (US$)
Table 8 Signal Generator Market Challenges Analysis 2018-2019 (US$)
Table 9 Signal Generator Market Constraint Analysis 2018-2019 (US$)
Table 10 Signal Generator Market Supplier Bargaining Power Analysis 2018-2019 (US$)
Table 11 Signal Generator Market Buyer Bargaining Power Analysis 2018-2019 (US$)
Table 12 Signal Generator Market Threat of Substitutes Analysis 2018-2019 (US$)
Table 13 Signal Generator Market Threat of New Entrants Analysis 2018-2019 (US$)
Table 14 Signal Generator Market Degree of Competition Analysis 2018-2019 (US$)
Table 15 Signal Generator Market Value Chain Analysis 2018-2019 (US$)
Table 16 Signal Generator Market Pricing Analysis 2021-2026 (US$)
Table 17 Signal Generator Market Opportunities Analysis 2021-2026 (US$)
Table 18 Signal Generator Market Product Life Cycle Analysis 2021-2026 (US$)
Table 19 Signal Generator Market Supplier Analysis 2018-2019 (US$)
Table 20 Signal Generator Market Distributor Analysis 2018-2019 (US$)
Table 21 Signal Generator Market Trend Analysis 2018-2019 (US$)
Table 22 Signal Generator Market Size 2018 (US$)
Table 23 Signal Generator Market Forecast Analysis 2021-2026 (US$)
Table 24 Signal Generator Market Sales Forecast Analysis 2021-2026 (Units)
Table 25 Signal Generator Market , Revenue & Volume,By Product, 2021-2026 ($)
Table 26 Signal Generator Market By Product, Revenue & Volume,By Arbitrary Waveform Generator, 2021-2026 ($)
Table 27 Signal Generator Market By Product, Revenue & Volume,By RF Generator, 2021-2026 ($)
Table 28 Signal Generator Market By Product, Revenue & Volume,By Microwave Generator, 2021-2026 ($)
Table 29 Signal Generator Market By Product, Revenue & Volume,By Video Signal Generator, 2021-2026 ($)
Table 30 Signal Generator Market , Revenue & Volume,By Technology, 2021-2026 ($)
Table 31 Signal Generator Market By Technology, Revenue & Volume,By 2G, 2021-2026 ($)
Table 32 Signal Generator Market By Technology, Revenue & Volume,By GSM, 2021-2026 ($)
Table 33 Signal Generator Market By Technology, Revenue & Volume,By CDMA, 2021-2026 ($)
Table 34 Signal Generator Market By Technology, Revenue & Volume,By 3G, 2021-2026 ($)
Table 35 Signal Generator Market By Technology, Revenue & Volume,By WDCMA, 2021-2026 ($)
Table 36 Signal Generator Market , Revenue & Volume,By Application, 2021-2026 ($)
Table 37 Signal Generator Market By Application, Revenue & Volume,By Design, 2021-2026 ($)
Table 38 Signal Generator Market By Application, Revenue & Volume,By Testing, 2021-2026 ($)
Table 39 Signal Generator Market By Application, Revenue & Volume,By Certification, 2021-2026 ($)
Table 40 Signal Generator Market By Application, Revenue & Volume,By Manufacturing, 2021-2026 ($)
Table 41 Signal Generator Market By Application, Revenue & Volume,By Trouble Shooting and Repair, 2021-2026 ($)
Table 42 Signal Generator Market , Revenue & Volume,By End Use, 2021-2026 ($)
Table 43 Signal Generator Market By End Use, Revenue & Volume,By Telecommunication, 2021-2026 ($)
Table 44 Signal Generator Market By End Use, Revenue & Volume,By Electronics Manufacturing, 2021-2026 ($)
Table 45 Signal Generator Market By End Use, Revenue & Volume,By Industrial, 2021-2026 ($)
Table 46 Signal Generator Market By End Use, Revenue & Volume,By Aerospace & Defense, 2021-2026 ($)
Table 47 Signal Generator Market By End Use, Revenue & Volume,By Automotive, 2021-2026 ($)
Table 48 North America Signal Generator Market , Revenue & Volume,By Product, 2021-2026 ($)
Table 49 North America Signal Generator Market , Revenue & Volume,By Technology, 2021-2026 ($)
Table 50 North America Signal Generator Market , Revenue & Volume,By Application, 2021-2026 ($)
Table 51 North America Signal Generator Market , Revenue & Volume,By End Use, 2021-2026 ($)
Table 52 South america Signal Generator Market , Revenue & Volume,By Product, 2021-2026 ($)
Table 53 South america Signal Generator Market , Revenue & Volume,By Technology, 2021-2026 ($)
Table 54 South america Signal Generator Market , Revenue & Volume,By Application, 2021-2026 ($)
Table 55 South america Signal Generator Market , Revenue & Volume,By End Use, 2021-2026 ($)
Table 56 Europe Signal Generator Market , Revenue & Volume,By Product, 2021-2026 ($)
Table 57 Europe Signal Generator Market , Revenue & Volume,By Technology, 2021-2026 ($)
Table 58 Europe Signal Generator Market , Revenue & Volume,By Application, 2021-2026 ($)
Table 59 Europe Signal Generator Market , Revenue & Volume,By End Use, 2021-2026 ($)
Table 60 APAC Signal Generator Market , Revenue & Volume,By Product, 2021-2026 ($)
Table 61 APAC Signal Generator Market , Revenue & Volume,By Technology, 2021-2026 ($)
Table 62 APAC Signal Generator Market , Revenue & Volume,By Application, 2021-2026 ($)
Table 63 APAC Signal Generator Market , Revenue & Volume,By End Use, 2021-2026 ($)
Table 64 Middle East & Africa Signal Generator Market , Revenue & Volume,By Product, 2021-2026 ($)
Table 65 Middle East & Africa Signal Generator Market , Revenue & Volume,By Technology, 2021-2026 ($)
Table 66 Middle East & Africa Signal Generator Market , Revenue & Volume,By Application, 2021-2026 ($)
Table 67 Middle East & Africa Signal Generator Market , Revenue & Volume,By End Use, 2021-2026 ($)
Table 68 Russia Signal Generator Market , Revenue & Volume,By Product, 2021-2026 ($)
Table 69 Russia Signal Generator Market , Revenue & Volume,By Technology, 2021-2026 ($)
Table 70 Russia Signal Generator Market , Revenue & Volume,By Application, 2021-2026 ($)
Table 71 Russia Signal Generator Market , Revenue & Volume,By End Use, 2021-2026 ($)
Table 72 Israel Signal Generator Market , Revenue & Volume,By Product, 2021-2026 ($)
Table 73 Israel Signal Generator Market , Revenue & Volume,By Technology, 2021-2026 ($)
Table 74 Israel Signal Generator Market , Revenue & Volume,By Application, 2021-2026 ($)
Table 75 Israel Signal Generator Market , Revenue & Volume,By End Use, 2021-2026 ($)
Table 76 Top Companies 2018 (US$)Signal Generator Market , Revenue & Volume,,
Table 77 Product Launch 2018-2019Signal Generator Market , Revenue & Volume,,
Table 78 Mergers & Acquistions 2018-2019Signal Generator Market , Revenue & Volume,,
List of Figures
Figure 1 Overview of Signal Generator Market 2021-2026
Figure 2 Market Share Analysis for Signal Generator Market 2018 (US$)
Figure 3 Product Comparison in Signal Generator Market 2018-2019 (US$)
Figure 4 End User Profile for Signal Generator Market 2018-2019 (US$)
Figure 5 Patent Application and Grant in Signal Generator Market 2013-2018* (US$)
Figure 6 Top 5 Companies Financial Analysis in Signal Generator Market 2018-2019 (US$)
Figure 7 Market Entry Strategy in Signal Generator Market 2018-2019
Figure 8 Ecosystem Analysis in Signal Generator Market 2018
Figure 9 Average Selling Price in Signal Generator Market 2021-2026
Figure 10 Top Opportunites in Signal Generator Market 2018-2019
Figure 11 Market Life Cycle Analysis in Signal Generator Market
Figure 12 GlobalBy ProductSignal Generator Market Revenue, 2021-2026 ($)
Figure 13 GlobalBy TechnologySignal Generator Market Revenue, 2021-2026 ($)
Figure 14 GlobalBy ApplicationSignal Generator Market Revenue, 2021-2026 ($)
Figure 15 GlobalBy End UseSignal Generator Market Revenue, 2021-2026 ($)
Figure 16 Global Signal Generator Market - By Geography
Figure 17 Global Signal Generator Market Value & Volume, By Geography, 2021-2026 ($)
Figure 18 Global Signal Generator Market CAGR, By Geography, 2021-2026 (%)
Figure 19 North America Signal Generator Market Value & Volume, 2021-2026 ($)
Figure 20 US Signal Generator Market Value & Volume, 2021-2026 ($)
Figure 21 US GDP and Population, 2018-2019 ($)
Figure 22 US GDP – Composition of 2018, By Sector of Origin
Figure 23 US Export and Import Value & Volume, 2018-2019 ($)
Figure 24 Canada Signal Generator Market Value & Volume, 2021-2026 ($)
Figure 25 Canada GDP and Population, 2018-2019 ($)
Figure 26 Canada GDP – Composition of 2018, By Sector of Origin
Figure 27 Canada Export and Import Value & Volume, 2018-2019 ($)
Figure 28 Mexico Signal Generator Market Value & Volume, 2021-2026 ($)
Figure 29 Mexico GDP and Population, 2018-2019 ($)
Figure 30 Mexico GDP – Composition of 2018, By Sector of Origin
Figure 31 Mexico Export and Import Value & Volume, 2018-2019 ($)
Figure 32 South America Signal Generator Market South America 3D Printing Market Value & Volume, 2021-2026 ($)
Figure 33 Brazil Signal Generator Market Value & Volume, 2021-2026 ($)
Figure 34 Brazil GDP and Population, 2018-2019 ($)
Figure 35 Brazil GDP – Composition of 2018, By Sector of Origin
Figure 36 Brazil Export and Import Value & Volume, 2018-2019 ($)
Figure 37 Venezuela Signal Generator Market Value & Volume, 2021-2026 ($)
Figure 38 Venezuela GDP and Population, 2018-2019 ($)
Figure 39 Venezuela GDP – Composition of 2018, By Sector of Origin
Figure 40 Venezuela Export and Import Value & Volume, 2018-2019 ($)
Figure 41 Argentina Signal Generator Market Value & Volume, 2021-2026 ($)
Figure 42 Argentina GDP and Population, 2018-2019 ($)
Figure 43 Argentina GDP – Composition of 2018, By Sector of Origin
Figure 44 Argentina Export and Import Value & Volume, 2018-2019 ($)
Figure 45 Ecuador Signal Generator Market Value & Volume, 2021-2026 ($)
Figure 46 Ecuador GDP and Population, 2018-2019 ($)
Figure 47 Ecuador GDP – Composition of 2018, By Sector of Origin
Figure 48 Ecuador Export and Import Value & Volume, 2018-2019 ($)
Figure 49 Peru Signal Generator Market Value & Volume, 2021-2026 ($)
Figure 50 Peru GDP and Population, 2018-2019 ($)
Figure 51 Peru GDP – Composition of 2018, By Sector of Origin
Figure 52 Peru Export and Import Value & Volume, 2018-2019 ($)
Figure 53 Colombia Signal Generator Market Value & Volume, 2021-2026 ($)
Figure 54 Colombia GDP and Population, 2018-2019 ($)
Figure 55 Colombia GDP – Composition of 2018, By Sector of Origin
Figure 56 Colombia Export and Import Value & Volume, 2018-2019 ($)
Figure 57 Costa Rica Signal Generator Market Costa Rica 3D Printing Market Value & Volume, 2021-2026 ($)
Figure 58 Costa Rica GDP and Population, 2018-2019 ($)
Figure 59 Costa Rica GDP – Composition of 2018, By Sector of Origin
Figure 60 Costa Rica Export and Import Value & Volume, 2018-2019 ($)
Figure 61 Europe Signal Generator Market Value & Volume, 2021-2026 ($)
Figure 62 U.K Signal Generator Market Value & Volume, 2021-2026 ($)
Figure 63 U.K GDP and Population, 2018-2019 ($)
Figure 64 U.K GDP – Composition of 2018, By Sector of Origin
Figure 65 U.K Export and Import Value & Volume, 2018-2019 ($)
Figure 66 Germany Signal Generator Market Value & Volume, 2021-2026 ($)
Figure 67 Germany GDP and Population, 2018-2019 ($)
Figure 68 Germany GDP – Composition of 2018, By Sector of Origin
Figure 69 Germany Export and Import Value & Volume, 2018-2019 ($)
Figure 70 Italy Signal Generator Market Value & Volume, 2021-2026 ($)
Figure 71 Italy GDP and Population, 2018-2019 ($)
Figure 72 Italy GDP – Composition of 2018, By Sector of Origin
Figure 73 Italy Export and Import Value & Volume, 2018-2019 ($)
Figure 74 France Signal Generator Market Value & Volume, 2021-2026 ($)
Figure 75 France GDP and Population, 2018-2019 ($)
Figure 76 France GDP – Composition of 2018, By Sector of Origin
Figure 77 France Export and Import Value & Volume, 2018-2019 ($)
Figure 78 Netherlands Signal Generator Market Value & Volume, 2021-2026 ($)
Figure 79 Netherlands GDP and Population, 2018-2019 ($)
Figure 80 Netherlands GDP – Composition of 2018, By Sector of Origin
Figure 81 Netherlands Export and Import Value & Volume, 2018-2019 ($)
Figure 82 Belgium Signal Generator Market Value & Volume, 2021-2026 ($)
Figure 83 Belgium GDP and Population, 2018-2019 ($)
Figure 84 Belgium GDP – Composition of 2018, By Sector of Origin
Figure 85 Belgium Export and Import Value & Volume, 2018-2019 ($)
Figure 86 Spain Signal Generator Market Value & Volume, 2021-2026 ($)
Figure 87 Spain GDP and Population, 2018-2019 ($)
Figure 88 Spain GDP – Composition of 2018, By Sector of Origin
Figure 89 Spain Export and Import Value & Volume, 2018-2019 ($)
Figure 90 Denmark Signal Generator Market Value & Volume, 2021-2026 ($)
Figure 91 Denmark GDP and Population, 2018-2019 ($)
Figure 92 Denmark GDP – Composition of 2018, By Sector of Origin
Figure 93 Denmark Export and Import Value & Volume, 2018-2019 ($)
Figure 94 APAC Signal Generator Market Value & Volume, 2021-2026 ($)
Figure 95 China Signal Generator Market Value & Volume, 2021-2026
Figure 96 China GDP and Population, 2018-2019 ($)
Figure 97 China GDP – Composition of 2018, By Sector of Origin
Figure 98 China Export and Import Value & Volume, 2018-2019 ($)Signal Generator Market China Export and Import Value & Volume, 2018-2019 ($)
Figure 99 Australia Signal Generator Market Value & Volume, 2021-2026 ($)
Figure 100 Australia GDP and Population, 2018-2019 ($)
Figure 101 Australia GDP – Composition of 2018, By Sector of Origin
Figure 102 Australia Export and Import Value & Volume, 2018-2019 ($)
Figure 103 South Korea Signal Generator Market Value & Volume, 2021-2026 ($)
Figure 104 South Korea GDP and Population, 2018-2019 ($)
Figure 105 South Korea GDP – Composition of 2018, By Sector of Origin
Figure 106 South Korea Export and Import Value & Volume, 2018-2019 ($)
Figure 107 India Signal Generator Market Value & Volume, 2021-2026 ($)
Figure 108 India GDP and Population, 2018-2019 ($)
Figure 109 India GDP – Composition of 2018, By Sector of Origin
Figure 110 India Export and Import Value & Volume, 2018-2019 ($)
Figure 111 Taiwan Signal Generator Market Taiwan 3D Printing Market Value & Volume, 2021-2026 ($)
Figure 112 Taiwan GDP and Population, 2018-2019 ($)
Figure 113 Taiwan GDP – Composition of 2018, By Sector of Origin
Figure 114 Taiwan Export and Import Value & Volume, 2018-2019 ($)
Figure 115 Malaysia Signal Generator Market Malaysia 3D Printing Market Value & Volume, 2021-2026 ($)
Figure 116 Malaysia GDP and Population, 2018-2019 ($)
Figure 117 Malaysia GDP – Composition of 2018, By Sector of Origin
Figure 118 Malaysia Export and Import Value & Volume, 2018-2019 ($)
Figure 119 Hong Kong Signal Generator Market Hong Kong 3D Printing Market Value & Volume, 2021-2026 ($)
Figure 120 Hong Kong GDP and Population, 2018-2019 ($)
Figure 121 Hong Kong GDP – Composition of 2018, By Sector of Origin
Figure 122 Hong Kong Export and Import Value & Volume, 2018-2019 ($)
Figure 123 Middle East & Africa Signal Generator Market Middle East & Africa 3D Printing Market Value & Volume, 2021-2026 ($)
Figure 124 Russia Signal Generator Market Russia 3D Printing Market Value & Volume, 2021-2026 ($)
Figure 125 Russia GDP and Population, 2018-2019 ($)
Figure 126 Russia GDP – Composition of 2018, By Sector of Origin
Figure 127 Russia Export and Import Value & Volume, 2018-2019 ($)
Figure 128 Israel Signal Generator Market Value & Volume, 2021-2026 ($)
Figure 129 Israel GDP and Population, 2018-2019 ($)
Figure 130 Israel GDP – Composition of 2018, By Sector of Origin
Figure 131 Israel Export and Import Value & Volume, 2018-2019 ($)
Figure 132 Entropy Share, By Strategies, 2018-2019* (%)Signal Generator Market
Figure 133 Developments, 2018-2019*Signal Generator Market
Figure 134 Company 1 Signal Generator Market Net Revenue, By Years, 2018-2019* ($)
Figure 135 Company 1 Signal Generator Market Net Revenue Share, By Business segments, 2018 (%)
Figure 136 Company 1 Signal Generator Market Net Sales Share, By Geography, 2018 (%)
Figure 137 Company 2 Signal Generator Market Net Revenue, By Years, 2018-2019* ($)
Figure 138 Company 2 Signal Generator Market Net Revenue Share, By Business segments, 2018 (%)
Figure 139 Company 2 Signal Generator Market Net Sales Share, By Geography, 2018 (%)
Figure 140 Company 3Signal Generator Market Net Revenue, By Years, 2018-2019* ($)
Figure 141 Company 3Signal Generator Market Net Revenue Share, By Business segments, 2018 (%)
Figure 142 Company 3Signal Generator Market Net Sales Share, By Geography, 2018 (%)
Figure 143 Company 4 Signal Generator Market Net Revenue, By Years, 2018-2019* ($)
Figure 144 Company 4 Signal Generator Market Net Revenue Share, By Business segments, 2018 (%)
Figure 145 Company 4 Signal Generator Market Net Sales Share, By Geography, 2018 (%)
Figure 146 Company 5 Signal Generator Market Net Revenue, By Years, 2018-2019* ($)
Figure 147 Company 5 Signal Generator Market Net Revenue Share, By Business segments, 2018 (%)
Figure 148 Company 5 Signal Generator Market Net Sales Share, By Geography, 2018 (%)
Figure 149 Company 6 Signal Generator Market Net Revenue, By Years, 2018-2019* ($)
Figure 150 Company 6 Signal Generator Market Net Revenue Share, By Business segments, 2018 (%)
Figure 151 Company 6 Signal Generator Market Net Sales Share, By Geography, 2018 (%)
Figure 152 Company 7 Signal Generator Market Net Revenue, By Years, 2018-2019* ($)
Figure 153 Company 7 Signal Generator Market Net Revenue Share, By Business segments, 2018 (%)
Figure 154 Company 7 Signal Generator Market Net Sales Share, By Geography, 2018 (%)
Figure 155 Company 8 Signal Generator Market Net Revenue, By Years, 2018-2019* ($)
Figure 156 Company 8 Signal Generator Market Net Revenue Share, By Business segments, 2018 (%)
Figure 157 Company 8 Signal Generator Market Net Sales Share, By Geography, 2018 (%)
Figure 158 Company 9 Signal Generator Market Net Revenue, By Years, 2018-2019* ($)
Figure 159 Company 9 Signal Generator Market Net Revenue Share, By Business segments, 2018 (%)
Figure 160 Company 9 Signal Generator Market Net Sales Share, By Geography, 2018 (%)
Figure 161 Company 10 Signal Generator Market Net Revenue, By Years, 2018-2019* ($)
Figure 162 Company 10 Signal Generator Market Net Revenue Share, By Business segments, 2018 (%)
Figure 163 Company 10 Signal Generator Market Net Sales Share, By Geography, 2018 (%)
Figure 164 Company 11 Signal Generator Market Net Revenue, By Years, 2018-2019* ($)
Figure 165 Company 11 Signal Generator Market Net Revenue Share, By Business segments, 2018 (%)
Figure 166 Company 11 Signal Generator Market Net Sales Share, By Geography, 2018 (%)
Figure 167 Company 12 Signal Generator Market Net Revenue, By Years, 2018-2019* ($)
Figure 168 Company 12 Signal Generator Market Net Revenue Share, By Business segments, 2018 (%)
Figure 169 Company 12 Signal Generator Market Net Sales Share, By Geography, 2018 (%)
Figure 170 Company 13Signal Generator Market Net Revenue, By Years, 2018-2019* ($)
Figure 171 Company 13Signal Generator Market Net Revenue Share, By Business segments, 2018 (%)
Figure 172 Company 13Signal Generator Market Net Sales Share, By Geography, 2018 (%)
Figure 173 Company 14 Signal Generator Market Net Revenue, By Years, 2018-2019* ($)
Figure 174 Company 14 Signal Generator Market Net Revenue Share, By Business segments, 2018 (%)
Figure 175 Company 14 Signal Generator Market Net Sales Share, By Geography, 2018 (%)
Figure 176 Company 15 Signal Generator Market Net Revenue, By Years, 2018-2019* ($)
Figure 177 Company 15 Signal Generator Market Net Revenue Share, By Business segments, 2018 (%)
Figure 178 Company 15 Signal Generator Market Net Sales Share, By Geography, 2018 (%)