 Email
Email Print
Print


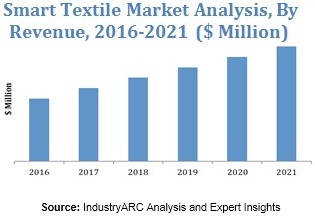
Smart Textile Market Overview:
Smart textiles are fabrics embedded with innovative technologies, which offer additional functionalities to the person wearing it. These textiles monitor every movement of the wearer, provide vital information such as location, body temperature, blood pressure, heart rate; and react to environmental stimuli. Technological advancements, miniaturization of electronic components, increasing development of wireless devices, a wide range of applications across various end user industries, and cost-efficient sensors, are fuelling the growth of the smart textile market. The smart textile market had a global size of $24.37 billion in 2018, and is expected to grow at a CAGR of 4.32% during the forecast period.
North America held the highest share in the global smart textile market with almost 44.3% of total demand in 2018. Owing to the high economic status and standards of living among the people, the demand for innovative clothing trends, high-tech wearables, and high quality fabrics is increasing. Furthermore, increasing disposable incomes, high amounts of investments by private companies and funding from government organizations, and promotional activities, are other factors that have caused North America to hold the highest market share.
Smart Textile Market Growth Drivers:
· Minimization of Electronic Components:
Technological advancements in the electronic sector are paving the way for minimization of electronic components. The reduced size of components such as sensors, controls and batteries, facilitate easy integration of electronics with textiles.
· Increasing trend for sophisticated gadgets:
There is increasing popularity for high-tech gadgets with various advanced technological features such as sensing and reacting to environmental sources including mechanical, electrical, thermal, magnetic, and chemical, among tech-savvy customers. This is aiding smart textiles, which are embedded with the aforementioned technologies, in gaining traction.
· Adoption of Smart Textile in Various Industries:
Smart textiles are also finding application in apparel for medical, sports and fitness purposes. These can be used for tracking information such as body temperature, heat rate, calories, and other health conditions of the person wearing the smart textile. Smart textiles are also used by military forces to transmit critical information to soldiers on the field.
Smart Textile Market Key Players Perspective:
Schoeller Textiles is one of the leading market players in the smart textile market. Recently it merged with Eschler Group, in a bid to increase production and meet the global demand for smart textiles in the coming future.
Other key players of the smart textile market are Google, Textronics, Gentherm, Sensoria, AiQ Smart Clothing, Nanowear, Ohmatex, Vista Medical, and Intelligent Clothing.
Smart Textile Market Trends:
· Introduction of Nanotechnology:
Smart textiles require embedding of electronics into fabrics. Size of the electronic component plays a very vital role in fabrication of such textiles, since the component should be small enough to be implanted in the fabric. With the introduction of nanotechnology, the size of electronics has decreased considerably, which has facilitated increased production of smart textiles.
· Bluetooth Low Energy (BLE) Technology:
Bluetooth low energy technology enables a wireless connection across various electronic devices. The technology has been adapted into wearables to develop connectivity with smartphones. Utilization of the Internet allows for the information sensed to be displayed on smartphones.
Smart Textile Market Research Scope:
The base year of the study is 2018, with forecast done up to 2025. The study presents a thorough analysis of the competitive landscape, taking into account the market shares of the leading companies. It also provides information on unit shipments. These provide the key market participants with the necessary business intelligence and help them understand the future of the smart textile market. The assessment includes the forecast, an overview of the competitive structure, the market shares of the competitors, as well as the market trends, market demands, market drivers, market challenges, and product analysis. The market drivers and restraints have been assessed to fathom their impact over the forecast period. This report further identifies the key opportunities for growth while also detailing the key challenges and possible threats. The key areas of focus include the types of segments in the smart textile market, and their specific applications in different areas.
Smart Textile Market Report: Industry Coverage
The smart textile market can be segmented on the basis of type and application. Based on type, the market can be divided into thermoelectric, sensing, energy harvesting, luminescent, and others. By application, the market can be fragmented into fashion, military, medical, sports and fitness, automotive and others.
The Smart Textile market report also analyzes the major geographic regions for the market as well as the major countries for the market in these regions. The regions and countries covered in the study include:
• North America: The U.S., Canada, Mexico
• South America: Brazil, Venezuela, Argentina, Ecuador, Peru, Colombia, Costa Rica
• Europe: The U.K., Germany, Italy, France, The Netherlands, Belgium, Spain, Denmark
• APAC: China, Japan, Australia, South Korea, India, Taiwan, Malaysia, Hong Kong
• Middle East and Africa: Israel, South Africa, Saudi Arabia
For more Electronics related reports, please
click here
Table 1 Smart Textile Market Overview 2021-2026
Table 2 Smart Textile Market Leader Analysis 2018-2019 (US$)
Table 3 Smart Textile MarketProduct Analysis 2018-2019 (US$)
Table 4 Smart Textile MarketEnd User Analysis 2018-2019 (US$)
Table 5 Smart Textile MarketPatent Analysis 2013-2018* (US$)
Table 6 Smart Textile MarketFinancial Analysis 2018-2019 (US$)
Table 7 Smart Textile Market Driver Analysis 2018-2019 (US$)
Table 8 Smart Textile MarketChallenges Analysis 2018-2019 (US$)
Table 9 Smart Textile MarketConstraint Analysis 2018-2019 (US$)
Table 10 Smart Textile Market Supplier Bargaining Power Analysis 2018-2019 (US$)
Table 11 Smart Textile Market Buyer Bargaining Power Analysis 2018-2019 (US$)
Table 12 Smart Textile Market Threat of Substitutes Analysis 2018-2019 (US$)
Table 13 Smart Textile Market Threat of New Entrants Analysis 2018-2019 (US$)
Table 14 Smart Textile Market Degree of Competition Analysis 2018-2019 (US$)
Table 15 Smart Textile MarketValue Chain Analysis 2018-2019 (US$)
Table 16 Smart Textile MarketPricing Analysis 2021-2026 (US$)
Table 17 Smart Textile MarketOpportunities Analysis 2021-2026 (US$)
Table 18 Smart Textile MarketProduct Life Cycle Analysis 2021-2026 (US$)
Table 19 Smart Textile MarketSupplier Analysis 2018-2019 (US$)
Table 20 Smart Textile MarketDistributor Analysis 2018-2019 (US$)
Table 21 Smart Textile Market Trend Analysis 2018-2019 (US$)
Table 22 Smart Textile Market Size 2018 (US$)
Table 23 Smart Textile Market Forecast Analysis 2021-2026 (US$)
Table 24 Smart Textile Market Sales Forecast Analysis 2021-2026 (Units)
Table 25 Smart Textile Market, Revenue & Volume,By Type, 2021-2026 ($)
Table 26 Smart Textile MarketBy Type, Revenue & Volume,By Thermoelectric, 2021-2026 ($)
Table 27 Smart Textile MarketBy Type, Revenue & Volume,By Sensing, 2021-2026 ($)
Table 28 Smart Textile MarketBy Type, Revenue & Volume,By Energy Harvesting, 2021-2026 ($)
Table 29 Smart Textile MarketBy Type, Revenue & Volume,By Luminescent, 2021-2026 ($)
Table 30 Smart Textile Market, Revenue & Volume,By Application, 2021-2026 ($)
Table 31 Smart Textile MarketBy Application, Revenue & Volume,By Fashion, 2021-2026 ($)
Table 32 Smart Textile MarketBy Application, Revenue & Volume,By Military, 2021-2026 ($)
Table 33 Smart Textile MarketBy Application, Revenue & Volume,By Automotive, 2021-2026 ($)
Table 34 Smart Textile MarketBy Application, Revenue & Volume,By Medical, 2021-2026 ($)
Table 35 Smart Textile MarketBy Application, Revenue & Volume,By Sports and Fitness, 2021-2026 ($)
Table 36 North America Smart Textile Market, Revenue & Volume,By Type, 2021-2026 ($)
Table 37 North America Smart Textile Market, Revenue & Volume,By Application, 2021-2026 ($)
Table 38 South america Smart Textile Market, Revenue & Volume,By Type, 2021-2026 ($)
Table 39 South america Smart Textile Market, Revenue & Volume,By Application, 2021-2026 ($)
Table 40 Europe Smart Textile Market, Revenue & Volume,By Type, 2021-2026 ($)
Table 41 Europe Smart Textile Market, Revenue & Volume,By Application, 2021-2026 ($)
Table 42 APAC Smart Textile Market, Revenue & Volume,By Type, 2021-2026 ($)
Table 43 APAC Smart Textile Market, Revenue & Volume,By Application, 2021-2026 ($)
Table 44 Middle East & Africa Smart Textile Market, Revenue & Volume,By Type, 2021-2026 ($)
Table 45 Middle East & Africa Smart Textile Market, Revenue & Volume,By Application, 2021-2026 ($)
Table 46 Russia Smart Textile Market, Revenue & Volume,By Type, 2021-2026 ($)
Table 47 Russia Smart Textile Market, Revenue & Volume,By Application, 2021-2026 ($)
Table 48 Israel Smart Textile Market, Revenue & Volume,By Type, 2021-2026 ($)
Table 49 Israel Smart Textile Market, Revenue & Volume,By Application, 2021-2026 ($)
Table 50 Top Companies 2018 (US$) Smart Textile Market, Revenue & Volume,,
Table 51 Product Launch 2018-2019 Smart Textile Market, Revenue & Volume,,
Table 52 Mergers & Acquistions 2018-2019 Smart Textile Market, Revenue & Volume,,
List of Figures
Figure 1 Overview of Smart Textile Market 2021-2026
Figure 2 Market Share Analysis for Smart Textile Market 2018 (US$)
Figure 3 Product Comparison in Smart Textile Market 2018-2019 (US$)
Figure 4 End User Profile for Smart Textile Market 2018-2019 (US$)
Figure 5 Patent Application and Grant in Smart Textile Market 2013-2018* (US$)
Figure 6 Top 5 Companies Financial Analysis in Smart Textile Market 2018-2019 (US$)
Figure 7 Market Entry Strategy in Smart Textile Market 2018-2019
Figure 8 Ecosystem Analysis in Smart Textile Market2018
Figure 9 Average Selling Price in Smart Textile Market 2021-2026
Figure 10 Top Opportunites in Smart Textile Market 2018-2019
Figure 11 Market Life Cycle Analysis in Smart Textile Market
Figure 12 GlobalBy Type Smart Textile Market Revenue, 2021-2026 ($)
Figure 13 GlobalBy Application Smart Textile Market Revenue, 2021-2026 ($)
Figure 14 Global Smart Textile Market - By Geography
Figure 15 Global Smart Textile Market Value & Volume, By Geography, 2021-2026 ($)
Figure 16 Global Smart Textile Market CAGR, By Geography, 2021-2026 (%)
Figure 17 North America Smart Textile Market Value & Volume, 2021-2026 ($)
Figure 18 US Smart Textile Market Value & Volume, 2021-2026 ($)
Figure 19 US GDP and Population, 2018-2019 ($)
Figure 20 US GDP – Composition of 2018, By Sector of Origin
Figure 21 US Export and Import Value & Volume, 2018-2019 ($)
Figure 22 Canada Smart Textile Market Value & Volume, 2021-2026 ($)
Figure 23 Canada GDP and Population, 2018-2019 ($)
Figure 24 Canada GDP – Composition of 2018, By Sector of Origin
Figure 25 Canada Export and Import Value & Volume, 2018-2019 ($)
Figure 26 Mexico Smart Textile Market Value & Volume, 2021-2026 ($)
Figure 27 Mexico GDP and Population, 2018-2019 ($)
Figure 28 Mexico GDP – Composition of 2018, By Sector of Origin
Figure 29 Mexico Export and Import Value & Volume, 2018-2019 ($)
Figure 30 South America Smart Textile MarketSouth America 3D Printing Market Value & Volume, 2021-2026 ($)
Figure 31 Brazil Smart Textile Market Value & Volume, 2021-2026 ($)
Figure 32 Brazil GDP and Population, 2018-2019 ($)
Figure 33 Brazil GDP – Composition of 2018, By Sector of Origin
Figure 34 Brazil Export and Import Value & Volume, 2018-2019 ($)
Figure 35 Venezuela Smart Textile Market Value & Volume, 2021-2026 ($)
Figure 36 Venezuela GDP and Population, 2018-2019 ($)
Figure 37 Venezuela GDP – Composition of 2018, By Sector of Origin
Figure 38 Venezuela Export and Import Value & Volume, 2018-2019 ($)
Figure 39 Argentina Smart Textile Market Value & Volume, 2021-2026 ($)
Figure 40 Argentina GDP and Population, 2018-2019 ($)
Figure 41 Argentina GDP – Composition of 2018, By Sector of Origin
Figure 42 Argentina Export and Import Value & Volume, 2018-2019 ($)
Figure 43 Ecuador Smart Textile Market Value & Volume, 2021-2026 ($)
Figure 44 Ecuador GDP and Population, 2018-2019 ($)
Figure 45 Ecuador GDP – Composition of 2018, By Sector of Origin
Figure 46 Ecuador Export and Import Value & Volume, 2018-2019 ($)
Figure 47 Peru Smart Textile Market Value & Volume, 2021-2026 ($)
Figure 48 Peru GDP and Population, 2018-2019 ($)
Figure 49 Peru GDP – Composition of 2018, By Sector of Origin
Figure 50 Peru Export and Import Value & Volume, 2018-2019 ($)
Figure 51 Colombia Smart Textile Market Value & Volume, 2021-2026 ($)
Figure 52 Colombia GDP and Population, 2018-2019 ($)
Figure 53 Colombia GDP – Composition of 2018, By Sector of Origin
Figure 54 Colombia Export and Import Value & Volume, 2018-2019 ($)
Figure 55 Costa Rica Smart Textile MarketCosta Rica 3D Printing Market Value & Volume, 2021-2026 ($)
Figure 56 Costa Rica GDP and Population, 2018-2019 ($)
Figure 57 Costa Rica GDP – Composition of 2018, By Sector of Origin
Figure 58 Costa Rica Export and Import Value & Volume, 2018-2019 ($)
Figure 59 Europe Smart Textile Market Value & Volume, 2021-2026 ($)
Figure 60 U.K Smart Textile Market Value & Volume, 2021-2026 ($)
Figure 61 U.K GDP and Population, 2018-2019 ($)
Figure 62 U.K GDP – Composition of 2018, By Sector of Origin
Figure 63 U.K Export and Import Value & Volume, 2018-2019 ($)
Figure 64 Germany Smart Textile Market Value & Volume, 2021-2026 ($)
Figure 65 Germany GDP and Population, 2018-2019 ($)
Figure 66 Germany GDP – Composition of 2018, By Sector of Origin
Figure 67 Germany Export and Import Value & Volume, 2018-2019 ($)
Figure 68 Italy Smart Textile Market Value & Volume, 2021-2026 ($)
Figure 69 Italy GDP and Population, 2018-2019 ($)
Figure 70 Italy GDP – Composition of 2018, By Sector of Origin
Figure 71 Italy Export and Import Value & Volume, 2018-2019 ($)
Figure 72 France Smart Textile Market Value & Volume, 2021-2026 ($)
Figure 73 France GDP and Population, 2018-2019 ($)
Figure 74 France GDP – Composition of 2018, By Sector of Origin
Figure 75 France Export and Import Value & Volume, 2018-2019 ($)
Figure 76 Netherlands Smart Textile Market Value & Volume, 2021-2026 ($)
Figure 77 Netherlands GDP and Population, 2018-2019 ($)
Figure 78 Netherlands GDP – Composition of 2018, By Sector of Origin
Figure 79 Netherlands Export and Import Value & Volume, 2018-2019 ($)
Figure 80 Belgium Smart Textile Market Value & Volume, 2021-2026 ($)
Figure 81 Belgium GDP and Population, 2018-2019 ($)
Figure 82 Belgium GDP – Composition of 2018, By Sector of Origin
Figure 83 Belgium Export and Import Value & Volume, 2018-2019 ($)
Figure 84 Spain Smart Textile Market Value & Volume, 2021-2026 ($)
Figure 85 Spain GDP and Population, 2018-2019 ($)
Figure 86 Spain GDP – Composition of 2018, By Sector of Origin
Figure 87 Spain Export and Import Value & Volume, 2018-2019 ($)
Figure 88 Denmark Smart Textile Market Value & Volume, 2021-2026 ($)
Figure 89 Denmark GDP and Population, 2018-2019 ($)
Figure 90 Denmark GDP – Composition of 2018, By Sector of Origin
Figure 91 Denmark Export and Import Value & Volume, 2018-2019 ($)
Figure 92 APAC Smart Textile Market Value & Volume, 2021-2026 ($)
Figure 93 China Smart Textile MarketValue & Volume, 2021-2026
Figure 94 China GDP and Population, 2018-2019 ($)
Figure 95 China GDP – Composition of 2018, By Sector of Origin
Figure 96 China Export and Import Value & Volume, 2018-2019 ($) Smart Textile MarketChina Export and Import Value & Volume, 2018-2019 ($)
Figure 97 Australia Smart Textile Market Value & Volume, 2021-2026 ($)
Figure 98 Australia GDP and Population, 2018-2019 ($)
Figure 99 Australia GDP – Composition of 2018, By Sector of Origin
Figure 100 Australia Export and Import Value & Volume, 2018-2019 ($)
Figure 101 South Korea Smart Textile Market Value & Volume, 2021-2026 ($)
Figure 102 South Korea GDP and Population, 2018-2019 ($)
Figure 103 South Korea GDP – Composition of 2018, By Sector of Origin
Figure 104 South Korea Export and Import Value & Volume, 2018-2019 ($)
Figure 105 India Smart Textile Market Value & Volume, 2021-2026 ($)
Figure 106 India GDP and Population, 2018-2019 ($)
Figure 107 India GDP – Composition of 2018, By Sector of Origin
Figure 108 India Export and Import Value & Volume, 2018-2019 ($)
Figure 109 Taiwan Smart Textile MarketTaiwan 3D Printing Market Value & Volume, 2021-2026 ($)
Figure 110 Taiwan GDP and Population, 2018-2019 ($)
Figure 111 Taiwan GDP – Composition of 2018, By Sector of Origin
Figure 112 Taiwan Export and Import Value & Volume, 2018-2019 ($)
Figure 113 Malaysia Smart Textile MarketMalaysia 3D Printing Market Value & Volume, 2021-2026 ($)
Figure 114 Malaysia GDP and Population, 2018-2019 ($)
Figure 115 Malaysia GDP – Composition of 2018, By Sector of Origin
Figure 116 Malaysia Export and Import Value & Volume, 2018-2019 ($)
Figure 117 Hong Kong Smart Textile MarketHong Kong 3D Printing Market Value & Volume, 2021-2026 ($)
Figure 118 Hong Kong GDP and Population, 2018-2019 ($)
Figure 119 Hong Kong GDP – Composition of 2018, By Sector of Origin
Figure 120 Hong Kong Export and Import Value & Volume, 2018-2019 ($)
Figure 121 Middle East & Africa Smart Textile MarketMiddle East & Africa 3D Printing Market Value & Volume, 2021-2026 ($)
Figure 122 Russia Smart Textile MarketRussia 3D Printing Market Value & Volume, 2021-2026 ($)
Figure 123 Russia GDP and Population, 2018-2019 ($)
Figure 124 Russia GDP – Composition of 2018, By Sector of Origin
Figure 125 Russia Export and Import Value & Volume, 2018-2019 ($)
Figure 126 Israel Smart Textile Market Value & Volume, 2021-2026 ($)
Figure 127 Israel GDP and Population, 2018-2019 ($)
Figure 128 Israel GDP – Composition of 2018, By Sector of Origin
Figure 129 Israel Export and Import Value & Volume, 2018-2019 ($)
Figure 130 Entropy Share, By Strategies, 2018-2019* (%) Smart Textile Market
Figure 131 Developments, 2018-2019* Smart Textile Market
Figure 132 Company 1 Smart Textile Market Net Revenue, By Years, 2018-2019* ($)
Figure 133 Company 1 Smart Textile Market Net Revenue Share, By Business segments, 2018 (%)
Figure 134 Company 1 Smart Textile Market Net Sales Share, By Geography, 2018 (%)
Figure 135 Company 2 Smart Textile Market Net Revenue, By Years, 2018-2019* ($)
Figure 136 Company 2 Smart Textile Market Net Revenue Share, By Business segments, 2018 (%)
Figure 137 Company 2 Smart Textile Market Net Sales Share, By Geography, 2018 (%)
Figure 138 Company 3 Smart Textile Market Net Revenue, By Years, 2018-2019* ($)
Figure 139 Company 3 Smart Textile Market Net Revenue Share, By Business segments, 2018 (%)
Figure 140 Company 3 Smart Textile Market Net Sales Share, By Geography, 2018 (%)
Figure 141 Company 4 Smart Textile Market Net Revenue, By Years, 2018-2019* ($)
Figure 142 Company 4 Smart Textile Market Net Revenue Share, By Business segments, 2018 (%)
Figure 143 Company 4 Smart Textile Market Net Sales Share, By Geography, 2018 (%)
Figure 144 Company 5 Smart Textile Market Net Revenue, By Years, 2018-2019* ($)
Figure 145 Company 5 Smart Textile Market Net Revenue Share, By Business segments, 2018 (%)
Figure 146 Company 5 Smart Textile Market Net Sales Share, By Geography, 2018 (%)
Figure 147 Company 6 Smart Textile Market Net Revenue, By Years, 2018-2019* ($)
Figure 148 Company 6 Smart Textile Market Net Revenue Share, By Business segments, 2018 (%)
Figure 149 Company 6 Smart Textile Market Net Sales Share, By Geography, 2018 (%)
Figure 150 Company 7 Smart Textile Market Net Revenue, By Years, 2018-2019* ($)
Figure 151 Company 7 Smart Textile Market Net Revenue Share, By Business segments, 2018 (%)
Figure 152 Company 7 Smart Textile Market Net Sales Share, By Geography, 2018 (%)
Figure 153 Company 8 Smart Textile Market Net Revenue, By Years, 2018-2019* ($)
Figure 154 Company 8 Smart Textile Market Net Revenue Share, By Business segments, 2018 (%)
Figure 155 Company 8 Smart Textile Market Net Sales Share, By Geography, 2018 (%)
Figure 156 Company 9 Smart Textile Market Net Revenue, By Years, 2018-2019* ($)
Figure 157 Company 9 Smart Textile Market Net Revenue Share, By Business segments, 2018 (%)
Figure 158 Company 9 Smart Textile Market Net Sales Share, By Geography, 2018 (%)
Figure 159 Company 10 Smart Textile Market Net Revenue, By Years, 2018-2019* ($)
Figure 160 Company 10 Smart Textile Market Net Revenue Share, By Business segments, 2018 (%)
Figure 161 Company 10 Smart Textile Market Net Sales Share, By Geography, 2018 (%)
Figure 162 Company 11 Smart Textile Market Net Revenue, By Years, 2018-2019* ($)
Figure 163 Company 11 Smart Textile Market Net Revenue Share, By Business segments, 2018 (%)
Figure 164 Company 11 Smart Textile Market Net Sales Share, By Geography, 2018 (%)
Figure 165 Company 12 Smart Textile Market Net Revenue, By Years, 2018-2019* ($)
Figure 166 Company 12 Smart Textile Market Net Revenue Share, By Business segments, 2018 (%)
Figure 167 Company 12 Smart Textile Market Net Sales Share, By Geography, 2018 (%)
Figure 168 Company 13 Smart Textile Market Net Revenue, By Years, 2018-2019* ($)
Figure 169 Company 13 Smart Textile Market Net Revenue Share, By Business segments, 2018 (%)
Figure 170 Company 13 Smart Textile Market Net Sales Share, By Geography, 2018 (%)
Figure 171 Company 14 Smart Textile Market Net Revenue, By Years, 2018-2019* ($)
Figure 172 Company 14 Smart Textile Market Net Revenue Share, By Business segments, 2018 (%)
Figure 173 Company 14 Smart Textile Market Net Sales Share, By Geography, 2018 (%)
Figure 174 Company 15 Smart Textile Market Net Revenue, By Years, 2018-2019* ($)
Figure 175 Company 15 Smart Textile Market Net Revenue Share, By Business segments, 2018 (%)
Figure 176 Company 15 Smart Textile Market Net Sales Share, By Geography, 2018 (%)