 Email
Email Print
Print


Advanced Ceramics Market Overview
The Advanced Ceramics Market size is estimated to reach US$35 billion by 2027, after growing at a CAGR of 7% during the forecast period 2022-2027. Advanced ceramics are manufactured using processes which are required substance to develop the characteristics' special properties. Advanced ceramic depicts superior properties compared to traditional ceramics as these are manufactured using a new material science approach. The major types of material available in advanced ceramic are alumina, zirconia, ferrite and aluminum nitride among others. These materials offer superior performance and are considered viable alternatives to materials such as metals, glass and plastics. Compared to traditional ceramics, advanced ceramics are very strong and can bear high heat, thus, can be used in several end-use industries. According to the data provided by the European Automobile Manufacturer’s Association, in 2021, global automotive production stood at 79.1 million units, showing a 1.3% increase in comparison to 2020. Thus, growth in automotive production is fueling the market growth.
Report Coverage
The “Advanced Ceramics Market Report – Forecast (2022-2027)” by IndustryARC, covers an in-depth analysis of the following segments in the Advanced Ceramics industry.
By Material: Alumina, Titanate, Zirconia, Ferrite, Aluminum Nitride, Silicon Carbide, Silicon Nitride and Others.
By Product: Monolithic Ceramics, Ceramic Matrix Composites, Ceramic Coatings, Ceramic Filters and Others.
By Application: Electrical Equipment, Wear Parts, Engine Parts, Filters, Armor, Furnace Tube, Brake Calipers, Cutting Tools and Others.
By End-use Industry: Electrical & Electronics (Chip Manufacturing, Capacitor Ceramics, Piezoelectric Ceramics, Electronic Devices, Circuit Carriers and Others), Automotive (Passenger Cars, Light Commercial Vehicle and Heavy Commercial Vehicle), Machinery and Metal Processing, Medical, Chemical, Aerospace (Commercial Aviation, Military Aviation and General Aviation), Biotechnology, Energy and Power (Wind Turbines, Photovoltaic Systems and Piezo-ceramic Sensors) and Others.
By Geography: North America (the USA, Canada and Mexico), Europe (UK, Germany, France, Italy, Netherlands, Spain, Russia, Belgium and the Rest of Europe), Asia-Pacific (China, Japan, India, South Korea, Australia and New Zealand, Indonesia, Taiwan, Malaysia and Rest of APAC), South America (Brazil, Argentina, Colombia, Chile and Rest of South America), Rest of the World (the Middle East and Africa).
Key Takeaways
- The significant increase in demand for alumina owing to its superior electrical and mechanical properties is expected to provide a significant growth opportunity to increase the Advanced Ceramics market size in coming years.
- The surge in production of automotive is driving the growth of the Advanced Ceramics market. For instance, according to the International Organization of Motor Vehicle Manufacturers, in 2021, China’s automotive production increased by 3% whereas India showed a 30% increase.
- Global increase in electrical and electronics industry is providing ample growth opportunities for the industry players in near future in the Advanced Ceramics industry.
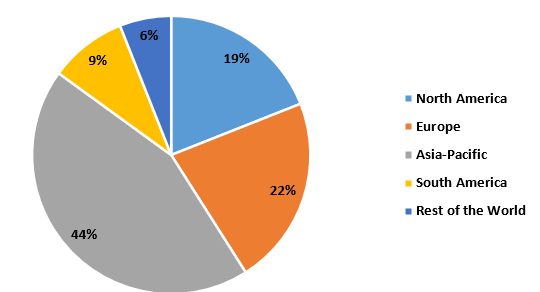
Figure: Advanced Ceramics Market Revenue Share, By Geography, 2021 (%)
For More Details on This Report - Request for Sample
Advanced Ceramics Market Segment Analysis – by Material
The alumina segment is expected to grow at the fastest CAGR of 7.9% during the forecast period in the Advanced Ceramics Market. The demand for advanced ceramics is growing during the past few years owing to surging adoption in novel application and the need for cost reduction with improved operations. There are several ceramic materials available in the market such as alumina, zirconia, ferrite and aluminum nitride among others. Alumina offers several beneficial properties such as superior electrical and mechanical properties and can be used in laser devices, flow meters, X-ray tubes, pressure sensors and aerospace devices among others. It also owns the properties such as better resistance to wear, strength and stiffness and high hardness. Thus, several benefits associated with the use of alumina is boosting the growth and is expected to account for significantly advanced ceramics market share.
Advanced Ceramics Market Segment Analysis – by End-use Industry
The electrical and electronics segment held the largest Advanced Ceramics Market share in 2021, with a share of over 21%. Advanced ceramics are utilized owing to their insulation, magnetism, conduction and permeability and these are manufactured with the help of specialized processes using high purity compounds. These are extensively used in the electrical and electronics industry for several applications such as semiconductors, high-frequency signal transmission and LED substrate fabrication. Advanced ceramics comprises electrical, magnetic, insulation and thermal properties which makes them suitable for electrical applications. According to the India Brand Equity Foundation (IBEF), the electronics manufacturing industry in India is projected to reach US$520 billion by the year 2025. Thus, the increased adoption in the electrical and electronics industry is boosting the market growth of the Advanced Ceramics market.
Advanced Ceramics Market Segment Analysis – by Geography
Asia-Pacific held the largest Advanced Ceramics market share in 2021, with a share of 44%. This growth is mainly attributed to the increase in demand for advanced ceramics in numerous industries such as electrical and electronics, automotive, medical, aerospace and energy and power among others. The presence of numerous developing countries such as China, India, Indonesia and Malaysia among others are the major countries supporting the growth of the market. For instance, according to China Passenger Car Association, in 2021, total sales of passenger electric vehicles in China increased by 2.99 million units showing a jump of 169.1% compared to 2020. Further, according to the Ministry of New and Renewable Energy, in 2021, India added 1.45 GW of wind capacity showing a 30% increase compared to 1.11 GW installed in 2020. Advanced ceramics are widely used in several applications such as wind turbines, knee replacement elements, pressure sensors, valve parts and injection systems among many others. Thus, the significant demand from several industries in this region is also boosting the growth of the Advanced Ceramics market.
Advanced Ceramics Market Drivers
Growing electrical and electronics industry
Advanced ceramics play a significant role in electrical and electronics applications. These are extensively used in heat sinks, actuators, circuit carriers and sensors. Ceramic heat sinks are used in high-power electronics. Ceramics are traditionally considered as insulating materials comprise of magnetic, superconducting, piezoelectric and semiconducting properties. These are widely used in power electronics, electronic sensors and wafer production. For instance, according to the data provided U.S Census Bureau, in July 2022, electronic component manufacturing in the US increased by 14.8% in comparison to 2021 for the same month. However, changing climatic conditions, the spread of crop diseases and new plant-breeding techniques require effective nutrients, in turn, increasing the Advanced Ceramics market size.
Increased adoption of advanced ceramic in several industries
The advanced ceramics mainly include alumina, zirconia, ferrite and aluminum nitride among others. They mainly exhibit beneficial properties such as flexural strength, chemical resistance, temperature resistance, electrical insulation, hardness, thermal insulation, dielectric strength and thermal conductivity. Owing to these properties, they are extensively used in medical, aerospace, automotive, electrical & electronics, energy & power, chemical and biotechnology. The major applications include valve plates, brake calipers, knee replacement elements, wind turbines, ceramic screws, rail injection systems and semiconductors. According to the International Organization of Motor Vehicles Manufacturer, in 2021, global motor vehicle production was 80.1 million compared to 77.7 million produced in 2020 showing a 3% increase. Thus, an increase in demand for effective fertilizers boosts the growth of the Advanced Ceramics market size.
Advanced Ceramics Market Challenge
High cost of advanced ceramics
Advanced ceramics provide several benefits such as endurance to high heat and strength, low coefficient of thermal expansion and superior thermal conductivity. These are extensively used in aviation, communication, military and other high technology fields. However, advanced ceramics are relatively high in cost as compared to traditional ceramics. Manufacturers operating in advanced ceramics have to comply with high manufacturing costs and machining. Despite their cost, aluminum nitride and silicon carbide are used in numerous advanced applications. Thus, the high cost of advanced ceramics may hamper the market growth of Advanced Ceramics market.
Advanced Ceramics Industry Outlook
The top 10 companies in the Advanced Ceramics market are -
1. CeramTec GmbH
2. AGC Ceramics Co. Ltd.
3. 3M
4. CoorsTek Inc.
5. Elan Technology
6. KYOCERA Corporation
7. Saint-Gobain
8. Corning Incorporated
9. Morgan Advanced Materials
10. Murata Manufacturing Co. Ltd.
Recent Developments
- In May 2021, Murata Manufacturing Co. Ltd. produced multilayer ceramic capacitor GCM21BC71E106ME36 which owns the highest capacitance of 10uF with a 2012M size and 25V rating for 12V line smoothing applications in automobiles.
- In February 2019, Kyocera Corporation has announced the acquisition of H.C. Starck GmbH, an advanced ceramics manufacturing and sales company in Europe based in Selb, Germany.
- In April 2019, Corning Incorporated announced the showcase of its ceramic and glass technologies at Ceramic Expo. The event was attended by suppliers, manufacturers and customers in the ceramics industry.
Relevant Reports
Report Code: CMR 0104
Report Code: CMR 0223
Report Code: CMR 0360
For more Chemicals and Materials Market reports, please click here
1. Advanced Ceramics Market - Market Overview
1.1 Definitions and Scope
2. Advanced Ceramics Market - Executive Summary
2.1 Key Trends by Material
2.2 Key Trends by Product
2.3 Key Trends by Application
2.4 Key Trends by End-use Industry
2.5 Key Trends by Geography
3. Advanced Ceramics Market – Comparative analysis
3.1 Market Share Analysis - Major Companies
3.2 Product Benchmarking - Major Companies
3.3 Top 5 Financials Analysis
3.4 Patent Analysis - Major Companies
3.5 Pricing Analysis (ASPs will be provided)
4. Advanced Ceramics Market - Startup companies Scenario Premium Premium
4.1 Major startup company analysis:
4.1.1 Investment
4.1.2 Revenue
4.1.3 Product portfolio
4.1.4 Venture Capital and Funding Scenario
5. Advanced Ceramics Market – Industry Market Entry Scenario Premium Premium
5.1 Regulatory Framework Overview
5.2 New Business and Ease of Doing Business Index
5.3 Successful Venture Profiles
5.4 Customer Analysis – Major companies
6. Advanced Ceramics Market - Market Forces
6.1 Market Drivers
6.2 Market Constraints
6.3 Porter's Five Force Model
6.3.1 Bargaining Power of Suppliers
6.3.2 Bargaining Powers of Buyers
6.3.3 Threat of New Entrants
6.3.4 Competitive Rivalry
6.3.5 Threat of Substitutes
7. Advanced Ceramics Market – Strategic Analysis
7.1 Value/Supply Chain Analysis
7.2 Opportunity Analysis
7.3 Product/Market Life Cycle
7.4 Distributor Analysis – Major Companies
8. Advanced Ceramics Market – by Material (Market Size - US$Million/Billion)
8.1 Alumina
8.2 Titanate
8.3 Zirconia
8.4 Ferrite
8.5 Aluminum Nitride
8.6 Silicon Carbide
8.7 Silicon Nitride
8.8 Others
9. Advanced Ceramics Market – by Product (Market Size - US$Million/Billion)
9.1 Monolithic Ceramics
9.2 Ceramic Matrix Composites
9.3 Ceramic Coatings
9.4 Ceramic Filters
9.5 Others
10. Advanced Ceramics Market – by Application (Market Size - US$Million/Billion)
10.1 Electrical Equipment
10.2 Wear Parts
10.3 Engine Parts
10.4 Filters
10.5 Armor
10.6 Furnace Tube
10.7 Brake Calipers
10.8 Cutting Tools
10.9 Others
11. Advanced Ceramics Market – by End-use Industry (Market Size - US$Million/Billion)
11.1 Electrical & Electronics
11.1.1 Chip Manufacturing
11.1.2 Capacitor Ceramics
11.1.3 Piezoelectric Ceramics
11.1.4 Electronic Devices
11.1.5 Circuit Carriers
11.1.6 Others
11.2 Automotive
11.2.1 Passenger Cars
11.2.2 Light Commercial Vehicle
11.2.3 Heavy Commercial Vehicle
11.3 Machinery and Metal Processing
11.4 Medical
11.5 Chemical
11.6 Aerospace
11.6.1 Commercial Aviation
11.6.2 Military Aviation
11.6.3 General Aviation
11.7 Biotechnology
11.8 Energy and Power
11.8.1 Wind Turbines
11.8.2 Photovoltaic Systems
11.8.3 Piezo-ceramic Sensors
11.9 Others
12. Advanced Ceramics Market - by Geography (Market Size - US$Million/Billion)
12.1 North America
12.1.1 the USA
12.1.2 Canada
12.1.3 Mexico
12.2 Europe
12.2.1 the UK
12.2.2 Germany
12.2.3 France
12.2.4 Italy
12.2.5 the Netherlands
12.2.6 Spain
12.2.7 Russia
12.2.8 Belgium
12.2.9 Rest of Europe
12.3 Asia-Pacific
12.3.1 China
12.3.2 Japan
12.3.3 India
12.3.4 South Korea
12.3.5 Australia and New Zeeland
12.3.6 Indonesia
12.3.7 Taiwan
12.3.8 Malaysia
12.3.9 Rest of APAC
12.4 South America
12.4.1 Brazil
12.4.2 Argentina
12.4.3 Colombia
12.4.4 Chile
12.4.5 Rest of South America
12.5 Rest of the World
12.5.1 the Middle East
12.5.2 Africa
13. Advanced Ceramics Market – Entropy
13.1 New Product Launches
13.2 M&As, Collaborations, JVs and Partnerships
14. Advanced Ceramics Market – Industry/Competition Segment Analysis Premium
14.1 Company Benchmarking Matrix – Major Companies
14.2 Market Share at Global Level - Major companies
14.3 Market Share by Key Region - Major companies
14.4 Market Share by Key Country - Major companies
14.5 Market Share by Key Product Type/Product category - Major companies
15. Advanced Ceramics Market – Key Company List by Country Premium Premium
16. Advanced Ceramics Market Company Analysis - Business Overview, Product Portfolio, Financials and Developments
16.1 Company 1
16.2 Company 2
16.3 Company 3
16.4 Company 4
16.5 Company 5
16.6 Company 6
16.7 Company 7
16.8 Company 8
16.9 Company 9
16.10 Company 10 and more
* "Financials would be provided to private companies on best-efforts basis."
Connect with our experts to get customized reports that best suit your requirements. Our reports include global-level data, niche markets and competitive landscape.
List of Tables
Table 1: Advanced Ceramics Market Overview 2021-2026
Table 2: Advanced Ceramics Market Leader Analysis 2018-2019 (US$)
Table 3: Advanced Ceramics Market Product Analysis 2018-2019 (US$)
Table 4: Advanced Ceramics Market End User Analysis 2018-2019 (US$)
Table 5: Advanced Ceramics Market Patent Analysis 2013-2018* (US$)
Table 6: Advanced Ceramics Market Financial Analysis 2018-2019 (US$)
Table 7: Advanced Ceramics Market Driver Analysis 2018-2019 (US$)
Table 8: Advanced Ceramics Market Challenges Analysis 2018-2019 (US$)
Table 9: Advanced Ceramics Market Constraint Analysis 2018-2019 (US$)
Table 10: Advanced Ceramics Market Supplier Bargaining Power Analysis 2018-2019 (US$)
Table 11: Advanced Ceramics Market Buyer Bargaining Power Analysis 2018-2019 (US$)
Table 12: Advanced Ceramics Market Threat of Substitutes Analysis 2018-2019 (US$)
Table 13: Advanced Ceramics Market Threat of New Entrants Analysis 2018-2019 (US$)
Table 14: Advanced Ceramics Market Degree of Competition Analysis 2018-2019 (US$)
Table 15: Advanced Ceramics Market Value Chain Analysis 2018-2019 (US$)
Table 16: Advanced Ceramics Market Pricing Analysis 2021-2026 (US$)
Table 17: Advanced Ceramics Market Opportunities Analysis 2021-2026 (US$)
Table 18: Advanced Ceramics Market Product Life Cycle Analysis 2021-2026 (US$)
Table 19: Advanced Ceramics Market Supplier Analysis 2018-2019 (US$)
Table 20: Advanced Ceramics Market Distributor Analysis 2018-2019 (US$)
Table 21: Advanced Ceramics Market Trend Analysis 2018-2019 (US$)
Table 22: Advanced Ceramics Market Size 2018 (US$)
Table 23: Advanced Ceramics Market Forecast Analysis 2021-2026 (US$)
Table 24: Advanced Ceramics Market Sales Forecast Analysis 2021-2026 (Units)
Table 25: Advanced Ceramics Market, Revenue & Volume, By Product Category, 2021-2026 ($)
Table 26: Advanced Ceramics Market By Product Category, Revenue & Volume, By Ceramic Coatings, 2021-2026 ($)
Table 27: Advanced Ceramics Market By Product Category, Revenue & Volume, By Monolithic Ceramics, 2021-2026 ($)
Table 28: Advanced Ceramics Market By Product Category, Revenue & Volume, By Ceramic matrix Composites, 2021-2026 ($)
Table 29: Advanced Ceramics Market, Revenue & Volume, By Raw Material, 2021-2026 ($)
Table 30: Advanced Ceramics Market By Raw Material, Revenue & Volume, By Alumina based Advanced Ceramics, 2021-2026 ($)
Table 31: Advanced Ceramics Market By Raw Material, Revenue & Volume, By Zirconia based Advanced Ceramics, 2021-2026 ($)
Table 32: Advanced Ceramics Market By Raw Material, Revenue & Volume, By Titanate based Advanced Ceramics, 2021-2026 ($)
Table 33: Advanced Ceramics Market By Raw Material, Revenue & Volume, By Silicon Carbide based Advanced Ceramics, 2021-2026 ($)
Table 34: Advanced Ceramics Market By Raw Material, Revenue & Volume, By Other Products based Advanced Ceramics, 2021-2026 ($)
Table 35: Advanced Ceramics Market, Revenue & Volume, By Application, 2021-2026 ($)
Table 36: Advanced Ceramics Market By Application, Revenue & Volume, By Electrical & Electronics, 2021-2026 ($)
Table 37: Advanced Ceramics Market By Application, Revenue & Volume, By Chemical, 2021-2026 ($)
Table 38: Advanced Ceramics Market By Application, Revenue & Volume, By Automotive, 2021-2026 ($)
Table 39: Advanced Ceramics Market By Application, Revenue & Volume, By Medical & Bio Ceramics, 2021-2026 ($)
Table 40: Advanced Ceramics Market By Application, Revenue & Volume, By Defence & Security, 2021-2026 ($)
Table 41: North America Advanced Ceramics Market, Revenue & Volume, By Product Category, 2021-2026 ($)
Table 42: North America Advanced Ceramics Market, Revenue & Volume, By Raw Material, 2021-2026 ($)
Table 43: North America Advanced Ceramics Market, Revenue & Volume, By Application, 2021-2026 ($)
Table 44: South america Advanced Ceramics Market, Revenue & Volume, By Product Category, 2021-2026 ($)
Table 45: South america Advanced Ceramics Market, Revenue & Volume, By Raw Material, 2021-2026 ($)
Table 46: South america Advanced Ceramics Market, Revenue & Volume, By Application, 2021-2026 ($)
Table 47: Europe Advanced Ceramics Market, Revenue & Volume, By Product Category, 2021-2026 ($)
Table 48: Europe Advanced Ceramics Market, Revenue & Volume, By Raw Material, 2021-2026 ($)
Table 49: Europe Advanced Ceramics Market, Revenue & Volume, By Application, 2021-2026 ($)
Table 50: APAC Advanced Ceramics Market, Revenue & Volume, By Product Category, 2021-2026 ($)
Table 51: APAC Advanced Ceramics Market, Revenue & Volume, By Raw Material, 2021-2026 ($)
Table 52: APAC Advanced Ceramics Market, Revenue & Volume, By Application, 2021-2026 ($)
Table 53: Middle East & Africa Advanced Ceramics Market, Revenue & Volume, By Product Category, 2021-2026 ($)
Table 54: Middle East & Africa Advanced Ceramics Market, Revenue & Volume, By Raw Material, 2021-2026 ($)
Table 55: Middle East & Africa Advanced Ceramics Market, Revenue & Volume, By Application, 2021-2026 ($)
Table 56: Russia Advanced Ceramics Market, Revenue & Volume, By Product Category, 2021-2026 ($)
Table 57: Russia Advanced Ceramics Market, Revenue & Volume, By Raw Material, 2021-2026 ($)
Table 58: Russia Advanced Ceramics Market, Revenue & Volume, By Application, 2021-2026 ($)
Table 59: Israel Advanced Ceramics Market, Revenue & Volume, By Product Category, 2021-2026 ($)
Table 60: Israel Advanced Ceramics Market, Revenue & Volume, By Raw Material, 2021-2026 ($)
Table 61: Israel Advanced Ceramics Market, Revenue & Volume, By Application, 2021-2026 ($)
Table 62: Top Companies 2018 (US$)Advanced Ceramics Market, Revenue & Volume
Table 63: Product Launch 2018-2019Advanced Ceramics Market, Revenue & Volume
Table 64: Mergers & Acquistions 2018-2019Advanced Ceramics Market, Revenue & Volume
List of Figures
Figure 1: Overview of Advanced Ceramics Market 2021-2026
Figure 2: Market Share Analysis for Advanced Ceramics Market 2018 (US$)
Figure 3: Product Comparison in Advanced Ceramics Market 2018-2019 (US$)
Figure 4: End User Profile for Advanced Ceramics Market 2018-2019 (US$)
Figure 5: Patent Application and Grant in Advanced Ceramics Market 2013-2018* (US$)
Figure 6: Top 5 Companies Financial Analysis in Advanced Ceramics Market 2018-2019 (US$)
Figure 7: Market Entry Strategy in Advanced Ceramics Market 2018-2019
Figure 8: Ecosystem Analysis in Advanced Ceramics Market 2018
Figure 9: Average Selling Price in Advanced Ceramics Market 2021-2026
Figure 10: Top Opportunites in Advanced Ceramics Market 2018-2019
Figure 11: Market Life Cycle Analysis in Advanced Ceramics Market
Figure 12: GlobalBy Product CategoryAdvanced Ceramics Market Revenue, 2021-2026 ($)
Figure 13: GlobalBy Raw Material Advanced Ceramics Market Revenue, 2021-2026 ($)
Figure 14: GlobalBy ApplicationAdvanced Ceramics Market Revenue, 2021-2026 ($)
Figure 15: Global Advanced Ceramics Market - By Geography
Figure 16: Global Advanced Ceramics Market Value & Volume, By Geography, 2021-2026 ($)
Figure 17: Global Advanced Ceramics Market CAGR, By Geography, 2021-2026 (%)
Figure 18: North America Advanced Ceramics Market Value & Volume, 2021-2026 ($)
Figure 19: US Advanced Ceramics Market Value & Volume, 2021-2026 ($)
Figure 20: US GDP and Population, 2018-2019 ($)
Figure 21: US GDP – Composition of 2018, By Sector of Origin
Figure 22: US Export and Import Value & Volume, 2018-2019 ($)
Figure 23: Canada Advanced Ceramics Market Value & Volume, 2021-2026 ($)
Figure 24: Canada GDP and Population, 2018-2019 ($)
Figure 25: Canada GDP – Composition of 2018, By Sector of Origin
Figure 26: Canada Export and Import Value & Volume, 2018-2019 ($)
Figure 27: Mexico Advanced Ceramics Market Value & Volume, 2021-2026 ($)
Figure 28: Mexico GDP and Population, 2018-2019 ($)
Figure 29: Mexico GDP – Composition of 2018, By Sector of Origin
Figure 30: Mexico Export and Import Value & Volume, 2018-2019 ($)
Figure 31: South America Advanced Ceramics Market Value & Volume, 2021-2026 ($)
Figure 32: Brazil Advanced Ceramics Market Value & Volume, 2021-2026 ($)
Figure 33: Brazil GDP and Population, 2018-2019 ($)
Figure 34: Brazil GDP – Composition of 2018, By Sector of Origin
Figure 35: Brazil Export and Import Value & Volume, 2018-2019 ($)
Figure 36: Venezuela Advanced Ceramics Market Value & Volume, 2021-2026 ($)
Figure 37: Venezuela GDP and Population, 2018-2019 ($)
Figure 38: Venezuela GDP – Composition of 2018, By Sector of Origin
Figure 39: Venezuela Export and Import Value & Volume, 2018-2019 ($)
Figure 40: Argentina Advanced Ceramics Market Value & Volume, 2021-2026 ($)
Figure 41: Argentina GDP and Population, 2018-2019 ($)
Figure 42: Argentina GDP – Composition of 2018, By Sector of Origin
Figure 43: Argentina Export and Import Value & Volume, 2018-2019 ($)
Figure 44: Ecuador Advanced Ceramics Market Value & Volume, 2021-2026 ($)
Figure 45: Ecuador GDP and Population, 2018-2019 ($)
Figure 46: Ecuador GDP – Composition of 2018, By Sector of Origin
Figure 47: Ecuador Export and Import Value & Volume, 2018-2019 ($)
Figure 48: Peru Advanced Ceramics Market Value & Volume, 2021-2026 ($)
Figure 49: Peru GDP and Population, 2018-2019 ($)
Figure 50: Peru GDP – Composition of 2018, By Sector of Origin
Figure 51: Peru Export and Import Value & Volume, 2018-2019 ($)
Figure 52: Colombia Advanced Ceramics Market Value & Volume, 2021-2026 ($)
Figure 53: Colombia GDP and Population, 2018-2019 ($)
Figure 54: Colombia GDP – Composition of 2018, By Sector of Origin
Figure 55: Colombia Export and Import Value & Volume, 2018-2019 ($)
Figure 56: Costa Rica Advanced Ceramics Market Value & Volume, 2021-2026 ($)
Figure 57: Costa Rica GDP and Population, 2018-2019 ($)
Figure 58: Costa Rica GDP – Composition of 2018, By Sector of Origin
Figure 59: Costa Rica Export and Import Value & Volume, 2018-2019 ($)
Figure 60: Europe Advanced Ceramics Market Value & Volume, 2021-2026 ($)
Figure 61: U.K Advanced Ceramics Market Value & Volume, 2021-2026 ($)
Figure 62: U.K GDP and Population, 2018-2019 ($)
Figure 63: U.K GDP – Composition of 2018, By Sector of Origin
Figure 64: U.K Export and Import Value & Volume, 2018-2019 ($)
Figure 65: Germany Advanced Ceramics Market Value & Volume, 2021-2026 ($)
Figure 66: Germany GDP and Population, 2018-2019 ($)
Figure 67: Germany GDP – Composition of 2018, By Sector of Origin
Figure 68: Germany Export and Import Value & Volume, 2018-2019 ($)
Figure 69: Italy Advanced Ceramics Market Value & Volume, 2021-2026 ($)
Figure 70: Italy GDP and Population, 2018-2019 ($)
Figure 71: Italy GDP – Composition of 2018, By Sector of Origin
Figure 72: Italy Export and Import Value & Volume, 2018-2019 ($)
Figure 73: France Advanced Ceramics Market Value & Volume, 2021-2026 ($)
Figure 74: France GDP and Population, 2018-2019 ($)
Figure 75: France GDP – Composition of 2018, By Sector of Origin
Figure 76: France Export and Import Value & Volume, 2018-2019 ($)
Figure 77: Netherlands Advanced Ceramics Market Value & Volume, 2021-2026 ($)
Figure 78: Netherlands GDP and Population, 2018-2019 ($)
Figure 79: Netherlands GDP – Composition of 2018, By Sector of Origin
Figure 80: Netherlands Export and Import Value & Volume, 2018-2019 ($)
Figure 81: Belgium Advanced Ceramics Market Value & Volume, 2021-2026 ($)
Figure 82: Belgium GDP and Population, 2018-2019 ($)
Figure 83: Belgium GDP – Composition of 2018, By Sector of Origin
Figure 84: Belgium Export and Import Value & Volume, 2018-2019 ($)
Figure 85: Spain Advanced Ceramics Market Value & Volume, 2021-2026 ($)
Figure 86: Spain GDP and Population, 2018-2019 ($)
Figure 87: Spain GDP – Composition of 2018, By Sector of Origin
Figure 88: Spain Export and Import Value & Volume, 2018-2019 ($)
Figure 89: Denmark Advanced Ceramics Market Value & Volume, 2021-2026 ($)
Figure 90: Denmark GDP and Population, 2018-2019 ($)
Figure 91: Denmark GDP – Composition of 2018, By Sector of Origin
Figure 92: Denmark Export and Import Value & Volume, 2018-2019 ($)
Figure 93: APAC Advanced Ceramics Market Value & Volume, 2021-2026 ($)
Figure 94: China Advanced Ceramics Market Value & Volume, 2021-2026
Figure 95: China GDP and Population, 2018-2019 ($)
Figure 96: China GDP – Composition of 2018, By Sector of Origin
Figure 97: China Export and Import Value & Volume, 2018-2019 ($)Advanced Ceramics Market China Export and Import Value & Volume, 2018-2019 ($)
Figure 98: Australia Advanced Ceramics Market Value & Volume, 2021-2026 ($)
Figure 99: Australia GDP and Population, 2018-2019 ($)
Figure 100: Australia GDP – Composition of 2018, By Sector of Origin
Figure 101: Australia Export and Import Value & Volume, 2018-2019 ($)
Figure 102: South Korea Advanced Ceramics Market Value & Volume, 2021-2026 ($)
Figure 103: South Korea GDP and Population, 2018-2019 ($)
Figure 104: South Korea GDP – Composition of 2018, By Sector of Origin
Figure 105: South Korea Export and Import Value & Volume, 2018-2019 ($)
Figure 106: India Advanced Ceramics Market Value & Volume, 2021-2026 ($)
Figure 107: India GDP and Population, 2018-2019 ($)
Figure 108: India GDP – Composition of 2018, By Sector of Origin
Figure 109: India Export and Import Value & Volume, 2018-2019 ($)
Figure 110: Taiwan Advanced Ceramics Market Value & Volume, 2021-2026 ($)
Figure 111: Taiwan GDP and Population, 2018-2019 ($)
Figure 112: Taiwan GDP – Composition of 2018, By Sector of Origin
Figure 113: Taiwan Export and Import Value & Volume, 2018-2019 ($)
Figure 114: Malaysia Advanced Ceramics Market Value & Volume, 2021-2026 ($)
Figure 115: Malaysia GDP and Population, 2018-2019 ($)
Figure 116: Malaysia GDP – Composition of 2018, By Sector of Origin
Figure 117: Malaysia Export and Import Value & Volume, 2018-2019 ($)
Figure 118: Hong Kong Advanced Ceramics Market Value & Volume, 2021-2026 ($)
Figure 119: Hong Kong GDP and Population, 2018-2019 ($)
Figure 120: Hong Kong GDP – Composition of 2018, By Sector of Origin
Figure 121: Hong Kong Export and Import Value & Volume, 2018-2019 ($)
Figure 122: Middle East & Africa Advanced Ceramics Market Middle East & Africa 3D Printing Market Value & Volume, 2021-2026 ($)
Figure 123: Russia Advanced Ceramics Market Value & Volume, 2021-2026 ($)
Figure 124: Russia GDP and Population, 2018-2019 ($)
Figure 125: Russia GDP – Composition of 2018, By Sector of Origin
Figure 126: Russia Export and Import Value & Volume, 2018-2019 ($)
Figure 127: Israel Advanced Ceramics Market Value & Volume, 2021-2026 ($)
Figure 128: Israel GDP and Population, 2018-2019 ($)
Figure 129: Israel GDP – Composition of 2018, By Sector of Origin
Figure 130: Israel Export and Import Value & Volume, 2018-2019 ($)
Figure 131: Entropy Share, By Strategies, 2018-2019* (%)Advanced Ceramics Market
Figure 132: Developments, 2018-2019*Advanced Ceramics Market
Figure 133: Company 1 Advanced Ceramics Market Net Revenue, By Years, 2018-2019* ($)
Figure 134: Company 1 Advanced Ceramics Market Net Revenue Share, By Business segments, 2018 (%)
Figure 135: Company 1 Advanced Ceramics Market Net Sales Share, By Geography, 2018 (%)
Figure 136: Company 2 Advanced Ceramics Market Net Revenue, By Years, 2018-2019* ($)
Figure 137: Company 2 Advanced Ceramics Market Net Revenue Share, By Business segments, 2018 (%)
Figure 138: Company 2 Advanced Ceramics Market Net Sales Share, By Geography, 2018 (%)
Figure 139: Company 3 Advanced Ceramics Market Net Revenue, By Years, 2018-2019* ($)
Figure 140: Company 3 Advanced Ceramics Market Net Revenue Share, By Business segments, 2018 (%)
Figure 141: Company 3 Advanced Ceramics Market Net Sales Share, By Geography, 2018 (%)
Figure 142: Company 4 Advanced Ceramics Market Net Revenue, By Years, 2018-2019* ($)
Figure 143: Company 4 Advanced Ceramics Market Net Revenue Share, By Business segments, 2018 (%)
Figure 144: Company 4 Advanced Ceramics Market Net Sales Share, By Geography, 2018 (%)
Figure 145: Company 5 Advanced Ceramics Market Net Revenue, By Years, 2018-2019* ($)
Figure 146: Company 5 Advanced Ceramics Market Net Revenue Share, By Business segments, 2018 (%)
Figure 147: Company 5 Advanced Ceramics Market Net Sales Share, By Geography, 2018 (%)
Figure 148: Company 6 Advanced Ceramics Market Net Revenue, By Years, 2018-2019* ($)
Figure 149: Company 6 Advanced Ceramics Market Net Revenue Share, By Business segments, 2018 (%)
Figure 150: Company 6 Advanced Ceramics Market Net Sales Share, By Geography, 2018 (%)
Figure 151: Company 7 Advanced Ceramics Market Net Revenue, By Years, 2018-2019* ($)
Figure 152: Company 7 Advanced Ceramics Market Net Revenue Share, By Business segments, 2018 (%)
Figure 153: Company 7 Advanced Ceramics Market Net Sales Share, By Geography, 2018 (%)
Figure 154: Company 8 Advanced Ceramics Market Net Revenue, By Years, 2018-2019* ($)
Figure 155: Company 8 Advanced Ceramics Market Net Revenue Share, By Business segments, 2018 (%)
Figure 156: Company 8 Advanced Ceramics Market Net Sales Share, By Geography, 2018 (%)
Figure 157: Company 9 Advanced Ceramics Market Net Revenue, By Years, 2018-2019* ($)
Figure 158: Company 9 Advanced Ceramics Market Net Revenue Share, By Business segments, 2018 (%)
Figure 159: Company 9 Advanced Ceramics Market Net Sales Share, By Geography, 2018 (%)
Figure 160: Company 10 Advanced Ceramics Market Net Revenue, By Years, 2018-2019* ($)
Figure 161: Company 10 Advanced Ceramics Market Net Revenue Share, By Business segments, 2018 (%)
Figure 162: Company 10 Advanced Ceramics Market Net Sales Share, By Geography, 2018 (%)
Figure 163: Company 11 Advanced Ceramics Market Net Revenue, By Years, 2018-2019* ($)
Figure 164: Company 11 Advanced Ceramics Market Net Revenue Share, By Business segments, 2018 (%)
Figure 165: Company 11 Advanced Ceramics Market Net Sales Share, By Geography, 2018 (%)
Figure 166: Company 12 Advanced Ceramics Market Net Revenue, By Years, 2018-2019* ($)
Figure 167: Company 12 Advanced Ceramics Market Net Revenue Share, By Business segments, 2018 (%)
Figure 168: Company 12 Advanced Ceramics Market Net Sales Share, By Geography, 2018 (%)
Figure 169: Company 13 Advanced Ceramics Market Net Revenue, By Years, 2018-2019* ($)
Figure 170: Company 13 Advanced Ceramics Market Net Revenue Share, By Business segments, 2018 (%)
Figure 171: Company 13 Advanced Ceramics Market Net Sales Share, By Geography, 2018 (%)
Figure 172: Company 14 Advanced Ceramics Market Net Revenue, By Years, 2018-2019* ($)
Figure 173: Company 14 Advanced Ceramics Market Net Revenue Share, By Business segments, 2018 (%)
Figure 174: Company 14 Advanced Ceramics Market Net Sales Share, By Geography, 2018 (%)
Figure 175: Company 15 Advanced Ceramics Market Net Revenue, By Years, 2018-2019* ($)
Figure 176: Company 15 Advanced Ceramics Market Net Revenue Share, By Business segments, 2018 (%)
Figure 177: Company 15 Advanced Ceramics Market Net Sales Share, By Geography, 2018 (%)