 Email
Email Print
Print


Agricultural Nanotechnology Market - Forecast(2024 - 2030)
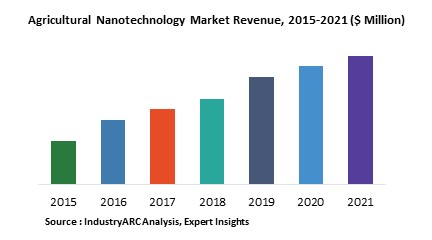
Nanotechnology is an engineering, science and technology conducted at the nanoscale (1-1000) and is a key improvement for agriculture sector. Agriculture is witnessing numerous issues and challenges such as population growth, climate change and limited availability of plant nuterients such as phosphorus and potassium. Developments in nanotechnology are set to address these issues effectively with applications in agricultural production. Pesticide formulations and nanosensors are emerging as the major applications of nanotechnology in agriculture especially in developing countries. The global agriculture nanotechnology market is poised to witness growth of XX% CAGR during the forecast period to reach revenue of $XXm by 2021.
This report provides detailed analysis of the global agriculture nanotechnology market based on the application such as crop protection, soil improvement, water purification diagnostic, and plant breeding. The global agricultural nanotechnology market is also segmented by end users which includes: farmers/producers, R&D institutes and government organizations. Global food waste management market is also analyzed based on the geographic regions that include North America, Europe, APAC, and Rest of the World (RoW). The market is further segmented on the basis of the key countries in the region. Agriculture being the low profit industry, nanotechnology in agriculture is expected to witness tremendous regulatory hurdles in parallel with the opposition of NGOs.
Global agriculture nanotechnology market is fragmented market with the presence of significant number of players.
Sample Companies profiled in this Report are:
- Nanoscale Corporation (U.S.)
- Buitendijk Techniek BV (The Netherlands)
- Nanosys, Inc. (U.S.)
- LYC North America, Inc. (U.S.)
- Kaydon Corporation (U.S.).
- 10+.
1. Agricultural Nanotechnology Market - Overview
1.1. Definitions and Scope
2. Agricultural Nanotechnology Market - Executive summary
2.1. Market Revenue, Market Size and Key Trends by Company
2.2. Key Trends by type of Application
2.3. Key Trends segmented by Geography
3. Agricultural Nanotechnology Market
3.1. Comparative analysis
3.1.1. Product Benchmarking - Top 10 companies
3.1.2. Top 5 Financials Analysis
3.1.3. Market Value split by Top 10 companies
3.1.4. Patent Analysis - Top 10 companies
3.1.5. Pricing Analysis
4. Agricultural Nanotechnology Market – Startup companies Scenario Premium
4.1. Top 10 startup company Analysis by
4.1.1. Investment
4.1.2. Revenue
4.1.3. Market Shares
4.1.4. Market Size and Application Analysis
4.1.5. Venture Capital and Funding Scenario
5. Agricultural Nanotechnology Market – Industry Market Entry Scenario Premium
5.1. Regulatory Framework Overview
5.2. New Business and Ease of Doing business index
5.3. Case studies of successful ventures
5.4. Customer Analysis – Top 10 companies
6. Agricultural Nanotechnology Market Forces
6.1. Drivers
6.2. Constraints
6.3. Challenges
6.4. Porters five force model
6.4.1. Bargaining power of suppliers
6.4.2. Bargaining powers of customers
6.4.3. Threat of new entrants
6.4.4. Rivalry among existing players
6.4.5. Threat of substitutes
7. Agricultural Nanotechnology Market -Strategic analysis
7.1. Value chain analysis
7.2. Opportunities analysis
7.3. Product life cycle
7.4. Suppliers and distributors Market Share
8. Agricultural Nanotechnology Market – By Applications (Market Size -$Million / $Billion)
8.1. Market Size and Market Share Analysis
8.2. Application Revenue and Trend Research
8.3. Product Segment Analysis
8.3.1. Crop Protection
8.3.2. Soil Improvement
8.3.3. Water Purification
8.3.4. Diagnostic
8.3.5. Plant Breeding
8.3.6. Nanoparticles Production
8.3.7. Other
9. Agricultural Nanotechnology – By End Use Industry(Market Size -$Million / $Billion)
9.1. Segment type Size and Market Share Analysis
9.2. Application Revenue and Trends by type of Application
9.3. Application Segment Analysis by Type
9.3.1. Farmers/Producers
9.3.2. R&D Institutes
9.3.3. Government Organizations
9.3.4. Others
10. Agricultural Nanotechnology - By Geography (Market Size -$Million / $Billion)
10.1. Agricultural Nanotechnology Market - North America Segment Research
10.2. North America Market Research (Million / $Billion)
10.2.1. Segment type Size and Market Size Analysis
10.2.2. Revenue and Trends
10.2.3. Application Revenue and Trends by type of Application
10.2.4. Company Revenue and Product Analysis
10.2.5. North America Product type and Application Market Size
10.2.5.1. U.S.
10.2.5.2. Canada
10.2.5.3. Mexico
10.2.5.4. Rest of North America
10.3. Agricultural Nanotechnology - South America Segment Research
10.4. South America Market Research (Market Size -$Million / $Billion)
10.4.1. Segment type Size and Market Size Analysis
10.4.2. Revenue and Trends
10.4.3. Application Revenue and Trends by type of Application
10.4.4. Company Revenue and Product Analysis
10.4.5. South America Product type and Application Market Size
10.4.5.1. Brazil
10.4.5.2. Venezuela
10.4.5.3. Argentina
10.4.5.4. Ecuador
10.4.5.5. Peru
10.4.5.6. Colombia
10.4.5.7. Costa Rica
10.4.5.8. Rest of South America
10.5. Agricultural Nanotechnology - Europe Segment Research
10.6. Europe Market Research (Market Size -$Million / $Billion)
10.6.1. Segment type Size and Market Size Analysis
10.6.2. Revenue and Trends
10.6.3. Application Revenue and Trends by type of Application
10.6.4. Company Revenue and Product Analysis
10.6.5. Europe Segment Product type and Application Market Size
10.6.5.1. U.K
10.6.5.2. Germany
10.6.5.3. Italy
10.6.5.4. France
10.6.5.5. Netherlands
10.6.5.6. Belgium
10.6.5.7. Spain
10.6.5.8. Denmark
10.6.5.9. Rest of Europe
10.7. Agricultural Nanotechnology – APAC Segment Research
10.8. APAC Market Research (Market Size -$Million / $Billion)
10.8.1. Segment type Size and Market Size Analysis
10.8.2. Revenue and Trends
10.8.3. Application Revenue and Trends by type of Application
10.8.4. Company Revenue and Product Analysis
10.8.5. APAC Segment – Product type and Application Market Size
10.8.5.1. China
10.8.5.2. Australia
10.8.5.3. Japan
10.8.5.4. South Korea
10.8.5.5. India
10.8.5.6. Taiwan
10.8.5.7. Malaysia
11. Agricultural Nanotechnology Market - Entropy
11.1. New product launches
11.2. M&A's, collaborations, JVs and partnerships
12. Agricultural Nanotechnology Market – Industry / Segment Competition landscape Premium
12.1. Market Share Analysis
12.1.1. Market Share by Country- Top companies
12.1.2. Market Share by Region- Top 10 companies
12.1.3. Market Share by type of Application – Top 10 companies
12.1.4. Market Share by type of Product / Product category- Top 10 companies
12.1.5. Market Share at global level- Top 10 companies
12.1.6. Best Practises for companies
13. Agricultural Nanotechnology Market – Key Company List by Country Premium
14. Agricultural Nanotechnology Market Company Analysis
14.1. Market Share, Company Revenue, Products, M&A, Developments
14.2. Nanoscale Corporation
14.3. Buitendijk Techniek BV
14.4. Nanosys, Inc
14.5. LYC North America, Inc
14.6. Kaydon Corporation
14.7. Company 6
14.8. Company 7
14.9. Company 8
14.10. Company 9
14.11. Company 10 and more
"*Financials would be provided on a best efforts basis for private companies"
15. Agricultural Nanotechnology Market -Appendix
15.1. Abbreviations
15.2. Sources
16. Agricultural Nanotechnology Market -Methodology Premium
16.1. Research Methodology
16.1.1. Company Expert Interviews
16.1.2. Industry Databases
16.1.3. Associations
16.1.4. Company News
16.1.5. Company Annual Reports
16.1.6. Application Trends
16.1.7. New Products and Product database
16.1.8. Company Transcripts
16.1.9. R&D Trends
16.1.10. Key Opinion Leaders Interviews
16.1.11. Supply and Demand Trends
List of Tables
Table1 Agricultural Nanotechnology Market Overview 2021-2026
Table2 Agricultural Nanotechnology Market Leader Analysis 2018-2019 (US$)
Table3 Agricultural Nanotechnology MarketProduct Analysis 2018-2019 (US$)
Table4 Agricultural Nanotechnology MarketEnd User Analysis 2018-2019 (US$)
Table5 Agricultural Nanotechnology MarketPatent Analysis 2013-2018* (US$)
Table6 Agricultural Nanotechnology MarketFinancial Analysis 2018-2019 (US$)
Table7 Agricultural Nanotechnology Market Driver Analysis 2018-2019 (US$)
Table8 Agricultural Nanotechnology MarketChallenges Analysis 2018-2019 (US$)
Table9 Agricultural Nanotechnology MarketConstraint Analysis 2018-2019 (US$)
Table10 Agricultural Nanotechnology Market Supplier Bargaining Power Analysis 2018-2019 (US$)
Table11 Agricultural Nanotechnology Market Buyer Bargaining Power Analysis 2018-2019 (US$)
Table12 Agricultural Nanotechnology Market Threat of Substitutes Analysis 2018-2019 (US$)
Table13 Agricultural Nanotechnology Market Threat of New Entrants Analysis 2018-2019 (US$)
Table14 Agricultural Nanotechnology Market Degree of Competition Analysis 2018-2019 (US$)
Table15 Agricultural Nanotechnology MarketValue Chain Analysis 2018-2019 (US$)
Table16 Agricultural Nanotechnology MarketPricing Analysis 2021-2026 (US$)
Table17 Agricultural Nanotechnology MarketOpportunities Analysis 2021-2026 (US$)
Table18 Agricultural Nanotechnology MarketProduct Life Cycle Analysis 2021-2026 (US$)
Table19 Agricultural Nanotechnology MarketSupplier Analysis 2018-2019 (US$)
Table20 Agricultural Nanotechnology MarketDistributor Analysis 2018-2019 (US$)
Table21 Agricultural Nanotechnology Market Trend Analysis 2018-2019 (US$)
Table22 Agricultural Nanotechnology Market Size 2018 (US$)
Table23 Agricultural Nanotechnology Market Forecast Analysis 2021-2026 (US$)
Table24 Agricultural Nanotechnology Market Sales Forecast Analysis 2021-2026 (Units)
Table25 Agricultural Nanotechnology Market, Revenue & Volume,By Application, 2021-2026 ($)
Table26 Agricultural Nanotechnology MarketBy Application, Revenue & Volume,By Crop Protection, 2021-2026 ($)
Table27 Agricultural Nanotechnology MarketBy Application, Revenue & Volume,By Soil Improvement, 2021-2026 ($)
Table28 Agricultural Nanotechnology MarketBy Application, Revenue & Volume,By Water Purification, 2021-2026 ($)
Table29 Agricultural Nanotechnology MarketBy Application, Revenue & Volume,By Diagnostic, 2021-2026 ($)
Table30 Agricultural Nanotechnology MarketBy Application, Revenue & Volume,By Plant Breeding, 2021-2026 ($)
Table31 Agricultural Nanotechnology Market, Revenue & Volume,By End User, 2021-2026 ($)
Table32 Agricultural Nanotechnology MarketBy End User, Revenue & Volume,By Farmers/Producers, 2021-2026 ($)
Table33 Agricultural Nanotechnology MarketBy End User, Revenue & Volume,By R&D Institutes, 2021-2026 ($)
Table34 Agricultural Nanotechnology MarketBy End User, Revenue & Volume,By Government Organizations, 2021-2026 ($)
Table35 North America Agricultural Nanotechnology Market, Revenue & Volume,By Application, 2021-2026 ($)
Table36 North America Agricultural Nanotechnology Market, Revenue & Volume,By End User, 2021-2026 ($)
Table37 South america Agricultural Nanotechnology Market, Revenue & Volume,By Application, 2021-2026 ($)
Table38 South america Agricultural Nanotechnology Market, Revenue & Volume,By End User, 2021-2026 ($)
Table39 Europe Agricultural Nanotechnology Market, Revenue & Volume,By Application, 2021-2026 ($)
Table40 Europe Agricultural Nanotechnology Market, Revenue & Volume,By End User, 2021-2026 ($)
Table41 APAC Agricultural Nanotechnology Market, Revenue & Volume,By Application, 2021-2026 ($)
Table42 APAC Agricultural Nanotechnology Market, Revenue & Volume,By End User, 2021-2026 ($)
Table43 Middle East & Africa Agricultural Nanotechnology Market, Revenue & Volume,By Application, 2021-2026 ($)
Table44 Middle East & Africa Agricultural Nanotechnology Market, Revenue & Volume,By End User, 2021-2026 ($)
Table45 Russia Agricultural Nanotechnology Market, Revenue & Volume,By Application, 2021-2026 ($)
Table46 Russia Agricultural Nanotechnology Market, Revenue & Volume,By End User, 2021-2026 ($)
Table47 Israel Agricultural Nanotechnology Market, Revenue & Volume,By Application, 2021-2026 ($)
Table48 Israel Agricultural Nanotechnology Market, Revenue & Volume,By End User, 2021-2026 ($)
Table49 Top Companies 2018 (US$)Agricultural Nanotechnology Market, Revenue & Volume,,
Table50 Product Launch 2018-2019Agricultural Nanotechnology Market, Revenue & Volume,,
Table51 Mergers & Acquistions 2018-2019Agricultural Nanotechnology Market, Revenue & Volume,,
List of Figures
Figure 1 Overview of Agricultural Nanotechnology Market 2021-2026
Figure 2 Market Share Analysis for Agricultural Nanotechnology Market 2018 (US$)
Figure 3 Product Comparison in Agricultural Nanotechnology Market 2018-2019 (US$)
Figure 4 End User Profile for Agricultural Nanotechnology Market 2018-2019 (US$)
Figure 5 Patent Application and Grant in Agricultural Nanotechnology Market 2013-2018* (US$)
Figure 6 Top 5 Companies Financial Analysis in Agricultural Nanotechnology Market 2018-2019 (US$)
Figure 7 Market Entry Strategy in Agricultural Nanotechnology Market 2018-2019
Figure 8 Ecosystem Analysis in Agricultural Nanotechnology Market2018
Figure 9 Average Selling Price in Agricultural Nanotechnology Market 2021-2026
Figure 10 Top Opportunites in Agricultural Nanotechnology Market 2018-2019
Figure 11 Market Life Cycle Analysis in Agricultural Nanotechnology Market
Figure 12 GlobalBy ApplicationAgricultural Nanotechnology Market Revenue, 2021-2026 ($)
Figure 13 GlobalBy End UserAgricultural Nanotechnology Market Revenue, 2021-2026 ($)
Figure 14 Global Agricultural Nanotechnology Market - By Geography
Figure 15 Global Agricultural Nanotechnology Market Value & Volume, By Geography, 2021-2026 ($)
Figure 16 Global Agricultural Nanotechnology Market CAGR, By Geography, 2021-2026 (%)
Figure 17 North America Agricultural Nanotechnology Market Value & Volume, 2021-2026 ($)
Figure 18 US Agricultural Nanotechnology Market Value & Volume, 2021-2026 ($)
Figure 19 US GDP and Population, 2018-2019 ($)
Figure 20 US GDP – Composition of 2018, By Sector of Origin
Figure 21 US Export and Import Value & Volume, 2018-2019 ($)
Figure 22 Canada Agricultural Nanotechnology Market Value & Volume, 2021-2026 ($)
Figure 23 Canada GDP and Population, 2018-2019 ($)
Figure 24 Canada GDP – Composition of 2018, By Sector of Origin
Figure 25 Canada Export and Import Value & Volume, 2018-2019 ($)
Figure 26 Mexico Agricultural Nanotechnology Market Value & Volume, 2021-2026 ($)
Figure 27 Mexico GDP and Population, 2018-2019 ($)
Figure 28 Mexico GDP – Composition of 2018, By Sector of Origin
Figure 29 Mexico Export and Import Value & Volume, 2018-2019 ($)
Figure 30 South America Agricultural Nanotechnology MarketSouth America 3D Printing Market Value & Volume, 2021-2026 ($)
Figure 31 Brazil Agricultural Nanotechnology Market Value & Volume, 2021-2026 ($)
Figure 32 Brazil GDP and Population, 2018-2019 ($)
Figure 33 Brazil GDP – Composition of 2018, By Sector of Origin
Figure 34 Brazil Export and Import Value & Volume, 2018-2019 ($)
Figure 35 Venezuela Agricultural Nanotechnology Market Value & Volume, 2021-2026 ($)
Figure 36 Venezuela GDP and Population, 2018-2019 ($)
Figure 37 Venezuela GDP – Composition of 2018, By Sector of Origin
Figure 38 Venezuela Export and Import Value & Volume, 2018-2019 ($)
Figure 39 Argentina Agricultural Nanotechnology Market Value & Volume, 2021-2026 ($)
Figure 40 Argentina GDP and Population, 2018-2019 ($)
Figure 41 Argentina GDP – Composition of 2018, By Sector of Origin
Figure 42 Argentina Export and Import Value & Volume, 2018-2019 ($)
Figure 43 Ecuador Agricultural Nanotechnology Market Value & Volume, 2021-2026 ($)
Figure 44 Ecuador GDP and Population, 2018-2019 ($)
Figure 45 Ecuador GDP – Composition of 2018, By Sector of Origin
Figure 46 Ecuador Export and Import Value & Volume, 2018-2019 ($)
Figure 47 Peru Agricultural Nanotechnology Market Value & Volume, 2021-2026 ($)
Figure 48 Peru GDP and Population, 2018-2019 ($)
Figure 49 Peru GDP – Composition of 2018, By Sector of Origin
Figure 50 Peru Export and Import Value & Volume, 2018-2019 ($)
Figure 51 Colombia Agricultural Nanotechnology Market Value & Volume, 2021-2026 ($)
Figure 52 Colombia GDP and Population, 2018-2019 ($)
Figure 53 Colombia GDP – Composition of 2018, By Sector of Origin
Figure 54 Colombia Export and Import Value & Volume, 2018-2019 ($)
Figure 55 Costa Rica Agricultural Nanotechnology MarketCosta Rica 3D Printing Market Value & Volume, 2021-2026 ($)
Figure 56 Costa Rica GDP and Population, 2018-2019 ($)
Figure 57 Costa Rica GDP – Composition of 2018, By Sector of Origin
Figure 58 Costa Rica Export and Import Value & Volume, 2018-2019 ($)
Figure 59 Europe Agricultural Nanotechnology Market Value & Volume, 2021-2026 ($)
Figure 60 U.K Agricultural Nanotechnology Market Value & Volume, 2021-2026 ($)
Figure 61 U.K GDP and Population, 2018-2019 ($)
Figure 62 U.K GDP – Composition of 2018, By Sector of Origin
Figure 63 U.K Export and Import Value & Volume, 2018-2019 ($)
Figure 64 Germany Agricultural Nanotechnology Market Value & Volume, 2021-2026 ($)
Figure 65 Germany GDP and Population, 2018-2019 ($)
Figure 66 Germany GDP – Composition of 2018, By Sector of Origin
Figure 67 Germany Export and Import Value & Volume, 2018-2019 ($)
Figure 68 Italy Agricultural Nanotechnology Market Value & Volume, 2021-2026 ($)
Figure 69 Italy GDP and Population, 2018-2019 ($)
Figure 70 Italy GDP – Composition of 2018, By Sector of Origin
Figure 71 Italy Export and Import Value & Volume, 2018-2019 ($)
Figure 72 France Agricultural Nanotechnology Market Value & Volume, 2021-2026 ($)
Figure 73 France GDP and Population, 2018-2019 ($)
Figure 74 France GDP – Composition of 2018, By Sector of Origin
Figure 75 France Export and Import Value & Volume, 2018-2019 ($)
Figure 76 Netherlands Agricultural Nanotechnology Market Value & Volume, 2021-2026 ($)
Figure 77 Netherlands GDP and Population, 2018-2019 ($)
Figure 78 Netherlands GDP – Composition of 2018, By Sector of Origin
Figure 79 Netherlands Export and Import Value & Volume, 2018-2019 ($)
Figure 80 Belgium Agricultural Nanotechnology Market Value & Volume, 2021-2026 ($)
Figure 81 Belgium GDP and Population, 2018-2019 ($)
Figure 82 Belgium GDP – Composition of 2018, By Sector of Origin
Figure 83 Belgium Export and Import Value & Volume, 2018-2019 ($)
Figure 84 Spain Agricultural Nanotechnology Market Value & Volume, 2021-2026 ($)
Figure 85 Spain GDP and Population, 2018-2019 ($)
Figure 86 Spain GDP – Composition of 2018, By Sector of Origin
Figure 87 Spain Export and Import Value & Volume, 2018-2019 ($)
Figure 88 Denmark Agricultural Nanotechnology Market Value & Volume, 2021-2026 ($)
Figure 89 Denmark GDP and Population, 2018-2019 ($)
Figure 90 Denmark GDP – Composition of 2018, By Sector of Origin
Figure 91 Denmark Export and Import Value & Volume, 2018-2019 ($)
Figure 92 APAC Agricultural Nanotechnology Market Value & Volume, 2021-2026 ($)
Figure 93 China Agricultural Nanotechnology MarketValue & Volume, 2021-2026
Figure 94 China GDP and Population, 2018-2019 ($)
Figure 95 China GDP – Composition of 2018, By Sector of Origin
Figure 96 China Export and Import Value & Volume, 2018-2019 ($)Agricultural Nanotechnology MarketChina Export and Import Value & Volume, 2018-2019 ($)
Figure 97 Australia Agricultural Nanotechnology Market Value & Volume, 2021-2026 ($)
Figure 98 Australia GDP and Population, 2018-2019 ($)
Figure 99 Australia GDP – Composition of 2018, By Sector of Origin
Figure 100 Australia Export and Import Value & Volume, 2018-2019 ($)
Figure 101 South Korea Agricultural Nanotechnology Market Value & Volume, 2021-2026 ($)
Figure 102 South Korea GDP and Population, 2018-2019 ($)
Figure 103 South Korea GDP – Composition of 2018, By Sector of Origin
Figure 104 South Korea Export and Import Value & Volume, 2018-2019 ($)
Figure 105 India Agricultural Nanotechnology Market Value & Volume, 2021-2026 ($)
Figure 106 India GDP and Population, 2018-2019 ($)
Figure 107 India GDP – Composition of 2018, By Sector of Origin
Figure 108 India Export and Import Value & Volume, 2018-2019 ($)
Figure 109 Taiwan Agricultural Nanotechnology MarketTaiwan 3D Printing Market Value & Volume, 2021-2026 ($)
Figure 110 Taiwan GDP and Population, 2018-2019 ($)
Figure 111 Taiwan GDP – Composition of 2018, By Sector of Origin
Figure 112 Taiwan Export and Import Value & Volume, 2018-2019 ($)
Figure 113 Malaysia Agricultural Nanotechnology MarketMalaysia 3D Printing Market Value & Volume, 2021-2026 ($)
Figure 114 Malaysia GDP and Population, 2018-2019 ($)
Figure 115 Malaysia GDP – Composition of 2018, By Sector of Origin
Figure 116 Malaysia Export and Import Value & Volume, 2018-2019 ($)
Figure 117 Hong Kong Agricultural Nanotechnology MarketHong Kong 3D Printing Market Value & Volume, 2021-2026 ($)
Figure 118 Hong Kong GDP and Population, 2018-2019 ($)
Figure 119 Hong Kong GDP – Composition of 2018, By Sector of Origin
Figure 120 Hong Kong Export and Import Value & Volume, 2018-2019 ($)
Figure 121 Middle East & Africa Agricultural Nanotechnology MarketMiddle East & Africa 3D Printing Market Value & Volume, 2021-2026 ($)
Figure 122 Russia Agricultural Nanotechnology MarketRussia 3D Printing Market Value & Volume, 2021-2026 ($)
Figure 123 Russia GDP and Population, 2018-2019 ($)
Figure 124 Russia GDP – Composition of 2018, By Sector of Origin
Figure 125 Russia Export and Import Value & Volume, 2018-2019 ($)
Figure 126 Israel Agricultural Nanotechnology Market Value & Volume, 2021-2026 ($)
Figure 127 Israel GDP and Population, 2018-2019 ($)
Figure 128 Israel GDP – Composition of 2018, By Sector of Origin
Figure 129 Israel Export and Import Value & Volume, 2018-2019 ($)
Figure 130 Entropy Share, By Strategies, 2018-2019* (%)Agricultural Nanotechnology Market
Figure 131 Developments, 2018-2019*Agricultural Nanotechnology Market
Figure 132 Company 1 Agricultural Nanotechnology Market Net Revenue, By Years, 2018-2019* ($)
Figure 133 Company 1 Agricultural Nanotechnology Market Net Revenue Share, By Business segments, 2018 (%)
Figure 134 Company 1 Agricultural Nanotechnology Market Net Sales Share, By Geography, 2018 (%)
Figure 135 Company 2 Agricultural Nanotechnology Market Net Revenue, By Years, 2018-2019* ($)
Figure 136 Company 2 Agricultural Nanotechnology Market Net Revenue Share, By Business segments, 2018 (%)
Figure 137 Company 2 Agricultural Nanotechnology Market Net Sales Share, By Geography, 2018 (%)
Figure 138 Company 3Agricultural Nanotechnology Market Net Revenue, By Years, 2018-2019* ($)
Figure 139 Company 3Agricultural Nanotechnology Market Net Revenue Share, By Business segments, 2018 (%)
Figure 140 Company 3Agricultural Nanotechnology Market Net Sales Share, By Geography, 2018 (%)
Figure 141 Company 4 Agricultural Nanotechnology Market Net Revenue, By Years, 2018-2019* ($)
Figure 142 Company 4 Agricultural Nanotechnology Market Net Revenue Share, By Business segments, 2018 (%)
Figure 143 Company 4 Agricultural Nanotechnology Market Net Sales Share, By Geography, 2018 (%)
Figure 144 Company 5 Agricultural Nanotechnology Market Net Revenue, By Years, 2018-2019* ($)
Figure 145 Company 5 Agricultural Nanotechnology Market Net Revenue Share, By Business segments, 2018 (%)
Figure 146 Company 5 Agricultural Nanotechnology Market Net Sales Share, By Geography, 2018 (%)
Figure 147 Company 6 Agricultural Nanotechnology Market Net Revenue, By Years, 2018-2019* ($)
Figure 148 Company 6 Agricultural Nanotechnology Market Net Revenue Share, By Business segments, 2018 (%)
Figure 149 Company 6 Agricultural Nanotechnology Market Net Sales Share, By Geography, 2018 (%)
Figure 150 Company 7 Agricultural Nanotechnology Market Net Revenue, By Years, 2018-2019* ($)
Figure 151 Company 7 Agricultural Nanotechnology Market Net Revenue Share, By Business segments, 2018 (%)
Figure 152 Company 7 Agricultural Nanotechnology Market Net Sales Share, By Geography, 2018 (%)
Figure 153 Company 8 Agricultural Nanotechnology Market Net Revenue, By Years, 2018-2019* ($)
Figure 154 Company 8 Agricultural Nanotechnology Market Net Revenue Share, By Business segments, 2018 (%)
Figure 155 Company 8 Agricultural Nanotechnology Market Net Sales Share, By Geography, 2018 (%)
Figure 156 Company 9 Agricultural Nanotechnology Market Net Revenue, By Years, 2018-2019* ($)
Figure 157 Company 9 Agricultural Nanotechnology Market Net Revenue Share, By Business segments, 2018 (%)
Figure 158 Company 9 Agricultural Nanotechnology Market Net Sales Share, By Geography, 2018 (%)
Figure 159 Company 10 Agricultural Nanotechnology Market Net Revenue, By Years, 2018-2019* ($)
Figure 160 Company 10 Agricultural Nanotechnology Market Net Revenue Share, By Business segments, 2018 (%)
Figure 161 Company 10 Agricultural Nanotechnology Market Net Sales Share, By Geography, 2018 (%)
Figure 162 Company 11 Agricultural Nanotechnology Market Net Revenue, By Years, 2018-2019* ($)
Figure 163 Company 11 Agricultural Nanotechnology Market Net Revenue Share, By Business segments, 2018 (%)
Figure 164 Company 11 Agricultural Nanotechnology Market Net Sales Share, By Geography, 2018 (%)
Figure 165 Company 12 Agricultural Nanotechnology Market Net Revenue, By Years, 2018-2019* ($)
Figure 166 Company 12 Agricultural Nanotechnology Market Net Revenue Share, By Business segments, 2018 (%)
Figure 167 Company 12 Agricultural Nanotechnology Market Net Sales Share, By Geography, 2018 (%)
Figure 168 Company 13Agricultural Nanotechnology Market Net Revenue, By Years, 2018-2019* ($)
Figure 169 Company 13Agricultural Nanotechnology Market Net Revenue Share, By Business segments, 2018 (%)
Figure 170 Company 13Agricultural Nanotechnology Market Net Sales Share, By Geography, 2018 (%)
Figure 171 Company 14 Agricultural Nanotechnology Market Net Revenue, By Years, 2018-2019* ($)
Figure 172 Company 14 Agricultural Nanotechnology Market Net Revenue Share, By Business segments, 2018 (%)
Figure 173 Company 14 Agricultural Nanotechnology Market Net Sales Share, By Geography, 2018 (%)
Figure 174 Company 15 Agricultural Nanotechnology Market Net Revenue, By Years, 2018-2019* ($)
Figure 175 Company 15 Agricultural Nanotechnology Market Net Revenue Share, By Business segments, 2018 (%)
Figure 176 Company 15 Agricultural Nanotechnology Market Net Sales Share, By Geography, 2018 (%)