 Email
Email Print
Print


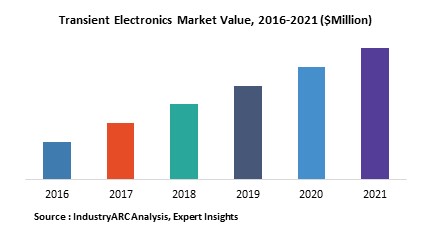
Transient Electronics Market - Forecast(2024 - 2030)
Transient electronics refers to an emerging class of electronics with distinct characteristics that can be absolutely recycled within a programmed period of time. Moreover, no harmful byproducts are released, these electronics can be used in the human body as a diagnostic tool, and many other applications. Currently, researchers are making efforts to create a special degradable polymer composite materials that provide a suitable platform for electronic devices and its components across the various industry verticals.
Transient electronics market has been segmented by components, and end user industry. Based on the components the market is segmented into transistors, diodes, inductors, capacitors, resistors, polymer substrates, and others. On the basis of end use applications, the market is classified into healthcare, consumer electronics, defense, and others. Increasing demands for the prevention of sensitive data leakage, the reduction of electronic waste, and the elimination of additional surgery to remove electronic implants are the major factors impacting the market growth during the forecast period.
This eco-friendly technology is expected to bring a revolutionary change in electronic recycling sector and application of transient electronics in healthcare implants is creating a huge opportunity for the growth of market. Increasing need for environment friendly solutions, and emerging applications are the prime growth drivers of global transient electronics market. However, safety & commercialization issues are key restraints for global transient electronics market. Rising sophistication technologies across various end user industries is also one of the factors driving the transient electronics market across the globe.
The overall market is also presented from the perspective of different geographic regions and the key countries in each region. North America is the dominating market which held a major revenue share in 2017 and is estimated as fastest growing market during the forecast period, mainly driven by rising demand for technological developments across the healthcare industry.
Sample Companies Profiled in this Report are:
- American Association for the Advancement of Science
- University of Illinois Urbana-Champaign
- Defense Advanced Research Projects Agency
- The Small Business Innovation Research
- 10+
The methodology for estimating the transient electronics market involved demand in the various industries. The segmentations have been cross-mapped extensively to understand various market dynamics. Simultaneously, the companies involved at integration and distribution level were also studied from the perspective of their services, geographical presence, annual turnover and few other parameters to substantiate the estimations. All these estimations were further validated through primary research and industry experts.
1. Transient Electronics – Market Overview
1.1. Introduction
1.2. Market Scope
1.3. Stakeholders
2. Transient Electronics Market – Executive Summary
3. Transient Electronics Market – Market Landscape
3.1. Market Share Analysis
3.1.1. Comprehensive Market Share Analysis
3.2. Comparative Analysis
3.2.1. Competitor Benchmarking
3.2.2. Competitor Financial Analysis
3.2.3. Patent Analysis
3.2.4. End-User Profiling
4. Transient Electronics Market– Market Forces
4.1. Market Drivers
4.1.1. Need for Environment Friendly Solutions
4.1.2. Increasing Spending for Healthcare & Defense
4.2. Market Constraints
4.2.1. Safety & Commercialization Issues
4.3. Market Challenges
4.4. Attractiveness of the Transient Electronics Market Industry
4.4.1. Power of Suppliers
4.4.2. Power of Customers
4.4.3. Threat of New entrants
4.4.4. Threat of Substitution
4.4.5. Degree of Competition
5. Transient Electronics Market– Strategic Analysis
5.1. Value Chain Analysis
5.2. Pricing Analysis
5.2.1. Influence Factor Analysis
5.2.2. Forecast of Prices
5.3. Opportunities Analysis
5.4. Life Cycle Analysis
5.5. Suppliers & Distributers
6. Transient Electronics Market– By Components
6.1. Introduction
6.2. Transistors
6.3. Diodes
6.4. Inductors
6.5. Capacitors
6.6. Resistors
6.7. Polymer Substrate
6.7.1. Silicon
6.7.2. Magnesium
6.8. Others
7. Transient Electronics Market– By End User Industry
7.1. Introduction
7.2. Healthcare
7.2.1. Intravascular Stents
7.2.2. Porous Bodies
7.2.3. Patient Monitors
7.2.4. Sutures
7.2.5. Others
7.3. Defense (Protection for Harsh Environment)
7.4. Others
8. Transient Electronics Market– By Geography
8.1. Introduction
8.2. North America
8.2.1. U.S.
8.2.2. Canada
8.2.3. Mexico
8.3. Europe
8.3.1. Germany
8.3.2. U.K.
8.3.3. France
8.3.4. Italy
8.3.5. Rest of Europe
8.4. Asia-Pacific
8.4.1. China
8.4.2. South Korea
8.4.3. Japan
8.4.4. India
8.4.5. Australia & New Zealand
8.4.6. Rest of Asia-Pacific
8.5. RoW
8.5.1. Middle-East & Africa
8.5.2. Brazil
9. Market Entropy
9.1. Introduction
9.2. Most Dominant Strategy
9.3. Mergers, Agreements & Partnerships
9.4. Acquisitions and Others
10. Company Profiles
10.1. Company 1
10.2. Company 2
10.3. Company 3
10.4. Company 4
10.5. Company 5
10.6. Company 6
10.7. Company 7
10.8. Company 8
10.9. Company 9
10.10. Company 10
*More than 10 Companies are profiled in this Research Report*
"*Financials would be provided on a best efforts basis for private companies"
11. Appendix
11.1. Abbreviations
11.2. Sources
11.3. Research Methodology
11.4. Bibliography
11.5. Compilation of Experts
11.6. Disclaimer
List of Tables
Table 1 Transient Electronics Market Overview 2021-2026
Table 2 Transient Electronics Market Leader Analysis 2018-2019 (US$)
Table 3 Transient Electronics MarketProduct Analysis 2018-2019 (US$)
Table 4 Transient Electronics MarketEnd User Analysis 2018-2019 (US$)
Table 5 Transient Electronics MarketPatent Analysis 2013-2018* (US$)
Table 6 Transient Electronics MarketFinancial Analysis 2018-2019 (US$)
Table 7 Transient Electronics Market Driver Analysis 2018-2019 (US$)
Table 8 Transient Electronics MarketChallenges Analysis 2018-2019 (US$)
Table 9 Transient Electronics MarketConstraint Analysis 2018-2019 (US$)
Table 10 Transient Electronics Market Supplier Bargaining Power Analysis 2018-2019 (US$)
Table 11 Transient Electronics Market Buyer Bargaining Power Analysis 2018-2019 (US$)
Table 12 Transient Electronics Market Threat of Substitutes Analysis 2018-2019 (US$)
Table 13 Transient Electronics Market Threat of New Entrants Analysis 2018-2019 (US$)
Table 14 Transient Electronics Market Degree of Competition Analysis 2018-2019 (US$)
Table 15 Transient Electronics MarketValue Chain Analysis 2018-2019 (US$)
Table 16 Transient Electronics MarketPricing Analysis 2021-2026 (US$)
Table 17 Transient Electronics MarketOpportunities Analysis 2021-2026 (US$)
Table 18 Transient Electronics MarketProduct Life Cycle Analysis 2021-2026 (US$)
Table 19 Transient Electronics MarketSupplier Analysis 2018-2019 (US$)
Table 20 Transient Electronics MarketDistributor Analysis 2018-2019 (US$)
Table 21 Transient Electronics Market Trend Analysis 2018-2019 (US$)
Table 22 Transient Electronics Market Size 2018 (US$)
Table 23 Transient Electronics Market Forecast Analysis 2021-2026 (US$)
Table 24 Transient Electronics Market Sales Forecast Analysis 2021-2026 (Units)
Table 25 Transient Electronics Market, Revenue & Volume,By Components, 2021-2026 ($)
Table 26 Transient Electronics MarketBy Components, Revenue & Volume,By Transistors, 2021-2026 ($)
Table 27 Transient Electronics MarketBy Components, Revenue & Volume,By Diodes, 2021-2026 ($)
Table 28 Transient Electronics MarketBy Components, Revenue & Volume,By Inductors, 2021-2026 ($)
Table 29 Transient Electronics MarketBy Components, Revenue & Volume,By Capacitors, 2021-2026 ($)
Table 30 Transient Electronics MarketBy Components, Revenue & Volume,By Resistors, 2021-2026 ($)
Table 31 Transient Electronics Market, Revenue & Volume,By End User Industry, 2021-2026 ($)
Table 32 Transient Electronics MarketBy End User Industry, Revenue & Volume,By Healthcare, 2021-2026 ($)
Table 33 Transient Electronics MarketBy End User Industry, Revenue & Volume,By Defense, 2021-2026 ($)
Table 34 North America Transient Electronics Market, Revenue & Volume,By Components, 2021-2026 ($)
Table 35 North America Transient Electronics Market, Revenue & Volume,By End User Industry, 2021-2026 ($)
Table 36 South america Transient Electronics Market, Revenue & Volume,By Components, 2021-2026 ($)
Table 37 South america Transient Electronics Market, Revenue & Volume,By End User Industry, 2021-2026 ($)
Table 38 Europe Transient Electronics Market, Revenue & Volume,By Components, 2021-2026 ($)
Table 39 Europe Transient Electronics Market, Revenue & Volume,By End User Industry, 2021-2026 ($)
Table 40 APAC Transient Electronics Market, Revenue & Volume,By Components, 2021-2026 ($)
Table 41 APAC Transient Electronics Market, Revenue & Volume,By End User Industry, 2021-2026 ($)
Table 42 Middle East & Africa Transient Electronics Market, Revenue & Volume,By Components, 2021-2026 ($)
Table 43 Middle East & Africa Transient Electronics Market, Revenue & Volume,By End User Industry, 2021-2026 ($)
Table 44 Russia Transient Electronics Market, Revenue & Volume,By Components, 2021-2026 ($)
Table 45 Russia Transient Electronics Market, Revenue & Volume,By End User Industry, 2021-2026 ($)
Table 46 Israel Transient Electronics Market, Revenue & Volume,By Components, 2021-2026 ($)
Table 47 Israel Transient Electronics Market, Revenue & Volume,By End User Industry, 2021-2026 ($)
Table 48 Top Companies 2018 (US$)Transient Electronics Market, Revenue & Volume,,
Table 49 Product Launch 2018-2019Transient Electronics Market, Revenue & Volume,,
Table 50 Mergers & Acquistions 2018-2019Transient Electronics Market, Revenue & Volume,,
List of Figures
Figure 1 Overview of Transient Electronics Market 2021-2026
Figure 2 Market Share Analysis for Transient Electronics Market 2018 (US$)
Figure 3 Product Comparison in Transient Electronics Market 2018-2019 (US$)
Figure 4 End User Profile for Transient Electronics Market 2018-2019 (US$)
Figure 5 Patent Application and Grant in Transient Electronics Market 2013-2018* (US$)
Figure 6 Top 5 Companies Financial Analysis in Transient Electronics Market 2018-2019 (US$)
Figure 7 Market Entry Strategy in Transient Electronics Market 2018-2019
Figure 8 Ecosystem Analysis in Transient Electronics Market2018
Figure 9 Average Selling Price in Transient Electronics Market 2021-2026
Figure 10 Top Opportunites in Transient Electronics Market 2018-2019
Figure 11 Market Life Cycle Analysis in Transient Electronics Market
Figure 12 GlobalBy ComponentsTransient Electronics Market Revenue, 2021-2026 ($)
Figure 13 GlobalBy End User IndustryTransient Electronics Market Revenue, 2021-2026 ($)
Figure 14 Global Transient Electronics Market - By Geography
Figure 15 Global Transient Electronics Market Value & Volume, By Geography, 2021-2026 ($)
Figure 16 Global Transient Electronics Market CAGR, By Geography, 2021-2026 (%)
Figure 17 North America Transient Electronics Market Value & Volume, 2021-2026 ($)
Figure 18 US Transient Electronics Market Value & Volume, 2021-2026 ($)
Figure 19 US GDP and Population, 2018-2019 ($)
Figure 20 US GDP – Composition of 2018, By Sector of Origin
Figure 21 US Export and Import Value & Volume, 2018-2019 ($)
Figure 22 Canada Transient Electronics Market Value & Volume, 2021-2026 ($)
Figure 23 Canada GDP and Population, 2018-2019 ($)
Figure 24 Canada GDP – Composition of 2018, By Sector of Origin
Figure 25 Canada Export and Import Value & Volume, 2018-2019 ($)
Figure 26 Mexico Transient Electronics Market Value & Volume, 2021-2026 ($)
Figure 27 Mexico GDP and Population, 2018-2019 ($)
Figure 28 Mexico GDP – Composition of 2018, By Sector of Origin
Figure 29 Mexico Export and Import Value & Volume, 2018-2019 ($)
Figure 30 South America Transient Electronics MarketSouth America 3D Printing Market Value & Volume, 2021-2026 ($)
Figure 31 Brazil Transient Electronics Market Value & Volume, 2021-2026 ($)
Figure 32 Brazil GDP and Population, 2018-2019 ($)
Figure 33 Brazil GDP – Composition of 2018, By Sector of Origin
Figure 34 Brazil Export and Import Value & Volume, 2018-2019 ($)
Figure 35 Venezuela Transient Electronics Market Value & Volume, 2021-2026 ($)
Figure 36 Venezuela GDP and Population, 2018-2019 ($)
Figure 37 Venezuela GDP – Composition of 2018, By Sector of Origin
Figure 38 Venezuela Export and Import Value & Volume, 2018-2019 ($)
Figure 39 Argentina Transient Electronics Market Value & Volume, 2021-2026 ($)
Figure 40 Argentina GDP and Population, 2018-2019 ($)
Figure 41 Argentina GDP – Composition of 2018, By Sector of Origin
Figure 42 Argentina Export and Import Value & Volume, 2018-2019 ($)
Figure 43 Ecuador Transient Electronics Market Value & Volume, 2021-2026 ($)
Figure 44 Ecuador GDP and Population, 2018-2019 ($)
Figure 45 Ecuador GDP – Composition of 2018, By Sector of Origin
Figure 46 Ecuador Export and Import Value & Volume, 2018-2019 ($)
Figure 47 Peru Transient Electronics Market Value & Volume, 2021-2026 ($)
Figure 48 Peru GDP and Population, 2018-2019 ($)
Figure 49 Peru GDP – Composition of 2018, By Sector of Origin
Figure 50 Peru Export and Import Value & Volume, 2018-2019 ($)
Figure 51 Colombia Transient Electronics Market Value & Volume, 2021-2026 ($)
Figure 52 Colombia GDP and Population, 2018-2019 ($)
Figure 53 Colombia GDP – Composition of 2018, By Sector of Origin
Figure 54 Colombia Export and Import Value & Volume, 2018-2019 ($)
Figure 55 Costa Rica Transient Electronics MarketCosta Rica 3D Printing Market Value & Volume, 2021-2026 ($)
Figure 56 Costa Rica GDP and Population, 2018-2019 ($)
Figure 57 Costa Rica GDP – Composition of 2018, By Sector of Origin
Figure 58 Costa Rica Export and Import Value & Volume, 2018-2019 ($)
Figure 59 Europe Transient Electronics Market Value & Volume, 2021-2026 ($)
Figure 60 U.K Transient Electronics Market Value & Volume, 2021-2026 ($)
Figure 61 U.K GDP and Population, 2018-2019 ($)
Figure 62 U.K GDP – Composition of 2018, By Sector of Origin
Figure 63 U.K Export and Import Value & Volume, 2018-2019 ($)
Figure 64 Germany Transient Electronics Market Value & Volume, 2021-2026 ($)
Figure 65 Germany GDP and Population, 2018-2019 ($)
Figure 66 Germany GDP – Composition of 2018, By Sector of Origin
Figure 67 Germany Export and Import Value & Volume, 2018-2019 ($)
Figure 68 Italy Transient Electronics Market Value & Volume, 2021-2026 ($)
Figure 69 Italy GDP and Population, 2018-2019 ($)
Figure 70 Italy GDP – Composition of 2018, By Sector of Origin
Figure 71 Italy Export and Import Value & Volume, 2018-2019 ($)
Figure 72 France Transient Electronics Market Value & Volume, 2021-2026 ($)
Figure 73 France GDP and Population, 2018-2019 ($)
Figure 74 France GDP – Composition of 2018, By Sector of Origin
Figure 75 France Export and Import Value & Volume, 2018-2019 ($)
Figure 76 Netherlands Transient Electronics Market Value & Volume, 2021-2026 ($)
Figure 77 Netherlands GDP and Population, 2018-2019 ($)
Figure 78 Netherlands GDP – Composition of 2018, By Sector of Origin
Figure 79 Netherlands Export and Import Value & Volume, 2018-2019 ($)
Figure 80 Belgium Transient Electronics Market Value & Volume, 2021-2026 ($)
Figure 81 Belgium GDP and Population, 2018-2019 ($)
Figure 82 Belgium GDP – Composition of 2018, By Sector of Origin
Figure 83 Belgium Export and Import Value & Volume, 2018-2019 ($)
Figure 84 Spain Transient Electronics Market Value & Volume, 2021-2026 ($)
Figure 85 Spain GDP and Population, 2018-2019 ($)
Figure 86 Spain GDP – Composition of 2018, By Sector of Origin
Figure 87 Spain Export and Import Value & Volume, 2018-2019 ($)
Figure 88 Denmark Transient Electronics Market Value & Volume, 2021-2026 ($)
Figure 89 Denmark GDP and Population, 2018-2019 ($)
Figure 90 Denmark GDP – Composition of 2018, By Sector of Origin
Figure 91 Denmark Export and Import Value & Volume, 2018-2019 ($)
Figure 92 APAC Transient Electronics Market Value & Volume, 2021-2026 ($)
Figure 93 China Transient Electronics MarketValue & Volume, 2021-2026
Figure 94 China GDP and Population, 2018-2019 ($)
Figure 95 China GDP – Composition of 2018, By Sector of Origin
Figure 96 China Export and Import Value & Volume, 2018-2019 ($)Transient Electronics MarketChina Export and Import Value & Volume, 2018-2019 ($)
Figure 97 Australia Transient Electronics Market Value & Volume, 2021-2026 ($)
Figure 98 Australia GDP and Population, 2018-2019 ($)
Figure 99 Australia GDP – Composition of 2018, By Sector of Origin
Figure 100 Australia Export and Import Value & Volume, 2018-2019 ($)
Figure 101 South Korea Transient Electronics Market Value & Volume, 2021-2026 ($)
Figure 102 South Korea GDP and Population, 2018-2019 ($)
Figure 103 South Korea GDP – Composition of 2018, By Sector of Origin
Figure 104 South Korea Export and Import Value & Volume, 2018-2019 ($)
Figure 105 India Transient Electronics Market Value & Volume, 2021-2026 ($)
Figure 106 India GDP and Population, 2018-2019 ($)
Figure 107 India GDP – Composition of 2018, By Sector of Origin
Figure 108 India Export and Import Value & Volume, 2018-2019 ($)
Figure 109 Taiwan Transient Electronics MarketTaiwan 3D Printing Market Value & Volume, 2021-2026 ($)
Figure 110 Taiwan GDP and Population, 2018-2019 ($)
Figure 111 Taiwan GDP – Composition of 2018, By Sector of Origin
Figure 112 Taiwan Export and Import Value & Volume, 2018-2019 ($)
Figure 113 Malaysia Transient Electronics MarketMalaysia 3D Printing Market Value & Volume, 2021-2026 ($)
Figure 114 Malaysia GDP and Population, 2018-2019 ($)
Figure 115 Malaysia GDP – Composition of 2018, By Sector of Origin
Figure 116 Malaysia Export and Import Value & Volume, 2018-2019 ($)
Figure 117 Hong Kong Transient Electronics MarketHong Kong 3D Printing Market Value & Volume, 2021-2026 ($)
Figure 118 Hong Kong GDP and Population, 2018-2019 ($)
Figure 119 Hong Kong GDP – Composition of 2018, By Sector of Origin
Figure 120 Hong Kong Export and Import Value & Volume, 2018-2019 ($)
Figure 121 Middle East & Africa Transient Electronics MarketMiddle East & Africa 3D Printing Market Value & Volume, 2021-2026 ($)
Figure 122 Russia Transient Electronics MarketRussia 3D Printing Market Value & Volume, 2021-2026 ($)
Figure 123 Russia GDP and Population, 2018-2019 ($)
Figure 124 Russia GDP – Composition of 2018, By Sector of Origin
Figure 125 Russia Export and Import Value & Volume, 2018-2019 ($)
Figure 126 Israel Transient Electronics Market Value & Volume, 2021-2026 ($)
Figure 127 Israel GDP and Population, 2018-2019 ($)
Figure 128 Israel GDP – Composition of 2018, By Sector of Origin
Figure 129 Israel Export and Import Value & Volume, 2018-2019 ($)
Figure 130 Entropy Share, By Strategies, 2018-2019* (%)Transient Electronics Market
Figure 131 Developments, 2018-2019*Transient Electronics Market
Figure 132 Company 1 Transient Electronics Market Net Revenue, By Years, 2018-2019* ($)
Figure 133 Company 1 Transient Electronics Market Net Revenue Share, By Business segments, 2018 (%)
Figure 134 Company 1 Transient Electronics Market Net Sales Share, By Geography, 2018 (%)
Figure 135 Company 2 Transient Electronics Market Net Revenue, By Years, 2018-2019* ($)
Figure 136 Company 2 Transient Electronics Market Net Revenue Share, By Business segments, 2018 (%)
Figure 137 Company 2 Transient Electronics Market Net Sales Share, By Geography, 2018 (%)
Figure 138 Company 3Transient Electronics Market Net Revenue, By Years, 2018-2019* ($)
Figure 139 Company 3Transient Electronics Market Net Revenue Share, By Business segments, 2018 (%)
Figure 140 Company 3Transient Electronics Market Net Sales Share, By Geography, 2018 (%)
Figure 141 Company 4 Transient Electronics Market Net Revenue, By Years, 2018-2019* ($)
Figure 142 Company 4 Transient Electronics Market Net Revenue Share, By Business segments, 2018 (%)
Figure 143 Company 4 Transient Electronics Market Net Sales Share, By Geography, 2018 (%)
Figure 144 Company 5 Transient Electronics Market Net Revenue, By Years, 2018-2019* ($)
Figure 145 Company 5 Transient Electronics Market Net Revenue Share, By Business segments, 2018 (%)
Figure 146 Company 5 Transient Electronics Market Net Sales Share, By Geography, 2018 (%)
Figure 147 Company 6 Transient Electronics Market Net Revenue, By Years, 2018-2019* ($)
Figure 148 Company 6 Transient Electronics Market Net Revenue Share, By Business segments, 2018 (%)
Figure 149 Company 6 Transient Electronics Market Net Sales Share, By Geography, 2018 (%)
Figure 150 Company 7 Transient Electronics Market Net Revenue, By Years, 2018-2019* ($)
Figure 151 Company 7 Transient Electronics Market Net Revenue Share, By Business segments, 2018 (%)
Figure 152 Company 7 Transient Electronics Market Net Sales Share, By Geography, 2018 (%)
Figure 153 Company 8 Transient Electronics Market Net Revenue, By Years, 2018-2019* ($)
Figure 154 Company 8 Transient Electronics Market Net Revenue Share, By Business segments, 2018 (%)
Figure 155 Company 8 Transient Electronics Market Net Sales Share, By Geography, 2018 (%)
Figure 156 Company 9 Transient Electronics Market Net Revenue, By Years, 2018-2019* ($)
Figure 157 Company 9 Transient Electronics Market Net Revenue Share, By Business segments, 2018 (%)
Figure 158 Company 9 Transient Electronics Market Net Sales Share, By Geography, 2018 (%)
Figure 159 Company 10 Transient Electronics Market Net Revenue, By Years, 2018-2019* ($)
Figure 160 Company 10 Transient Electronics Market Net Revenue Share, By Business segments, 2018 (%)
Figure 161 Company 10 Transient Electronics Market Net Sales Share, By Geography, 2018 (%)
Figure 162 Company 11 Transient Electronics Market Net Revenue, By Years, 2018-2019* ($)
Figure 163 Company 11 Transient Electronics Market Net Revenue Share, By Business segments, 2018 (%)
Figure 164 Company 11 Transient Electronics Market Net Sales Share, By Geography, 2018 (%)
Figure 165 Company 12 Transient Electronics Market Net Revenue, By Years, 2018-2019* ($)
Figure 166 Company 12 Transient Electronics Market Net Revenue Share, By Business segments, 2018 (%)
Figure 167 Company 12 Transient Electronics Market Net Sales Share, By Geography, 2018 (%)
Figure 168 Company 13Transient Electronics Market Net Revenue, By Years, 2018-2019* ($)
Figure 169 Company 13Transient Electronics Market Net Revenue Share, By Business segments, 2018 (%)
Figure 170 Company 13Transient Electronics Market Net Sales Share, By Geography, 2018 (%)
Figure 171 Company 14 Transient Electronics Market Net Revenue, By Years, 2018-2019* ($)
Figure 172 Company 14 Transient Electronics Market Net Revenue Share, By Business segments, 2018 (%)
Figure 173 Company 14 Transient Electronics Market Net Sales Share, By Geography, 2018 (%)
Figure 174 Company 15 Transient Electronics Market Net Revenue, By Years, 2018-2019* ($)
Figure 175 Company 15 Transient Electronics Market Net Revenue Share, By Business segments, 2018 (%)
Figure 176 Company 15 Transient Electronics Market Net Sales Share, By Geography, 2018 (%)