 Email
Email Print
Print


Food Waste Management Market - Forecast(2024 - 2030)
Food Waste Management Market Overview:
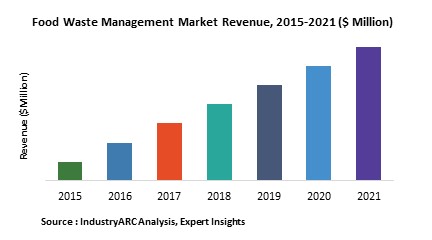
According to a survey conducted by the Food and Agriculture Organization of the United Nations, approximately one third of the food for human consumption, equivalent to 1.3 billion tones, that is produced in the world gets either wasted intentionally or lost during supply chain management. Approximately $680 billion is unnecessarily wasted every year in food waste, out of which $310 billion gets wasted in developing countries.[1] Food wastage is a serious problem that requires immediate attention, which is why the market for food waste management has attained considerable growth in the recent past. Governments have started a number of initiatives by joining hands with engineering firms as the latter invest in research and development of food waste management machinery. The food waste management market has gained noticeable support from environment conservation experts from all over the world since it helps fight climate change. These factors collectively helped the food waste management market to generate $29 billion in revenue in 2018. The market is further evaluated to grow at a compound annual growth rate (CAGR) of 5.30% through 2025.
There are seven different kinds of disposal methods that are a part of the food waste management market: landfills and greenhouse gases, animal feed, composting, anaerobic digestion, commercial liquid food waste, agricultural food waste, and cockroach feeding. Anaerobic digestion is the most commercially and residentially used method of food wastage, which is why this application segment is evaluated to grow at a CAGR of 5.60% through 2025.
Food Waste Management Market Growth Drivers:
Ø Unwanted Dumps In Urban Landscapes
With an incessantly rising population and a consistent increase in disposable income, every single residential household is generating more waste than expected. This humongous amount of garbage is being dumped in open landfills, which is causing unwanted piles of bacteria-inviting and disease spreading refuse. This has been a relentless debate topic for city planners and governments, which collectively need to introduce food waste management at a residential and commercial level, thereby providing growth to the market.
Food Waste Management Market Key Players Perspective:
Some of the most noticeable food waste management trends have occurred in European countries including the U.K., Denmark, Hungary, and the Netherlands. Sweden has been felicitated globally for being a leader in food waste management, with its recent efforts to import waste from other countries in order to convert it to biogas. This has led Europe to lead the food waste management market geographically, holding a 40% share of the global market in 2018.
Some of the key market players operating in the food waste management market are Veolia Environnement, Waste Management, Inc., Republic Services, Inc., Stericycle, Inc., Stericycle, Inc., Quest Recycling Services, Liquid Environmental Solutions, Panda Envirovnmental Services Inc., and Recology Inc.
Waste Management, Inc. is a global leader of this market with a 99.99% accuracy of food waste pickup. It provides solutions for both residential and commercial purposes.
Food Waste Management Market Trends:
With an incessant rise in global warming plaguing the natural resources, climate, and ecosystems of the Earth and a lot of people lacking time and efforts from their end to implement food waste management, technology companies have introduced finer ways to reduce food wastage.
Ø BluWrap
BlueWrap is a wrap that is used for storing fish, meat, and other products. It has built-in fuel cells that carefully monitor the temperature and air level inside the packets, thus extending the shelf life of the product.
Ø Copia
Copia is a company that has invented an app for connecting culinary businesses such as restaurants, hotels, hospitals, and others with local shelters in order to give away excess food to hungry people. This massively helps in reduction of food wastage.
Food Waste Management Market Research Scope
The base year of the study is 2018, with forecast done up to 2025. The study presents a thorough analysis of the competitive landscape, taking into account the market shares of the leading companies. It also provides information on unit shipments. These provide the key market participants with the necessary business intelligence and help them understand the future of the Liqueurs Market. The assessment includes the forecast, an overview of the competitive structure, the market shares of the competitors, as well as the market trends, market demands, market drivers, market challenges, and product analysis. The market drivers and restraints have been assessed to fathom their impact over the forecast period. This report further identifies the key opportunities for growth while also detailing the key challenges and possible threats. The key areas of focus include the types of food waste management systems and their specific applications.
Food Waste Management Market Report: Industry Coverage
The food waste management market can be segmented based on method and end user. By method, the market can be sub-segmented into prevention, redistribution, recycling, recovery, and disposal. And based on end user, the market can be fragmented into primary producers, food manufacturers, wholesale and logistic, retail, food service providers, and household.
The Food Waste Management Market report also analyzes the major geographic regions for the market as well as the major countries for the market in these regions. The regions and countries covered in the study include:
• North America: The U.S., Canada, Mexico
• South America: Brazil, Venezuela, Argentina, Ecuador, Peru, Colombia, Costa Rica
• Europe: The U.K., Germany, Italy, France, The Netherlands, Belgium, Spain, Denmark
• APAC: China, Japan, Australia, South Korea, India, Taiwan, Malaysia, Hong Kong
• Middle East and Africa: Israel, South Africa, Saudi Arabia
Reference:
[1] http://www.fao.org
For
more Food and Beverages related
reports, please click
here
2. Global Food Waste Management Market Executive Summary
3. Global Food Waste Management Market Landscape
3.1. Market Share Analysis
3.2. Comparative Analysis
3.2.1. Product Benchmarking
3.2.2. End User Profiling
3.2.3. Patent Analysis
3.2.4. Top 5 Financials
4. Global Food Waste Management Market Forces
4.1. Market Drivers
4.2. Market Challenges
4.3. Market Constraints
4.4. Attractiveness of Food Waste Management Market
4.4.1. Power of Suppliers
4.4.2. Threats From New Entrants
4.4.3. Power of Buyer
4.4.4. Threat From Substitute Product
4.4.5. Degree of Competition
5. Global Food Waste Management Market-Strategic Analysis
5.1. Value Chain Analysis
5.2. Pricing Analysis
5.3. Product Life Cycle
5.4. Suppliers and Distributors
5.5. Opportunity Analysis
6. Global Food Waste Management Market- By End User
6.1. Introduction
6.2. Primary Producers
6.3. Food Manufacturers
6.4. Wholesale and Logistics
6.5. Retail and Markets
6.6. Food service Providers
6.7. Household
7. Global Food Waste Management Market-By Method
7.1. Prevention
7.2. Redistribution
7.3. Recycling
7.4. Recovery
7.5. Disposal
7.6. Others
9. Global Food Waste Management Market - By Geography
9.1. North America
9.1.1. U.S.
9.1.2. Canada
9.1.3. Mexico
9.2. Europe
9.2.1. U.K.
9.2.2. Germany
9.2.3. Italy
9.2.4. France
9.2.5. Spain
9.2.6. Rest of Europe
9.3. Asia Pacific (APAC)
9.3.1. China
9.3.2. Japan
9.3.3. India
9.3.4. Australia & New Zealand
9.3.5. Rest of APAC
9.4. RoW
9.4.1 Africa
9.4.2 Middle East
9.4.3 South America
10. Global Food Waste Management Market Entropy
10.1. New Product Developments
10.2. Mergers and Acquisitions
11. Company Profiles
"*Financials would be provided on a best efforts basis for private companies"
12. Appendix
12.1. Abbreviations
12.2. Sources
12.3. Research Methodology
12.4. Disclaimer
Table 1: Food Waste Management Market Overview 2021-2026
Table 2: Food Waste Management Market Leader Analysis 2018-2019 (US$)
Table 3: Food Waste Management Market Product Analysis 2018-2019 (US$)
Table 4: Food Waste Management Market End User Analysis 2018-2019 (US$)
Table 5: Food Waste Management Market Patent Analysis 2013-2018* (US$)
Table 6: Food Waste Management Market Financial Analysis 2018-2019 (US$)
Table 7: Food Waste Management Market Driver Analysis 2018-2019 (US$)
Table 8: Food Waste Management Market Challenges Analysis 2018-2019 (US$)
Table 9: Food Waste Management Market Constraint Analysis 2018-2019 (US$)
Table 10: Food Waste Management Market Supplier Bargaining Power Analysis 2018-2019 (US$)
Table 11: Food Waste Management Market Buyer Bargaining Power Analysis 2018-2019 (US$)
Table 12: Food Waste Management Market Threat of Substitutes Analysis 2018-2019 (US$)
Table 13: Food Waste Management Market Threat of New Entrants Analysis 2018-2019 (US$)
Table 14: Food Waste Management Market Degree of Competition Analysis 2018-2019 (US$)
Table 15: Food Waste Management Market Value Chain Analysis 2018-2019 (US$)
Table 16: Food Waste Management Market Pricing Analysis 2021-2026 (US$)
Table 17: Food Waste Management Market Opportunities Analysis 2021-2026 (US$)
Table 18: Food Waste Management Market Product Life Cycle Analysis 2021-2026 (US$)
Table 19: Food Waste Management Market Supplier Analysis 2018-2019 (US$)
Table 20: Food Waste Management Market Distributor Analysis 2018-2019 (US$)
Table 21: Food Waste Management Market Trend Analysis 2018-2019 (US$)
Table 22: Food Waste Management Market Size 2018 (US$)
Table 23: Food Waste Management Market Forecast Analysis 2021-2026 (US$)
Table 24: Food Waste Management Market Sales Forecast Analysis 2021-2026 (Units)
Table 25: Food Waste Management Market, Revenue & Volume, By Method, 2021-2026 ($)
Table 26: Food Waste Management Market By Method, Revenue & Volume, By Prevention, 2021-2026 ($)
Table 27: Food Waste Management Market By Method, Revenue & Volume, By Redistribution, 2021-2026 ($)
Table 28: Food Waste Management Market By Method, Revenue & Volume, By Recycling, 2021-2026 ($)
Table 29: Food Waste Management Market By Method, Revenue & Volume, By Recovery, 2021-2026 ($)
Table 30: Food Waste Management Market By Method, Revenue & Volume, By Disposal, 2021-2026 ($)
Table 31: Food Waste Management Market, Revenue & Volume, By End User, 2021-2026 ($)
Table 32: Food Waste Management Market By End User, Revenue & Volume, By Primary Producers, 2021-2026 ($)
Table 33: Food Waste Management Market By End User, Revenue & Volume, By Food Manufacturers, 2021-2026 ($)
Table 34: Food Waste Management Market By End User, Revenue & Volume, By Wholesale and Logistics, 2021-2026 ($)
Table 35: Food Waste Management Market By End User, Revenue & Volume, By Retail and Market s, 2021-2026 ($)
Table 36: Food Waste Management Market By End User, Revenue & Volume, By Food service Providers, 2021-2026 ($)
Table 37: North America Food Waste Management Market, Revenue & Volume, By Method, 2021-2026 ($)
Table 38: North America Food Waste Management Market, Revenue & Volume, By End User, 2021-2026 ($)
Table 39: South america Food Waste Management Market, Revenue & Volume, By Method, 2021-2026 ($)
Table 40: South america Food Waste Management Market, Revenue & Volume, By End User, 2021-2026 ($)
Table 41: Europe Food Waste Management Market, Revenue & Volume, By Method, 2021-2026 ($)
Table 42: Europe Food Waste Management Market, Revenue & Volume, By End User, 2021-2026 ($)
Table 43: APAC Food Waste Management Market, Revenue & Volume, By Method, 2021-2026 ($)
Table 44: APAC Food Waste Management Market, Revenue & Volume, By End User, 2021-2026 ($)
Table 45: Middle East & Africa Food Waste Management Market, Revenue & Volume, By Method, 2021-2026 ($)
Table 46: Middle East & Africa Food Waste Management Market, Revenue & Volume, By End User, 2021-2026 ($)
Table 47: Russia Food Waste Management Market, Revenue & Volume, By Method, 2021-2026 ($)
Table 48: Russia Food Waste Management Market, Revenue & Volume, By End User, 2021-2026 ($)
Table 49: Israel Food Waste Management Market, Revenue & Volume, By Method, 2021-2026 ($)
Table 50: Israel Food Waste Management Market, Revenue & Volume, By End User, 2021-2026 ($)
Table 51: Top Companies 2018 (US$)Food Waste Management Market, Revenue & Volume
Table 52: Product Launch 2018-2019Food Waste Management Market, Revenue & Volume
Table 53: Mergers & Acquistions 2018-2019Food Waste Management Market, Revenue & Volume
List of Figures
Figure 1: Overview of Food Waste Management Market 2021-2026
Figure 2: Market Share Analysis for Food Waste Management Market 2018 (US$)
Figure 3: Product Comparison in Food Waste Management Market 2018-2019 (US$)
Figure 4: End User Profile for Food Waste Management Market 2018-2019 (US$)
Figure 5: Patent Application and Grant in Food Waste Management Market 2013-2018* (US$)
Figure 6: Top 5 Companies Financial Analysis in Food Waste Management Market 2018-2019 (US$)
Figure 7: Market Entry Strategy in Food Waste Management Market 2018-2019
Figure 8: Ecosystem Analysis in Food Waste Management Market 2018
Figure 9: Average Selling Price in Food Waste Management Market 2021-2026
Figure 10: Top Opportunites in Food Waste Management Market 2018-2019
Figure 11: Market Life Cycle Analysis in Food Waste Management Market
Figure 12: GlobalBy MethodFood Waste Management Market Revenue, 2021-2026 ($)
Figure 13: GlobalBy End UserFood Waste Management Market Revenue, 2021-2026 ($)
Figure 14: Global Food Waste Management Market - By Geography
Figure 15: Global Food Waste Management Market Value & Volume, By Geography, 2021-2026 ($)
Figure 16: Global Food Waste Management Market CAGR, By Geography, 2021-2026 (%)
Figure 17: North America Food Waste Management Market Value & Volume, 2021-2026 ($)
Figure 18: US Food Waste Management Market Value & Volume, 2021-2026 ($)
Figure 19: US GDP and Population, 2018-2019 ($)
Figure 20: US GDP – Composition of 2018, By Sector of Origin
Figure 21: US Export and Import Value & Volume, 2018-2019 ($)
Figure 22: Canada Food Waste Management Market Value & Volume, 2021-2026 ($)
Figure 23: Canada GDP and Population, 2018-2019 ($)
Figure 24: Canada GDP – Composition of 2018, By Sector of Origin
Figure 25: Canada Export and Import Value & Volume, 2018-2019 ($)
Figure 26: Mexico Food Waste Management Market Value & Volume, 2021-2026 ($)
Figure 27: Mexico GDP and Population, 2018-2019 ($)
Figure 28: Mexico GDP – Composition of 2018, By Sector of Origin
Figure 29: Mexico Export and Import Value & Volume, 2018-2019 ($)
Figure 30: South America Food Waste Management Market Value & Volume, 2021-2026 ($)
Figure 31: Brazil Food Waste Management Market Value & Volume, 2021-2026 ($)
Figure 32: Brazil GDP and Population, 2018-2019 ($)
Figure 33: Brazil GDP – Composition of 2018, By Sector of Origin
Figure 34: Brazil Export and Import Value & Volume, 2018-2019 ($)
Figure 35: Venezuela Food Waste Management Market Value & Volume, 2021-2026 ($)
Figure 36: Venezuela GDP and Population, 2018-2019 ($)
Figure 37: Venezuela GDP – Composition of 2018, By Sector of Origin
Figure 38: Venezuela Export and Import Value & Volume, 2018-2019 ($)
Figure 39: Argentina Food Waste Management Market Value & Volume, 2021-2026 ($)
Figure 40: Argentina GDP and Population, 2018-2019 ($)
Figure 41: Argentina GDP – Composition of 2018, By Sector of Origin
Figure 42: Argentina Export and Import Value & Volume, 2018-2019 ($)
Figure 43: Ecuador Food Waste Management Market Value & Volume, 2021-2026 ($)
Figure 44: Ecuador GDP and Population, 2018-2019 ($)
Figure 45: Ecuador GDP – Composition of 2018, By Sector of Origin
Figure 46: Ecuador Export and Import Value & Volume, 2018-2019 ($)
Figure 47: Peru Food Waste Management Market Value & Volume, 2021-2026 ($)
Figure 48: Peru GDP and Population, 2018-2019 ($)
Figure 49: Peru GDP – Composition of 2018, By Sector of Origin
Figure 50: Peru Export and Import Value & Volume, 2018-2019 ($)
Figure 51: Colombia Food Waste Management Market Value & Volume, 2021-2026 ($)
Figure 52: Colombia GDP and Population, 2018-2019 ($)
Figure 53: Colombia GDP – Composition of 2018, By Sector of Origin
Figure 54: Colombia Export and Import Value & Volume, 2018-2019 ($)
Figure 55: Costa Rica Food Waste Management Market Value & Volume, 2021-2026 ($)
Figure 56: Costa Rica GDP and Population, 2018-2019 ($)
Figure 57: Costa Rica GDP – Composition of 2018, By Sector of Origin
Figure 58: Costa Rica Export and Import Value & Volume, 2018-2019 ($)
Figure 59: Europe Food Waste Management Market Value & Volume, 2021-2026 ($)
Figure 60: U.K Food Waste Management Market Value & Volume, 2021-2026 ($)
Figure 61: U.K GDP and Population, 2018-2019 ($)
Figure 62: U.K GDP – Composition of 2018, By Sector of Origin
Figure 63: U.K Export and Import Value & Volume, 2018-2019 ($)
Figure 64: Germany Food Waste Management Market Value & Volume, 2021-2026 ($)
Figure 65: Germany GDP and Population, 2018-2019 ($)
Figure 66: Germany GDP – Composition of 2018, By Sector of Origin
Figure 67: Germany Export and Import Value & Volume, 2018-2019 ($)
Figure 68: Italy Food Waste Management Market Value & Volume, 2021-2026 ($)
Figure 69: Italy GDP and Population, 2018-2019 ($)
Figure 70: Italy GDP – Composition of 2018, By Sector of Origin
Figure 71: Italy Export and Import Value & Volume, 2018-2019 ($)
Figure 72: France Food Waste Management Market Value & Volume, 2021-2026 ($)
Figure 73: France GDP and Population, 2018-2019 ($)
Figure 74: France GDP – Composition of 2018, By Sector of Origin
Figure 75: France Export and Import Value & Volume, 2018-2019 ($)
Figure 76: Netherlands Food Waste Management Market Value & Volume, 2021-2026 ($)
Figure 77: Netherlands GDP and Population, 2018-2019 ($)
Figure 78: Netherlands GDP – Composition of 2018, By Sector of Origin
Figure 79: Netherlands Export and Import Value & Volume, 2018-2019 ($)
Figure 80: Belgium Food Waste Management Market Value & Volume, 2021-2026 ($)
Figure 81: Belgium GDP and Population, 2018-2019 ($)
Figure 82: Belgium GDP – Composition of 2018, By Sector of Origin
Figure 83: Belgium Export and Import Value & Volume, 2018-2019 ($)
Figure 84: Spain Food Waste Management Market Value & Volume, 2021-2026 ($)
Figure 85: Spain GDP and Population, 2018-2019 ($)
Figure 86: Spain GDP – Composition of 2018, By Sector of Origin
Figure 87: Spain Export and Import Value & Volume, 2018-2019 ($)
Figure 88: Denmark Food Waste Management Market Value & Volume, 2021-2026 ($)
Figure 89: Denmark GDP and Population, 2018-2019 ($)
Figure 90: Denmark GDP – Composition of 2018, By Sector of Origin
Figure 91: Denmark Export and Import Value & Volume, 2018-2019 ($)
Figure 92: APAC Food Waste Management Market Value & Volume, 2021-2026 ($)
Figure 93: China Food Waste Management Market Value & Volume, 2021-2026
Figure 94: China GDP and Population, 2018-2019 ($)
Figure 95: China GDP – Composition of 2018, By Sector of Origin
Figure 96: China Export and Import Value & Volume, 2018-2019 ($)Food Waste Management Market China Export and Import Value & Volume, 2018-2019 ($)
Figure 97: Australia Food Waste Management Market Value & Volume, 2021-2026 ($)
Figure 98: Australia GDP and Population, 2018-2019 ($)
Figure 99: Australia GDP – Composition of 2018, By Sector of Origin
Figure 100: Australia Export and Import Value & Volume, 2018-2019 ($)
Figure 101: South Korea Food Waste Management Market Value & Volume, 2021-2026 ($)
Figure 102: South Korea GDP and Population, 2018-2019 ($)
Figure 103: South Korea GDP – Composition of 2018, By Sector of Origin
Figure 104: South Korea Export and Import Value & Volume, 2018-2019 ($)
Figure 105: India Food Waste Management Market Value & Volume, 2021-2026 ($)
Figure 106: India GDP and Population, 2018-2019 ($)
Figure 107: India GDP – Composition of 2018, By Sector of Origin
Figure 108: India Export and Import Value & Volume, 2018-2019 ($)
Figure 109: Taiwan Food Waste Management Market Value & Volume, 2021-2026 ($)
Figure 110: Taiwan GDP and Population, 2018-2019 ($)
Figure 111: Taiwan GDP – Composition of 2018, By Sector of Origin
Figure 112: Taiwan Export and Import Value & Volume, 2018-2019 ($)
Figure 113: Malaysia Food Waste Management Market Value & Volume, 2021-2026 ($)
Figure 114: Malaysia GDP and Population, 2018-2019 ($)
Figure 115: Malaysia GDP – Composition of 2018, By Sector of Origin
Figure 116: Malaysia Export and Import Value & Volume, 2018-2019 ($)
Figure 117: Hong Kong Food Waste Management Market Value & Volume, 2021-2026 ($)
Figure 118: Hong Kong GDP and Population, 2018-2019 ($)
Figure 119: Hong Kong GDP – Composition of 2018, By Sector of Origin
Figure 120: Hong Kong Export and Import Value & Volume, 2018-2019 ($)
Figure 121: Middle East & Africa Food Waste Management Market Middle East & Africa 3D Printing Market Value & Volume, 2021-2026 ($)
Figure 122: Russia Food Waste Management Market Value & Volume, 2021-2026 ($)
Figure 123: Russia GDP and Population, 2018-2019 ($)
Figure 124: Russia GDP – Composition of 2018, By Sector of Origin
Figure 125: Russia Export and Import Value & Volume, 2018-2019 ($)
Figure 126: Israel Food Waste Management Market Value & Volume, 2021-2026 ($)
Figure 127: Israel GDP and Population, 2018-2019 ($)
Figure 128: Israel GDP – Composition of 2018, By Sector of Origin
Figure 129: Israel Export and Import Value & Volume, 2018-2019 ($)
Figure 130: Entropy Share, By Strategies, 2018-2019* (%)Food Waste Management Market
Figure 131: Developments, 2018-2019*Food Waste Management Market
Figure 132: Company 1 Food Waste Management Market Net Revenue, By Years, 2018-2019* ($)
Figure 133: Company 1 Food Waste Management Market Net Revenue Share, By Business segments, 2018 (%)
Figure 134: Company 1 Food Waste Management Market Net Sales Share, By Geography, 2018 (%)
Figure 135: Company 2 Food Waste Management Market Net Revenue, By Years, 2018-2019* ($)
Figure 136: Company 2 Food Waste Management Market Net Revenue Share, By Business segments, 2018 (%)
Figure 137: Company 2 Food Waste Management Market Net Sales Share, By Geography, 2018 (%)
Figure 138: Company 3 Food Waste Management Market Net Revenue, By Years, 2018-2019* ($)
Figure 139: Company 3 Food Waste Management Market Net Revenue Share, By Business segments, 2018 (%)
Figure 140: Company 3 Food Waste Management Market Net Sales Share, By Geography, 2018 (%)
Figure 141: Company 4 Food Waste Management Market Net Revenue, By Years, 2018-2019* ($)
Figure 142: Company 4 Food Waste Management Market Net Revenue Share, By Business segments, 2018 (%)
Figure 143: Company 4 Food Waste Management Market Net Sales Share, By Geography, 2018 (%)
Figure 144: Company 5 Food Waste Management Market Net Revenue, By Years, 2018-2019* ($)
Figure 145: Company 5 Food Waste Management Market Net Revenue Share, By Business segments, 2018 (%)
Figure 146: Company 5 Food Waste Management Market Net Sales Share, By Geography, 2018 (%)
Figure 147: Company 6 Food Waste Management Market Net Revenue, By Years, 2018-2019* ($)
Figure 148: Company 6 Food Waste Management Market Net Revenue Share, By Business segments, 2018 (%)
Figure 149: Company 6 Food Waste Management Market Net Sales Share, By Geography, 2018 (%)
Figure 150: Company 7 Food Waste Management Market Net Revenue, By Years, 2018-2019* ($)
Figure 151: Company 7 Food Waste Management Market Net Revenue Share, By Business segments, 2018 (%)
Figure 152: Company 7 Food Waste Management Market Net Sales Share, By Geography, 2018 (%)
Figure 153: Company 8 Food Waste Management Market Net Revenue, By Years, 2018-2019* ($)
Figure 154: Company 8 Food Waste Management Market Net Revenue Share, By Business segments, 2018 (%)
Figure 155: Company 8 Food Waste Management Market Net Sales Share, By Geography, 2018 (%)
Figure 156: Company 9 Food Waste Management Market Net Revenue, By Years, 2018-2019* ($)
Figure 157: Company 9 Food Waste Management Market Net Revenue Share, By Business segments, 2018 (%)
Figure 158: Company 9 Food Waste Management Market Net Sales Share, By Geography, 2018 (%)
Figure 159: Company 10 Food Waste Management Market Net Revenue, By Years, 2018-2019* ($)
Figure 160: Company 10 Food Waste Management Market Net Revenue Share, By Business segments, 2018 (%)
Figure 161: Company 10 Food Waste Management Market Net Sales Share, By Geography, 2018 (%)
Figure 162: Company 11 Food Waste Management Market Net Revenue, By Years, 2018-2019* ($)
Figure 163: Company 11 Food Waste Management Market Net Revenue Share, By Business segments, 2018 (%)
Figure 164: Company 11 Food Waste Management Market Net Sales Share, By Geography, 2018 (%)
Figure 165: Company 12 Food Waste Management Market Net Revenue, By Years, 2018-2019* ($)
Figure 166: Company 12 Food Waste Management Market Net Revenue Share, By Business segments, 2018 (%)
Figure 167: Company 12 Food Waste Management Market Net Sales Share, By Geography, 2018 (%)
Figure 168: Company 13 Food Waste Management Market Net Revenue, By Years, 2018-2019* ($)
Figure 169: Company 13 Food Waste Management Market Net Revenue Share, By Business segments, 2018 (%)
Figure 170: Company 13 Food Waste Management Market Net Sales Share, By Geography, 2018 (%)
Figure 171: Company 14 Food Waste Management Market Net Revenue, By Years, 2018-2019* ($)
Figure 172: Company 14 Food Waste Management Market Net Revenue Share, By Business segments, 2018 (%)
Figure 173: Company 14 Food Waste Management Market Net Sales Share, By Geography, 2018 (%)
Figure 174: Company 15 Food Waste Management Market Net Revenue, By Years, 2018-2019* ($)
Figure 175: Company 15 Food Waste Management Market Net Revenue Share, By Business segments, 2018 (%)
Figure 176: Company 15 Food Waste Management Market Net Sales Share, By Geography, 2018 (%)