 Email
Email Print
Print


Packaged Nuts & Seeds Market - Forecast(2024 - 2030)
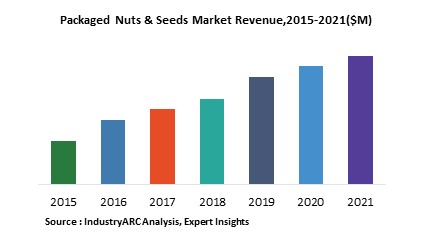
The worldwide consumption of nuts and seeds is increasing rapidly owing to increasing awareness among consumers regarding benefits of nutritional and healthy food products. Proper packaging increases their shelf life and helps in sustaining quality so that the end-users can get clean and fresh product. For that, companies are investing in the development of new technologies and innovations in the field of food packaging. The global packaged nuts & seeds market is increasing at a CAGR of XX% and is projected to reach $XXm by 2021 from $XXm in 2015.
The global packaged nuts and seeds market has been analyzed with respect to different parameters such as demand, supply, end-users and providers of innovative packaging. This market is categorized by product type and by packaging material. On the basis of packaging material they can be categorized into glass, metal, paper or plastic. On the basis of product type, the market is segmented into almonds, walnuts, cashews, pistachios, pecan pieces, sunflower seeds, chia seeds, sesame seeds, corn, soybean and so on.
The overall packaged nuts & seeds market is also shown from the perspective of different geographic regions and the key countries in each region. North America is the dominant market due to higher consumption of dry fruits. Increasing awareness of healthy & nutritious products and their positive effects on health and immunity in the long run fuels the market growth in near future.
High competition in the market propels the manufacturers to come up with innovative marketing strategies. Hence, companies are using various innovative packaging for their products.
Sample Companies Profiled in this Report are:
- American Packaging Corporation (U.S.)
- Ampacet Corporation (U.S.)
- Jabil Circuit Inc. (U.S.)
- Wells Plastics Limited (U.K.)
- BASF SE (Germany)
- 10+.
1. Global Packaged Nuts & Seeds Market Overview
2. Global Packaged Nuts & Seeds Executive Summary
3. Global Packaged Nuts & Seeds Market Landscape
3.1. Market Share Analysis
3.2. Comparative Analysis
3.2.1. Product Benchmarking
3.2.2. End - User Profiling
3.2.3. Patent Analysis
3.2.4. Top 5 Financials
4. Global Packaged Nuts & Seeds Market Forces
4.1. Market Drivers
4.2. Market Constraints
4.3. Market Challenges
4.4. Attractiveness of the Global Packaged Nuts & Seeds Market
4.4.1. Power of Suppliers
4.4.2. Threats from New Entrants
4.4.3. Power of Buyer
4.4.4. Threat from Substitute Product
4.4.5. Degree Of Competition
5. Global Packaged Nuts & Seeds Market Strategic Analysis
5.1. Value Chain Analysis
5.2. Pricing Analysis
5.3. Product Life Cycle
5.4. Suppliers & Distributors
5.5. Opportunity Analysis
6. Global Packaged Nuts & Seeds Market - By Product Type
6.1. Introduction
6.2. Nuts
6.2.1. Almonds
6.2.2. Hazelnuts
6.2.3. Walnuts
6.2.4. Cashews
6.2.5. Peanuts
6.2.6. Pistachios
6.2.7. Pecan Pieces
6.2.8. Others
6.3. Seeds
6.3.1. Sunflower Seeds
6.3.2. Chia Seeds
6.3.3. Sesame Seeds
6.3.4. Corn/Maize
6.3.5. Soybean
6.3.6. Others
7. Global Packaged Nuts & Seeds Market - By Form
7.1. Introduction
7.2. Raw
7.3. Roasted
7.4. Others
8. Global Packaged Nuts & Seeds Market - By Packaging Material
8.1. Introduction
8.2. Glass
8.3. Metal
8.4. Paper & Paper Boards
8.5. Plastics
8.6. Others
9. Global Packaged Nuts & Seeds Market - By Geography
9.1. North America
9.1.1. U.S.
9.1.2. Canada
9.1.3. Mexico
9.2. Europe
9.2.1. U.K.
9.2.2. Germany
9.2.3. Italy
9.2.4. France
9.2.5. Rest of Europe
9.3. APAC
9.3.1. China
9.3.2. Japan
9.3.3. India
9.3.4. Rest of APAC
9.4. RoW
9.4.1. Africa
9.4.2. Middle East
9.4.3. South America
10. Global Packaged Nuts & Seeds Market Entropy
10.1. New Product Developments
10.2. M&As, JVs, Collaborations & Partnerships
11. Global Packaged Nuts & Seeds - Company Profiles
"*Financials would be provided on a best efforts basis for private companies"
12. Appendix
12.1. Abbreviations
12.2. Sources
12.3. Research methodology
12.4. Bibliography
12.5. Compilation of expert insights
12.6. Disclaimer
2. Global Packaged Nuts & Seeds Executive Summary
3. Global Packaged Nuts & Seeds Market Landscape
3.1. Market Share Analysis
3.2. Comparative Analysis
3.2.1. Product Benchmarking
3.2.2. End - User Profiling
3.2.3. Patent Analysis
3.2.4. Top 5 Financials
4. Global Packaged Nuts & Seeds Market Forces
4.1. Market Drivers
4.2. Market Constraints
4.3. Market Challenges
4.4. Attractiveness of the Global Packaged Nuts & Seeds Market
4.4.1. Power of Suppliers
4.4.2. Threats from New Entrants
4.4.3. Power of Buyer
4.4.4. Threat from Substitute Product
4.4.5. Degree Of Competition
5. Global Packaged Nuts & Seeds Market Strategic Analysis
5.1. Value Chain Analysis
5.2. Pricing Analysis
5.3. Product Life Cycle
5.4. Suppliers & Distributors
5.5. Opportunity Analysis
6. Global Packaged Nuts & Seeds Market - By Product Type
6.1. Introduction
6.2. Nuts
6.2.1. Almonds
6.2.2. Hazelnuts
6.2.3. Walnuts
6.2.4. Cashews
6.2.5. Peanuts
6.2.6. Pistachios
6.2.7. Pecan Pieces
6.2.8. Others
6.3. Seeds
6.3.1. Sunflower Seeds
6.3.2. Chia Seeds
6.3.3. Sesame Seeds
6.3.4. Corn/Maize
6.3.5. Soybean
6.3.6. Others
7. Global Packaged Nuts & Seeds Market - By Form
7.1. Introduction
7.2. Raw
7.3. Roasted
7.4. Others
8. Global Packaged Nuts & Seeds Market - By Packaging Material
8.1. Introduction
8.2. Glass
8.3. Metal
8.4. Paper & Paper Boards
8.5. Plastics
8.6. Others
9. Global Packaged Nuts & Seeds Market - By Geography
9.1. North America
9.1.1. U.S.
9.1.2. Canada
9.1.3. Mexico
9.2. Europe
9.2.1. U.K.
9.2.2. Germany
9.2.3. Italy
9.2.4. France
9.2.5. Rest of Europe
9.3. APAC
9.3.1. China
9.3.2. Japan
9.3.3. India
9.3.4. Rest of APAC
9.4. RoW
9.4.1. Africa
9.4.2. Middle East
9.4.3. South America
10. Global Packaged Nuts & Seeds Market Entropy
10.1. New Product Developments
10.2. M&As, JVs, Collaborations & Partnerships
11. Global Packaged Nuts & Seeds - Company Profiles
11.1. Company 1
11.2. Company 2
11.3. Company 3
11.4. Company 4
11.5. Company 5
11.6. Company 6
11.7. Company 7
11.8. Company 8
11.9. Company 9
11.10. Company 10
*More than 10 Companies are profiled in this Research Report*"*Financials would be provided on a best efforts basis for private companies"
12. Appendix
12.1. Abbreviations
12.2. Sources
12.3. Research methodology
12.4. Bibliography
12.5. Compilation of expert insights
12.6. Disclaimer
List of Tables
Table 1: Packaged Nuts & Seeds Market Overview 2021-2026
Table 2: Packaged Nuts & Seeds Market Leader Analysis 2018-2019 (US$)
Table 3: Packaged Nuts & Seeds Market Product Analysis 2018-2019 (US$)
Table 4: Packaged Nuts & Seeds Market End User Analysis 2018-2019 (US$)
Table 5: Packaged Nuts & Seeds Market Patent Analysis 2013-2018* (US$)
Table 6: Packaged Nuts & Seeds Market Financial Analysis 2018-2019 (US$)
Table 7: Packaged Nuts & Seeds Market Driver Analysis 2018-2019 (US$)
Table 8: Packaged Nuts & Seeds Market Challenges Analysis 2018-2019 (US$)
Table 9: Packaged Nuts & Seeds Market Constraint Analysis 2018-2019 (US$)
Table 10: Packaged Nuts & Seeds Market Supplier Bargaining Power Analysis 2018-2019 (US$)
Table 11: Packaged Nuts & Seeds Market Buyer Bargaining Power Analysis 2018-2019 (US$)
Table 12: Packaged Nuts & Seeds Market Threat of Substitutes Analysis 2018-2019 (US$)
Table 13: Packaged Nuts & Seeds Market Threat of New Entrants Analysis 2018-2019 (US$)
Table 14: Packaged Nuts & Seeds Market Degree of Competition Analysis 2018-2019 (US$)
Table 15: Packaged Nuts & Seeds Market Value Chain Analysis 2018-2019 (US$)
Table 16: Packaged Nuts & Seeds Market Pricing Analysis 2021-2026 (US$)
Table 17: Packaged Nuts & Seeds Market Opportunities Analysis 2021-2026 (US$)
Table 18: Packaged Nuts & Seeds Market Product Life Cycle Analysis 2021-2026 (US$)
Table 19: Packaged Nuts & Seeds Market Supplier Analysis 2018-2019 (US$)
Table 20: Packaged Nuts & Seeds Market Distributor Analysis 2018-2019 (US$)
Table 21: Packaged Nuts & Seeds Market Trend Analysis 2018-2019 (US$)
Table 22: Packaged Nuts & Seeds Market Size 2018 (US$)
Table 23: Packaged Nuts & Seeds Market Forecast Analysis 2021-2026 (US$)
Table 24: Packaged Nuts & Seeds Market Sales Forecast Analysis 2021-2026 (Units)
Table 25: Packaged Nuts & Seeds Market, Revenue & Volume,By Form, 2021-2026 ($)
Table 26: Packaged Nuts & Seeds Market By Form, Revenue & Volume,By Introduction, 2021-2026 ($)
Table 27: Packaged Nuts & Seeds Market By Form, Revenue & Volume,By Raw, 2021-2026 ($)
Table 28: Packaged Nuts & Seeds Market By Form, Revenue & Volume,By Roasted, 2021-2026 ($)
Table 29: Packaged Nuts & Seeds Market By Form, Revenue & Volume,By Others, 2021-2026 ($)
Table 30: Packaged Nuts & Seeds Market, Revenue & Volume,By Product, 2021-2026 ($)
Table 31: Packaged Nuts & Seeds Market By Product, Revenue & Volume,By Introduction, 2021-2026 ($)
Table 32: Packaged Nuts & Seeds Market By Product, Revenue & Volume,By Nuts, 2021-2026 ($)
Table 33: Packaged Nuts & Seeds Market By Product, Revenue & Volume,By Almonds, 2021-2026 ($)
Table 34: Packaged Nuts & Seeds Market By Product, Revenue & Volume,By Seeds, 2021-2026 ($)
Table 35: Packaged Nuts & Seeds Market By Product, Revenue & Volume,By Sunflower Seeds, 2021-2026 ($)
Table 36: Packaged Nuts & Seeds Market, Revenue & Volume,By Packaging Material, 2021-2026 ($)
Table 37: Packaged Nuts & Seeds Market By Packaging Material, Revenue & Volume,By Glass, 2021-2026 ($)
Table 38: Packaged Nuts & Seeds Market By Packaging Material, Revenue & Volume,By Metal, 2021-2026 ($)
Table 39: Packaged Nuts & Seeds Market By Packaging Material, Revenue & Volume,By Paper & Paper Boards, 2021-2026 ($)
Table 40: Packaged Nuts & Seeds Market By Packaging Material, Revenue & Volume,By Plastics, 2021-2026 ($)
Table 41: Packaged Nuts & Seeds Market By Packaging Material, Revenue & Volume,By Others, 2021-2026 ($)
Table 42: North America Packaged Nuts & Seeds Market, Revenue & Volume,By Form, 2021-2026 ($)
Table 43: North America Packaged Nuts & Seeds Market, Revenue & Volume,By Product, 2021-2026 ($)
Table 44: North America Packaged Nuts & Seeds Market, Revenue & Volume,By Packaging Material, 2021-2026 ($)
Table 45: South america Packaged Nuts & Seeds Market, Revenue & Volume,By Form, 2021-2026 ($)
Table 46: South america Packaged Nuts & Seeds Market, Revenue & Volume,By Product, 2021-2026 ($)
Table 47: South america Packaged Nuts & Seeds Market, Revenue & Volume,By Packaging Material, 2021-2026 ($)
Table 48: Europe Packaged Nuts & Seeds Market, Revenue & Volume,By Form, 2021-2026 ($)
Table 49: Europe Packaged Nuts & Seeds Market, Revenue & Volume,By Product, 2021-2026 ($)
Table 50: Europe Packaged Nuts & Seeds Market, Revenue & Volume,By Packaging Material, 2021-2026 ($)
Table 51: APAC Packaged Nuts & Seeds Market, Revenue & Volume,By Form, 2021-2026 ($)
Table 52: APAC Packaged Nuts & Seeds Market, Revenue & Volume,By Product, 2021-2026 ($)
Table 53: APAC Packaged Nuts & Seeds Market, Revenue & Volume,By Packaging Material, 2021-2026 ($)
Table 54: Middle East & Africa Packaged Nuts & Seeds Market, Revenue & Volume,By Form, 2021-2026 ($)
Table 55: Middle East & Africa Packaged Nuts & Seeds Market, Revenue & Volume,By Product, 2021-2026 ($)
Table 56: Middle East & Africa Packaged Nuts & Seeds Market, Revenue & Volume,By Packaging Material, 2021-2026 ($)
Table 57: Russia Packaged Nuts & Seeds Market, Revenue & Volume,By Form, 2021-2026 ($)
Table 58: Russia Packaged Nuts & Seeds Market, Revenue & Volume,By Product, 2021-2026 ($)
Table 59: Russia Packaged Nuts & Seeds Market, Revenue & Volume,By Packaging Material, 2021-2026 ($)
Table 60: Israel Packaged Nuts & Seeds Market, Revenue & Volume,By Form, 2021-2026 ($)
Table 61: Israel Packaged Nuts & Seeds Market, Revenue & Volume,By Product, 2021-2026 ($)
Table 62: Israel Packaged Nuts & Seeds Market, Revenue & Volume,By Packaging Material, 2021-2026 ($)
Table 63: Top Companies 2018 (US$)Packaged Nuts & Seeds Market, Revenue & Volume
Table 64: Product Launch 2018-2019Packaged Nuts & Seeds Market, Revenue & Volume
Table 65: Mergers & Acquistions 2018-2019Packaged Nuts & Seeds Market, Revenue & Volume
List of Figures
Figure 1: Overview of Packaged Nuts & Seeds Market 2021-2026
Figure 2: Market Share Analysis for Packaged Nuts & Seeds Market 2018 (US$)
Figure 3: Product Comparison in Packaged Nuts & Seeds Market 2018-2019 (US$)
Figure 4: End User Profile for Packaged Nuts & Seeds Market 2018-2019 (US$)
Figure 5: Patent Application and Grant in Packaged Nuts & Seeds Market 2013-2018* (US$)
Figure 6: Top 5 Companies Financial Analysis in Packaged Nuts & Seeds Market 2018-2019 (US$)
Figure 7: Market Entry Strategy in Packaged Nuts & Seeds Market 2018-2019
Figure 8: Ecosystem Analysis in Packaged Nuts & Seeds Market 2018
Figure 9: Average Selling Price in Packaged Nuts & Seeds Market 2021-2026
Figure 10: Top Opportunites in Packaged Nuts & Seeds Market 2018-2019
Figure 11: Market Life Cycle Analysis in Packaged Nuts & Seeds Market
Figure 12: GlobalBy Form Packaged Nuts & Seeds Market Revenue, 2021-2026 ($)
Figure 13: GlobalBy ProductPackaged Nuts & Seeds Market Revenue, 2021-2026 ($)
Figure 14: GlobalBy Packaging MaterialPackaged Nuts & Seeds Market Revenue, 2021-2026 ($)
Figure 15: Global Packaged Nuts & Seeds Market - By Geography
Figure 16: Global Packaged Nuts & Seeds Market Value & Volume, By Geography, 2021-2026 ($)
Figure 17: Global Packaged Nuts & Seeds Market CAGR, By Geography, 2021-2026 (%)
Figure 18: North America Packaged Nuts & Seeds Market Value & Volume, 2021-2026 ($)
Figure 19: US Packaged Nuts & Seeds Market Value & Volume, 2021-2026 ($)
Figure 20: US GDP and Population, 2018-2019 ($)
Figure 21: US GDP – Composition of 2018, By Sector of Origin
Figure 22: US Export and Import Value & Volume, 2018-2019 ($)
Figure 23: Canada Packaged Nuts & Seeds Market Value & Volume, 2021-2026 ($)
Figure 24: Canada GDP and Population, 2018-2019 ($)
Figure 25: Canada GDP – Composition of 2018, By Sector of Origin
Figure 26: Canada Export and Import Value & Volume, 2018-2019 ($)
Figure 27: Mexico Packaged Nuts & Seeds Market Value & Volume, 2021-2026 ($)
Figure 28: Mexico GDP and Population, 2018-2019 ($)
Figure 29: Mexico GDP – Composition of 2018, By Sector of Origin
Figure 30: Mexico Export and Import Value & Volume, 2018-2019 ($)
Figure 31: South America Packaged Nuts & Seeds Market Value & Volume, 2021-2026 ($)
Figure 32: Brazil Packaged Nuts & Seeds Market Value & Volume, 2021-2026 ($)
Figure 33: Brazil GDP and Population, 2018-2019 ($)
Figure 34: Brazil GDP – Composition of 2018, By Sector of Origin
Figure 35: Brazil Export and Import Value & Volume, 2018-2019 ($)
Figure 36: Venezuela Packaged Nuts & Seeds Market Value & Volume, 2021-2026 ($)
Figure 37: Venezuela GDP and Population, 2018-2019 ($)
Figure 38: Venezuela GDP – Composition of 2018, By Sector of Origin
Figure 39: Venezuela Export and Import Value & Volume, 2018-2019 ($)
Figure 40: Argentina Packaged Nuts & Seeds Market Value & Volume, 2021-2026 ($)
Figure 41: Argentina GDP and Population, 2018-2019 ($)
Figure 42: Argentina GDP – Composition of 2018, By Sector of Origin
Figure 43: Argentina Export and Import Value & Volume, 2018-2019 ($)
Figure 44: Ecuador Packaged Nuts & Seeds Market Value & Volume, 2021-2026 ($)
Figure 45: Ecuador GDP and Population, 2018-2019 ($)
Figure 46: Ecuador GDP – Composition of 2018, By Sector of Origin
Figure 47: Ecuador Export and Import Value & Volume, 2018-2019 ($)
Figure 48: Peru Packaged Nuts & Seeds Market Value & Volume, 2021-2026 ($)
Figure 49: Peru GDP and Population, 2018-2019 ($)
Figure 50: Peru GDP – Composition of 2018, By Sector of Origin
Figure 51: Peru Export and Import Value & Volume, 2018-2019 ($)
Figure 52: Colombia Packaged Nuts & Seeds Market Value & Volume, 2021-2026 ($)
Figure 53: Colombia GDP and Population, 2018-2019 ($)
Figure 54: Colombia GDP – Composition of 2018, By Sector of Origin
Figure 55: Colombia Export and Import Value & Volume, 2018-2019 ($)
Figure 56: Costa Rica Packaged Nuts & Seeds Market Value & Volume, 2021-2026 ($)
Figure 57: Costa Rica GDP and Population, 2018-2019 ($)
Figure 58: Costa Rica GDP – Composition of 2018, By Sector of Origin
Figure 59: Costa Rica Export and Import Value & Volume, 2018-2019 ($)
Figure 60: Europe Packaged Nuts & Seeds Market Value & Volume, 2021-2026 ($)
Figure 61: U.K Packaged Nuts & Seeds Market Value & Volume, 2021-2026 ($)
Figure 62: U.K GDP and Population, 2018-2019 ($)
Figure 63: U.K GDP – Composition of 2018, By Sector of Origin
Figure 64: U.K Export and Import Value & Volume, 2018-2019 ($)
Figure 65: Germany Packaged Nuts & Seeds Market Value & Volume, 2021-2026 ($)
Figure 66: Germany GDP and Population, 2018-2019 ($)
Figure 67: Germany GDP – Composition of 2018, By Sector of Origin
Figure 68: Germany Export and Import Value & Volume, 2018-2019 ($)
Figure 69: Italy Packaged Nuts & Seeds Market Value & Volume, 2021-2026 ($)
Figure 70: Italy GDP and Population, 2018-2019 ($)
Figure 71: Italy GDP – Composition of 2018, By Sector of Origin
Figure 72: Italy Export and Import Value & Volume, 2018-2019 ($)
Figure 73: France Packaged Nuts & Seeds Market Value & Volume, 2021-2026 ($)
Figure 74: France GDP and Population, 2018-2019 ($)
Figure 75: France GDP – Composition of 2018, By Sector of Origin
Figure 76: France Export and Import Value & Volume, 2018-2019 ($)
Figure 77: Netherlands Packaged Nuts & Seeds Market Value & Volume, 2021-2026 ($)
Figure 78: Netherlands GDP and Population, 2018-2019 ($)
Figure 79: Netherlands GDP – Composition of 2018, By Sector of Origin
Figure 80: Netherlands Export and Import Value & Volume, 2018-2019 ($)
Figure 81: Belgium Packaged Nuts & Seeds Market Value & Volume, 2021-2026 ($)
Figure 82: Belgium GDP and Population, 2018-2019 ($)
Figure 83: Belgium GDP – Composition of 2018, By Sector of Origin
Figure 84: Belgium Export and Import Value & Volume, 2018-2019 ($)
Figure 85: Spain Packaged Nuts & Seeds Market Value & Volume, 2021-2026 ($)
Figure 86: Spain GDP and Population, 2018-2019 ($)
Figure 87: Spain GDP – Composition of 2018, By Sector of Origin
Figure 88: Spain Export and Import Value & Volume, 2018-2019 ($)
Figure 89: Denmark Packaged Nuts & Seeds Market Value & Volume, 2021-2026 ($)
Figure 90: Denmark GDP and Population, 2018-2019 ($)
Figure 91: Denmark GDP – Composition of 2018, By Sector of Origin
Figure 92: Denmark Export and Import Value & Volume, 2018-2019 ($)
Figure 93: APAC Packaged Nuts & Seeds Market Value & Volume, 2021-2026 ($)
Figure 94: China Packaged Nuts & Seeds Market Value & Volume, 2021-2026
Figure 95: China GDP and Population, 2018-2019 ($)
Figure 96: China GDP – Composition of 2018, By Sector of Origin
Figure 97: China Export and Import Value & Volume, 2018-2019 ($)Packaged Nuts & Seeds Market China Export and Import Value & Volume, 2018-2019 ($)
Figure 98: Australia Packaged Nuts & Seeds Market Value & Volume, 2021-2026 ($)
Figure 99: Australia GDP and Population, 2018-2019 ($)
Figure 100: Australia GDP – Composition of 2018, By Sector of Origin
Figure 101: Australia Export and Import Value & Volume, 2018-2019 ($)
Figure 102: South Korea Packaged Nuts & Seeds Market Value & Volume, 2021-2026 ($)
Figure 103: South Korea GDP and Population, 2018-2019 ($)
Figure 104: South Korea GDP – Composition of 2018, By Sector of Origin
Figure 105: South Korea Export and Import Value & Volume, 2018-2019 ($)
Figure 106: India Packaged Nuts & Seeds Market Value & Volume, 2021-2026 ($)
Figure 107: India GDP and Population, 2018-2019 ($)
Figure 108: India GDP – Composition of 2018, By Sector of Origin
Figure 109: India Export and Import Value & Volume, 2018-2019 ($)
Figure 110: Taiwan Packaged Nuts & Seeds Market Value & Volume, 2021-2026 ($)
Figure 111: Taiwan GDP and Population, 2018-2019 ($)
Figure 112: Taiwan GDP – Composition of 2018, By Sector of Origin
Figure 113: Taiwan Export and Import Value & Volume, 2018-2019 ($)
Figure 114: Malaysia Packaged Nuts & Seeds Market Value & Volume, 2021-2026 ($)
Figure 115: Malaysia GDP and Population, 2018-2019 ($)
Figure 116: Malaysia GDP – Composition of 2018, By Sector of Origin
Figure 117: Malaysia Export and Import Value & Volume, 2018-2019 ($)
Figure 118: Hong Kong Packaged Nuts & Seeds Market Value & Volume, 2021-2026 ($)
Figure 119: Hong Kong GDP and Population, 2018-2019 ($)
Figure 120: Hong Kong GDP – Composition of 2018, By Sector of Origin
Figure 121: Hong Kong Export and Import Value & Volume, 2018-2019 ($)
Figure 122: Middle East & Africa Packaged Nuts & Seeds Market Middle East & Africa 3D Printing Market Value & Volume, 2021-2026 ($)
Figure 123: Russia Packaged Nuts & Seeds Market Value & Volume, 2021-2026 ($)
Figure 124: Russia GDP and Population, 2018-2019 ($)
Figure 125: Russia GDP – Composition of 2018, By Sector of Origin
Figure 126: Russia Export and Import Value & Volume, 2018-2019 ($)
Figure 127: Israel Packaged Nuts & Seeds Market Value & Volume, 2021-2026 ($)
Figure 128: Israel GDP and Population, 2018-2019 ($)
Figure 129: Israel GDP – Composition of 2018, By Sector of Origin
Figure 130: Israel Export and Import Value & Volume, 2018-2019 ($)
Figure 131: Entropy Share, By Strategies, 2018-2019* (%)Packaged Nuts & Seeds Market
Figure 132: Developments, 2018-2019*Packaged Nuts & Seeds Market
Figure 133: Company 1 Packaged Nuts & Seeds Market Net Revenue, By Years, 2018-2019* ($)
Figure 134: Company 1 Packaged Nuts & Seeds Market Net Revenue Share, By Business segments, 2018 (%)
Figure 135: Company 1 Packaged Nuts & Seeds Market Net Sales Share, By Geography, 2018 (%)
Figure 136: Company 2 Packaged Nuts & Seeds Market Net Revenue, By Years, 2018-2019* ($)
Figure 137: Company 2 Packaged Nuts & Seeds Market Net Revenue Share, By Business segments, 2018 (%)
Figure 138: Company 2 Packaged Nuts & Seeds Market Net Sales Share, By Geography, 2018 (%)
Figure 139: Company 3Packaged Nuts & Seeds Market Net Revenue, By Years, 2018-2019* ($)
Figure 140: Company 3Packaged Nuts & Seeds Market Net Revenue Share, By Business segments, 2018 (%)
Figure 141: Company 3Packaged Nuts & Seeds Market Net Sales Share, By Geography, 2018 (%)
Figure 142: Company 4 Packaged Nuts & Seeds Market Net Revenue, By Years, 2018-2019* ($)
Figure 143: Company 4 Packaged Nuts & Seeds Market Net Revenue Share, By Business segments, 2018 (%)
Figure 144: Company 4 Packaged Nuts & Seeds Market Net Sales Share, By Geography, 2018 (%)
Figure 145: Company 5 Packaged Nuts & Seeds Market Net Revenue, By Years, 2018-2019* ($)
Figure 146: Company 5 Packaged Nuts & Seeds Market Net Revenue Share, By Business segments, 2018 (%)
Figure 147: Company 5 Packaged Nuts & Seeds Market Net Sales Share, By Geography, 2018 (%)
Figure 148: Company 6 Packaged Nuts & Seeds Market Net Revenue, By Years, 2018-2019* ($)
Figure 149: Company 6 Packaged Nuts & Seeds Market Net Revenue Share, By Business segments, 2018 (%)
Figure 150: Company 6 Packaged Nuts & Seeds Market Net Sales Share, By Geography, 2018 (%)
Figure 151: Company 7 Packaged Nuts & Seeds Market Net Revenue, By Years, 2018-2019* ($)
Figure 152: Company 7 Packaged Nuts & Seeds Market Net Revenue Share, By Business segments, 2018 (%)
Figure 153: Company 7 Packaged Nuts & Seeds Market Net Sales Share, By Geography, 2018 (%)
Figure 154: Company 8 Packaged Nuts & Seeds Market Net Revenue, By Years, 2018-2019* ($)
Figure 155: Company 8 Packaged Nuts & Seeds Market Net Revenue Share, By Business segments, 2018 (%)
Figure 156: Company 8 Packaged Nuts & Seeds Market Net Sales Share, By Geography, 2018 (%)
Figure 157: Company 9 Packaged Nuts & Seeds Market Net Revenue, By Years, 2018-2019* ($)
Figure 158: Company 9 Packaged Nuts & Seeds Market Net Revenue Share, By Business segments, 2018 (%)
Figure 159: Company 9 Packaged Nuts & Seeds Market Net Sales Share, By Geography, 2018 (%)
Figure 160: Company 10 Packaged Nuts & Seeds Market Net Revenue, By Years, 2018-2019* ($)
Figure 161: Company 10 Packaged Nuts & Seeds Market Net Revenue Share, By Business segments, 2018 (%)
Figure 162: Company 10 Packaged Nuts & Seeds Market Net Sales Share, By Geography, 2018 (%)
Figure 163: Company 11 Packaged Nuts & Seeds Market Net Revenue, By Years, 2018-2019* ($)
Figure 164: Company 11 Packaged Nuts & Seeds Market Net Revenue Share, By Business segments, 2018 (%)
Figure 165: Company 11 Packaged Nuts & Seeds Market Net Sales Share, By Geography, 2018 (%)
Figure 166: Company 12 Packaged Nuts & Seeds Market Net Revenue, By Years, 2018-2019* ($)
Figure 167: Company 12 Packaged Nuts & Seeds Market Net Revenue Share, By Business segments, 2018 (%)
Figure 168: Company 12 Packaged Nuts & Seeds Market Net Sales Share, By Geography, 2018 (%)
Figure 169: Company 13Packaged Nuts & Seeds Market Net Revenue, By Years, 2018-2019* ($)
Figure 170: Company 13Packaged Nuts & Seeds Market Net Revenue Share, By Business segments, 2018 (%)
Figure 171: Company 13Packaged Nuts & Seeds Market Net Sales Share, By Geography, 2018 (%)
Figure 172: Company 14 Packaged Nuts & Seeds Market Net Revenue, By Years, 2018-2019* ($)
Figure 173: Company 14 Packaged Nuts & Seeds Market Net Revenue Share, By Business segments, 2018 (%)
Figure 174: Company 14 Packaged Nuts & Seeds Market Net Sales Share, By Geography, 2018 (%)
Figure 175: Company 15 Packaged Nuts & Seeds Market Net Revenue, By Years, 2018-2019* ($)
Figure 176: Company 15 Packaged Nuts & Seeds Market Net Revenue Share, By Business segments, 2018 (%)
Figure 177: Company 15 Packaged Nuts & Seeds Market Net Sales Share, By Geography, 2018 (%)