 Email
Email Print
Print


Functional Fluid Market Overview
The Functional Fluid Market size is estimated to reach US$55.2 billion by 2027, after growing at a CAGR of 4.1% during the forecast period 2022-2027. The key attributes of functional fluids such as process oil, metalworking fluids, hydraulic & transmission fluids and others are high-temperature stability, high viscosity index, low traction coefficient and low pouring points. These fluids also have high viscosity index. As a result of these properties, functional fluids are utilized across various end-use industries such as construction, metals & mining and more to ensure efficient working of the machine. The expansion of the transportation industry is fueling the demand for functional fluids, which, in turn, is driving the growth of the functional fluids market. Moreover, the growing construction industry is anticipated to fuel the demand for functional fluids because it is utilized in machine parts, engines and other equipment. This would drive the Functional Fluid Market size growth during the forecast period of 2022-2027. However, the COVID-19 pandemic created a bottleneck for the functional fluid industry growth because the industrial activities associated with automotive, oil & gas and other industries were put to a halt. According to the Organisation Internationale des Constructeurs d'Automobiles, in 2020, the global automotive industry contrasted by 13%. Nevertheless, in 2021, the surge in industrial production activities fueled the growth of the Functional Fluid industry.
Report Coverage
The "Functional Fluid Market Report – Forecast (2022-2027)” by IndustryARC, covers an in-depth analysis of the following segments in the Functional Fluid Market.
Key Takeaways
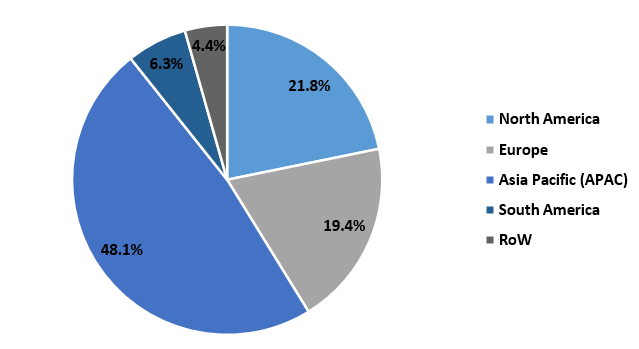
- Asia-Pacific dominated the Functional Fluid Market, owing to the automotive industry growth in the region. According to the China Association of Automobile Manufacturers (CAAM), in 2021, the total number of cars manufactured in China was 26,082,000, an increase of 2.4% over 2020.
- The crucial determinants such as increasing disposable income, surging demand for commercial space and others are driving the growth of building and construction activities. This factor is accelerating market growth.
- The increasing developments and innovations associated with synthetic lubricants would create a potential for market growth in the upcoming years.
- However, the fluctuations in the raw materials prices of Functional Fluid may restrict the market growth during the forecast period of 2022-2027.
Figure: Functional Fluid Market Revenue Share, by Geography , 2021 (%)
For More Details On this report - Request For Sample
Functional Fluid Market Segment Analysis – by Product Type
The process oil segment held the significant Functional Fluid Market share in 2021 and is projected to grow at a CAGR of 4.3% during the forecast period 2022-2027. Process oil, composed of poly-alpha-olefins, esters and other base oils, has several important qualities, including heat stability and oxidative property. These characteristics enable process oil to smooth out the processing unit during the creation of finished items. It increases the effectiveness of machinery and aids in the production of high-quality goods. The process oils are utilized across various end-use industries such as automotive, construction and more. Process oil manufacturers are launching new products to enhance machine functioning. In May 2020, a highly variable process oil, Nytex 8022, was released by Nynas. Nytex 8022 is an ideal product to meet the formulation requirements for extremely concentrated chemical additives (such as mineral oil-based antifoam) that must have the active ingredients solubilized while remaining label-free. Additionally, its high flash point enables the safe solubilization of the additives at high temperatures. Thus, the latest product launches associated with process oils would benefit the market growth during the projected forecast period.
Functional Fluid Market Segment Analysis – by End-use Industry
The transportation segment held a significant Functional Fluid Market share of over 20% in 2021. Functional fluids are essential for keeping transport vehicles operating at their peak performance, from automotive to aircraft. Functional fluids such as hydraulic & transmission fluids provide performance and maintenance solutions for many vehicle surfaces and parts, including brakes and engines. The factors such as the increasing adoption of passenger cars, the booming transport production and others are accelerating the growth of the automotive industry. According to the European Automobile Manufacturers’ Association (ACEA), in 2021, 2.1 million commercial vehicles were produced in the European Union region, an increase of 1.0% over 2020. Moreover, according to the Organisation Internationale des Constructeurs d'Automobiles (OICA), in 2020, the passenger car production at the global level was 55,908,989 units and in 2021, it was 57,054,295 units. This was 2% higher in comparison with 2020. Hence, the bolstering transport industry is fueling the demand for machines, engines and other automotive parts. This factor is propelling the Functional Fluid Market growth.
Functional Fluid Market Segment Analysis – by Geography
Asia-Pacific is the dominating region as it held the largest Functional Fluid Market share of up to 48% in 2021. The surge in the sectoral growth of the Asia-Pacific countries is due to the expansion of the various industries, including automotive, building & construction and more. The key variables such as the rapid phase of industrialization, increasing consumer income, surge in the demand for heavy commercial vehicles and other vital factors are driving the automotive industry growth in Asia-Pacific. According to the Society of Indian Automobile Manufacturers (SIAM), in 2020, the total automobile production in India was 22,655,609 units and in 2021, it was 22,933,230 units, an increase of 1.2%. Moreover, according to the Organisation Internationale des Constructeurs d'Automobiles (OICA), in 2020, the production of light commercial vehicles in Asia-Pacific was 4,668,333 units and in 2021, it was 5,099,264 units, an increase of 9%. Therefore, the growth of the transportation industry in Asia-Pacific is fueling the demand for vehicle parts.
Functional Fluid Market Drivers
Increasing Utilization of Functional Fluids in Industrial Application
Functional fluids are utilized across various industries, including food & beverages, paper & pulp and more to increase the service life of machines. Technological advancement, product innovations, new manufacturing facility development and other vital factors are accelerating industrial growth. In 2021, Diana Pet Food purchased 3,400 square meters of land in Mexico for the construction of a new food processing facility. By the end of 2024, the new food processing facility should be fully developed. Also, in March 2022, work began on the 33.4 trillion rupiahs (US$2.33 billion) Asia Pacific Resources International Ltd (APRIL Group) paperboard facility in Indonesia, with completion scheduled for the third quarter of 2023. Hence, the growth of the food & beverages, paper & pulp and other industries is fueling the demand for Functional Fluids, which, in turn, is propelling the market growth.
Booming Application in Construction Industry
In the construction sector, Functional Fluids are employed in the engine, gears and other parts to reduce the deteriorating impact of corrosion. The growth of the construction sector at the global level is fueling the demand for construction equipment such as cranes, concrete mixers and more. According to the Committee for European Construction Equipment (CECE), construction equipment in Europe stayed on a growth path in 2021, with a growth of 24% when compared with 2020. Moreover, Unicon, Denmark's largest producer and supplier of ready-mixed concrete, has placed the largest private single purchase for concrete mixing electric trucks to date. The 11 Volvo FM Electric trucks would be delivered by the end of 2022. Thus, the growth of the construction industry is accelerating the demand for functional fluids. As a result, the market revenue is surging. This determinant is proliferating the market growth.
Functional Fluid Market Challenge
Fluctuations in the Raw Material Prices
Crude-oil-derived raw materials and emulsifiers are used in the manufacturing of Functional Fluid. The key variables such as logistics and supply chain, shortage of raw materials and other factors are impacting the pricing of the Crude-oil-derived raw materials. Moreover, the ongoing Russia-Ukraine war has highly impacted crude oil prices. For instance, according to the World Bank, Brent crude oil prices are expected to average $100 per barrel in 2022, the highest level since 2013 and a more than 40% increase over 2021. This causes ethylene carbonate raw material costs to fluctuate. Hence, the fluctuations in the prices of raw materials may restrict the Functional Fluid industry growth during the projected forecast period.
Functional Fluid Industry Outlook
Technology launches, acquisitions and increased R&D activities are key strategies adopted by players in the Functional Fluid Market. The top 10 companies in the Functional Fluid Market are:
- Exxon Mobil Corporation
- Royal Dutch Shell Plc
- Chevron Corporation
- BP PLC
- BASF SE
- PETRONAS
- Idemitsu Kosan Co. Ltd.
- Fuchs Petrolub AG.
- Huntsman
- Dow Chemical Company
Recent Developments:
- In October 2020, Biosynthetic Technologies launched BioceaTM, a new product line of cutting-edge additives for the metalworking fluids market. These innovative, environmentally friendly additives are biobased, biodegradable, non-bioaccumulative and non-toxic and employ the proprietary estolide technology.
- In March 2020, Shell introduced Shell Tellus S4 VE, a new gas-to-liquid (GTL)-formulated hydraulic fluid created exclusively for mobile hydraulics in the construction industry.
- In February 2019, the US-based manufacturer of metalworking fluids, Chemtool Incorporated, introduced Lubricant 4284, a new line of synthetic metalworking fluids intended for machining and grinding aluminum and other ferrous and non-ferrous alloys.
Relevant Reports
For more Chemicals and Materials Market reports, please click here
Table 1: Functional Fluid Market Overview 2021-2026
Table 2: Functional Fluid Market Leader Analysis 2018-2019 (US$)
Table 3: Functional Fluid Market Product Analysis 2018-2019 (US$)
Table 4: Functional Fluid Market End User Analysis 2018-2019 (US$)
Table 5: Functional Fluid Market Patent Analysis 2013-2018* (US$)
Table 6: Functional Fluid Market Financial Analysis 2018-2019 (US$)
Table 7: Functional Fluid Market Driver Analysis 2018-2019 (US$)
Table 8: Functional Fluid Market Challenges Analysis 2018-2019 (US$)
Table 9: Functional Fluid Market Constraint Analysis 2018-2019 (US$)
Table 10: Functional Fluid Market Supplier Bargaining Power Analysis 2018-2019 (US$)
Table 11: Functional Fluid Market Buyer Bargaining Power Analysis 2018-2019 (US$)
Table 12: Functional Fluid Market Threat of Substitutes Analysis 2018-2019 (US$)
Table 13: Functional Fluid Market Threat of New Entrants Analysis 2018-2019 (US$)
Table 14: Functional Fluid Market Degree of Competition Analysis 2018-2019 (US$)
Table 15: Functional Fluid Market Value Chain Analysis 2018-2019 (US$)
Table 16: Functional Fluid Market Pricing Analysis 2021-2026 (US$)
Table 17: Functional Fluid Market Opportunities Analysis 2021-2026 (US$)
Table 18: Functional Fluid Market Product Life Cycle Analysis 2021-2026 (US$)
Table 19: Functional Fluid Market Supplier Analysis 2018-2019 (US$)
Table 20: Functional Fluid Market Distributor Analysis 2018-2019 (US$)
Table 21: Functional Fluid Market Trend Analysis 2018-2019 (US$)
Table 22: Functional Fluid Market Size 2018 (US$)
Table 23: Functional Fluid Market Forecast Analysis 2021-2026 (US$)
Table 24: Functional Fluid Market Sales Forecast Analysis 2021-2026 (Units)
Table 25: Functional Fluid Market, Revenue & Volume, By Type, 2021-2026 ($)
Table 26: Functional Fluid Market By Type, Revenue & Volume, By Bio Hydraulic Fluid, 2021-2026 ($)
Table 27: Functional Fluid Market By Type, Revenue & Volume, By Heat Transfer fluid, 2021-2026 ($)
Table 28: Functional Fluid Market By Type, Revenue & Volume, By Metal Working fluid, 2021-2026 ($)
Table 29: Functional Fluid Market By Type, Revenue & Volume, By Coating Fluids, 2021-2026 ($)
Table 30: Functional Fluid Market, Revenue & Volume, By End User Industry, 2021-2026 ($)
Table 31: Functional Fluid Market By End User Industry, Revenue & Volume, By Automobile Industry, 2021-2026 ($)
Table 32: Functional Fluid Market By End User Industry, Revenue & Volume, By Construction, 2021-2026 ($)
Table 33: Functional Fluid Market By End User Industry, Revenue & Volume, By Metal Fabrication Industry, 2021-2026 ($)
Table 34: Functional Fluid Market By End User Industry, Revenue & Volume, By Industrial, 2021-2026 ($)
Table 35: North America Functional Fluid Market, Revenue & Volume, By Type, 2021-2026 ($)
Table 36: North America Functional Fluid Market, Revenue & Volume, By End User Industry, 2021-2026 ($)
Table 37: South america Functional Fluid Market, Revenue & Volume, By Type, 2021-2026 ($)
Table 38: South america Functional Fluid Market, Revenue & Volume, By End User Industry, 2021-2026 ($)
Table 39: Europe Functional Fluid Market, Revenue & Volume, By Type, 2021-2026 ($)
Table 40: Europe Functional Fluid Market, Revenue & Volume, By End User Industry, 2021-2026 ($)
Table 41: APAC Functional Fluid Market, Revenue & Volume, By Type, 2021-2026 ($)
Table 42: APAC Functional Fluid Market, Revenue & Volume, By End User Industry, 2021-2026 ($)
Table 43: Middle East & Africa Functional Fluid Market, Revenue & Volume, By Type, 2021-2026 ($)
Table 44: Middle East & Africa Functional Fluid Market, Revenue & Volume, By End User Industry, 2021-2026 ($)
Table 45: Russia Functional Fluid Market, Revenue & Volume, By Type, 2021-2026 ($)
Table 46: Russia Functional Fluid Market, Revenue & Volume, By End User Industry, 2021-2026 ($)
Table 47: Israel Functional Fluid Market, Revenue & Volume, By Type, 2021-2026 ($)
Table 48: Israel Functional Fluid Market, Revenue & Volume, By End User Industry, 2021-2026 ($)
Table 49: Top Companies 2018 (US$)Functional Fluid Market, Revenue & Volume
Table 50: Product Launch 2018-2019Functional Fluid Market, Revenue & Volume
Table 51: Mergers & Acquistions 2018-2019Functional Fluid Market, Revenue & Volume
List of Figures
Figure 1: Overview of Functional Fluid Market 2021-2026
Figure 2: Market Share Analysis for Functional Fluid Market 2018 (US$)
Figure 3: Product Comparison in Functional Fluid Market 2018-2019 (US$)
Figure 4: End User Profile for Functional Fluid Market 2018-2019 (US$)
Figure 5: Patent Application and Grant in Functional Fluid Market 2013-2018* (US$)
Figure 6: Top 5 Companies Financial Analysis in Functional Fluid Market 2018-2019 (US$)
Figure 7: Market Entry Strategy in Functional Fluid Market 2018-2019
Figure 8: Ecosystem Analysis in Functional Fluid Market 2018
Figure 9: Average Selling Price in Functional Fluid Market 2021-2026
Figure 10: Top Opportunites in Functional Fluid Market 2018-2019
Figure 11: Market Life Cycle Analysis in Functional Fluid Market
Figure 12: GlobalBy TypeFunctional Fluid Market Revenue, 2021-2026 ($)
Figure 13: GlobalBy End User IndustryFunctional Fluid Market Revenue, 2021-2026 ($)
Figure 14: Global Functional Fluid Market - By Geography
Figure 15: Global Functional Fluid Market Value & Volume, By Geography, 2021-2026 ($)
Figure 16: Global Functional Fluid Market CAGR, By Geography, 2021-2026 (%)
Figure 17: North America Functional Fluid Market Value & Volume, 2021-2026 ($)
Figure 18: US Functional Fluid Market Value & Volume, 2021-2026 ($)
Figure 19: US GDP and Population, 2018-2019 ($)
Figure 20: US GDP – Composition of 2018, By Sector of Origin
Figure 21: US Export and Import Value & Volume, 2018-2019 ($)
Figure 22: Canada Functional Fluid Market Value & Volume, 2021-2026 ($)
Figure 23: Canada GDP and Population, 2018-2019 ($)
Figure 24: Canada GDP – Composition of 2018, By Sector of Origin
Figure 25: Canada Export and Import Value & Volume, 2018-2019 ($)
Figure 26: Mexico Functional Fluid Market Value & Volume, 2021-2026 ($)
Figure 27: Mexico GDP and Population, 2018-2019 ($)
Figure 28: Mexico GDP – Composition of 2018, By Sector of Origin
Figure 29: Mexico Export and Import Value & Volume, 2018-2019 ($)
Figure 30: South America Functional Fluid Market Value & Volume, 2021-2026 ($)
Figure 31: Brazil Functional Fluid Market Value & Volume, 2021-2026 ($)
Figure 32: Brazil GDP and Population, 2018-2019 ($)
Figure 33: Brazil GDP – Composition of 2018, By Sector of Origin
Figure 34: Brazil Export and Import Value & Volume, 2018-2019 ($)
Figure 35: Venezuela Functional Fluid Market Value & Volume, 2021-2026 ($)
Figure 36: Venezuela GDP and Population, 2018-2019 ($)
Figure 37: Venezuela GDP – Composition of 2018, By Sector of Origin
Figure 38: Venezuela Export and Import Value & Volume, 2018-2019 ($)
Figure 39: Argentina Functional Fluid Market Value & Volume, 2021-2026 ($)
Figure 40: Argentina GDP and Population, 2018-2019 ($)
Figure 41: Argentina GDP – Composition of 2018, By Sector of Origin
Figure 42: Argentina Export and Import Value & Volume, 2018-2019 ($)
Figure 43: Ecuador Functional Fluid Market Value & Volume, 2021-2026 ($)
Figure 44: Ecuador GDP and Population, 2018-2019 ($)
Figure 45: Ecuador GDP – Composition of 2018, By Sector of Origin
Figure 46: Ecuador Export and Import Value & Volume, 2018-2019 ($)
Figure 47: Peru Functional Fluid Market Value & Volume, 2021-2026 ($)
Figure 48: Peru GDP and Population, 2018-2019 ($)
Figure 49: Peru GDP – Composition of 2018, By Sector of Origin
Figure 50: Peru Export and Import Value & Volume, 2018-2019 ($)
Figure 51: Colombia Functional Fluid Market Value & Volume, 2021-2026 ($)
Figure 52: Colombia GDP and Population, 2018-2019 ($)
Figure 53: Colombia GDP – Composition of 2018, By Sector of Origin
Figure 54: Colombia Export and Import Value & Volume, 2018-2019 ($)
Figure 55: Costa Rica Functional Fluid Market Value & Volume, 2021-2026 ($)
Figure 56: Costa Rica GDP and Population, 2018-2019 ($)
Figure 57: Costa Rica GDP – Composition of 2018, By Sector of Origin
Figure 58: Costa Rica Export and Import Value & Volume, 2018-2019 ($)
Figure 59: Europe Functional Fluid Market Value & Volume, 2021-2026 ($)
Figure 60: U.K Functional Fluid Market Value & Volume, 2021-2026 ($)
Figure 61: U.K GDP and Population, 2018-2019 ($)
Figure 62: U.K GDP – Composition of 2018, By Sector of Origin
Figure 63: U.K Export and Import Value & Volume, 2018-2019 ($)
Figure 64: Germany Functional Fluid Market Value & Volume, 2021-2026 ($)
Figure 65: Germany GDP and Population, 2018-2019 ($)
Figure 66: Germany GDP – Composition of 2018, By Sector of Origin
Figure 67: Germany Export and Import Value & Volume, 2018-2019 ($)
Figure 68: Italy Functional Fluid Market Value & Volume, 2021-2026 ($)
Figure 69: Italy GDP and Population, 2018-2019 ($)
Figure 70: Italy GDP – Composition of 2018, By Sector of Origin
Figure 71: Italy Export and Import Value & Volume, 2018-2019 ($)
Figure 72: France Functional Fluid Market Value & Volume, 2021-2026 ($)
Figure 73: France GDP and Population, 2018-2019 ($)
Figure 74: France GDP – Composition of 2018, By Sector of Origin
Figure 75: France Export and Import Value & Volume, 2018-2019 ($)
Figure 76: Netherlands Functional Fluid Market Value & Volume, 2021-2026 ($)
Figure 77: Netherlands GDP and Population, 2018-2019 ($)
Figure 78: Netherlands GDP – Composition of 2018, By Sector of Origin
Figure 79: Netherlands Export and Import Value & Volume, 2018-2019 ($)
Figure 80: Belgium Functional Fluid Market Value & Volume, 2021-2026 ($)
Figure 81: Belgium GDP and Population, 2018-2019 ($)
Figure 82: Belgium GDP – Composition of 2018, By Sector of Origin
Figure 83: Belgium Export and Import Value & Volume, 2018-2019 ($)
Figure 84: Spain Functional Fluid Market Value & Volume, 2021-2026 ($)
Figure 85: Spain GDP and Population, 2018-2019 ($)
Figure 86: Spain GDP – Composition of 2018, By Sector of Origin
Figure 87: Spain Export and Import Value & Volume, 2018-2019 ($)
Figure 88: Denmark Functional Fluid Market Value & Volume, 2021-2026 ($)
Figure 89: Denmark GDP and Population, 2018-2019 ($)
Figure 90: Denmark GDP – Composition of 2018, By Sector of Origin
Figure 91: Denmark Export and Import Value & Volume, 2018-2019 ($)
Figure 92: APAC Functional Fluid Market Value & Volume, 2021-2026 ($)
Figure 93: China Functional Fluid Market Value & Volume, 2021-2026
Figure 94: China GDP and Population, 2018-2019 ($)
Figure 95: China GDP – Composition of 2018, By Sector of Origin
Figure 96: China Export and Import Value & Volume, 2018-2019 ($)Functional Fluid Market China Export and Import Value & Volume, 2018-2019 ($)
Figure 97: Australia Functional Fluid Market Value & Volume, 2021-2026 ($)
Figure 98: Australia GDP and Population, 2018-2019 ($)
Figure 99: Australia GDP – Composition of 2018, By Sector of Origin
Figure 100: Australia Export and Import Value & Volume, 2018-2019 ($)
Figure 101: South Korea Functional Fluid Market Value & Volume, 2021-2026 ($)
Figure 102: South Korea GDP and Population, 2018-2019 ($)
Figure 103: South Korea GDP – Composition of 2018, By Sector of Origin
Figure 104: South Korea Export and Import Value & Volume, 2018-2019 ($)
Figure 105: India Functional Fluid Market Value & Volume, 2021-2026 ($)
Figure 106: India GDP and Population, 2018-2019 ($)
Figure 107: India GDP – Composition of 2018, By Sector of Origin
Figure 108: India Export and Import Value & Volume, 2018-2019 ($)
Figure 109: Taiwan Functional Fluid Market Value & Volume, 2021-2026 ($)
Figure 110: Taiwan GDP and Population, 2018-2019 ($)
Figure 111: Taiwan GDP – Composition of 2018, By Sector of Origin
Figure 112: Taiwan Export and Import Value & Volume, 2018-2019 ($)
Figure 113: Malaysia Functional Fluid Market Value & Volume, 2021-2026 ($)
Figure 114: Malaysia GDP and Population, 2018-2019 ($)
Figure 115: Malaysia GDP – Composition of 2018, By Sector of Origin
Figure 116: Malaysia Export and Import Value & Volume, 2018-2019 ($)
Figure 117: Hong Kong Functional Fluid Market Value & Volume, 2021-2026 ($)
Figure 118: Hong Kong GDP and Population, 2018-2019 ($)
Figure 119: Hong Kong GDP – Composition of 2018, By Sector of Origin
Figure 120: Hong Kong Export and Import Value & Volume, 2018-2019 ($)
Figure 121: Middle East & Africa Functional Fluid Market Middle East & Africa 3D Printing Market Value & Volume, 2021-2026 ($)
Figure 122: Russia Functional Fluid Market Value & Volume, 2021-2026 ($)
Figure 123: Russia GDP and Population, 2018-2019 ($)
Figure 124: Russia GDP – Composition of 2018, By Sector of Origin
Figure 125: Russia Export and Import Value & Volume, 2018-2019 ($)
Figure 126: Israel Functional Fluid Market Value & Volume, 2021-2026 ($)
Figure 127: Israel GDP and Population, 2018-2019 ($)
Figure 128: Israel GDP – Composition of 2018, By Sector of Origin
Figure 129: Israel Export and Import Value & Volume, 2018-2019 ($)
Figure 130: Entropy Share, By Strategies, 2018-2019* (%)Functional Fluid Market
Figure 131: Developments, 2018-2019*Functional Fluid Market
Figure 132: Company 1 Functional Fluid Market Net Revenue, By Years, 2018-2019* ($)
Figure 133: Company 1 Functional Fluid Market Net Revenue Share, By Business segments, 2018 (%)
Figure 134: Company 1 Functional Fluid Market Net Sales Share, By Geography, 2018 (%)
Figure 135: Company 2 Functional Fluid Market Net Revenue, By Years, 2018-2019* ($)
Figure 136: Company 2 Functional Fluid Market Net Revenue Share, By Business segments, 2018 (%)
Figure 137: Company 2 Functional Fluid Market Net Sales Share, By Geography, 2018 (%)
Figure 138: Company 3 Functional Fluid Market Net Revenue, By Years, 2018-2019* ($)
Figure 139: Company 3 Functional Fluid Market Net Revenue Share, By Business segments, 2018 (%)
Figure 140: Company 3 Functional Fluid Market Net Sales Share, By Geography, 2018 (%)
Figure 141: Company 4 Functional Fluid Market Net Revenue, By Years, 2018-2019* ($)
Figure 142: Company 4 Functional Fluid Market Net Revenue Share, By Business segments, 2018 (%)
Figure 143: Company 4 Functional Fluid Market Net Sales Share, By Geography, 2018 (%)
Figure 144: Company 5 Functional Fluid Market Net Revenue, By Years, 2018-2019* ($)
Figure 145: Company 5 Functional Fluid Market Net Revenue Share, By Business segments, 2018 (%)
Figure 146: Company 5 Functional Fluid Market Net Sales Share, By Geography, 2018 (%)
Figure 147: Company 6 Functional Fluid Market Net Revenue, By Years, 2018-2019* ($)
Figure 148: Company 6 Functional Fluid Market Net Revenue Share, By Business segments, 2018 (%)
Figure 149: Company 6 Functional Fluid Market Net Sales Share, By Geography, 2018 (%)
Figure 150: Company 7 Functional Fluid Market Net Revenue, By Years, 2018-2019* ($)
Figure 151: Company 7 Functional Fluid Market Net Revenue Share, By Business segments, 2018 (%)
Figure 152: Company 7 Functional Fluid Market Net Sales Share, By Geography, 2018 (%)
Figure 153: Company 8 Functional Fluid Market Net Revenue, By Years, 2018-2019* ($)
Figure 154: Company 8 Functional Fluid Market Net Revenue Share, By Business segments, 2018 (%)
Figure 155: Company 8 Functional Fluid Market Net Sales Share, By Geography, 2018 (%)
Figure 156: Company 9 Functional Fluid Market Net Revenue, By Years, 2018-2019* ($)
Figure 157: Company 9 Functional Fluid Market Net Revenue Share, By Business segments, 2018 (%)
Figure 158: Company 9 Functional Fluid Market Net Sales Share, By Geography, 2018 (%)
Figure 159: Company 10 Functional Fluid Market Net Revenue, By Years, 2018-2019* ($)
Figure 160: Company 10 Functional Fluid Market Net Revenue Share, By Business segments, 2018 (%)
Figure 161: Company 10 Functional Fluid Market Net Sales Share, By Geography, 2018 (%)
Figure 162: Company 11 Functional Fluid Market Net Revenue, By Years, 2018-2019* ($)
Figure 163: Company 11 Functional Fluid Market Net Revenue Share, By Business segments, 2018 (%)
Figure 164: Company 11 Functional Fluid Market Net Sales Share, By Geography, 2018 (%)
Figure 165: Company 12 Functional Fluid Market Net Revenue, By Years, 2018-2019* ($)
Figure 166: Company 12 Functional Fluid Market Net Revenue Share, By Business segments, 2018 (%)
Figure 167: Company 12 Functional Fluid Market Net Sales Share, By Geography, 2018 (%)
Figure 168: Company 13 Functional Fluid Market Net Revenue, By Years, 2018-2019* ($)
Figure 169: Company 13 Functional Fluid Market Net Revenue Share, By Business segments, 2018 (%)
Figure 170: Company 13 Functional Fluid Market Net Sales Share, By Geography, 2018 (%)
Figure 171: Company 14 Functional Fluid Market Net Revenue, By Years, 2018-2019* ($)
Figure 172: Company 14 Functional Fluid Market Net Revenue Share, By Business segments, 2018 (%)
Figure 173: Company 14 Functional Fluid Market Net Sales Share, By Geography, 2018 (%)
Figure 174: Company 15 Functional Fluid Market Net Revenue, By Years, 2018-2019* ($)
Figure 175: Company 15 Functional Fluid Market Net Revenue Share, By Business segments, 2018 (%)
Figure 176: Company 15 Functional Fluid Market Net Sales Share, By Geography, 2018 (%)