 Email
Email Print
Print


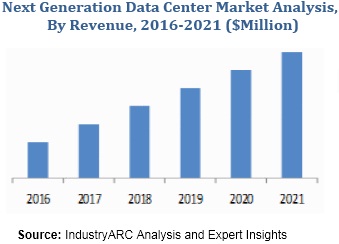
Next Generation Data Center Market - Forecast(2024 - 2030)
The increasing business requirements for advanced processor technologies, complex data evaluation, and high storage demands are attributing to the growth of next generation data center architectures. Moreover, todays business needs highly reliable applications, more servers in the data center and secondary data centers to survive in the competitive and agile environment. Next generation data centers supports the increasing need for highly reliable and the fastest changing business and IT landscape. Moreover, these data centers meet the increasing expectations for high speed, scalability and availability.
The report classifies the next generation data center market with respect to components such as hardware, software, and services. In the next-generation data centers, software accounts for maximum share as most of the critical operational and management functions will be enabled in the software. This is estimated to dramatically impact the Information Technology (IT) sector. Moreover, this will increase efficiency and quality of services by reducing cost and risks. Next generation data centers are at high demand from the content providers to optimize their applications for better control on application flow and gain efficient utilization of the network. Moreover, next generation data centers offer open flexible platform to deliver software defined networking and network intelligence and analytics on massive scale and density. The introduction and growth of next generation data centers have given high impetus to the cloud and data center industry.
The report analyzes the key industry factors affecting the next generation data center market. The major market dynamic factors such as drivers, restraints, challenges and opportunities are analyzed in the report. The impact of these factors on the industry in next 5 years is also covered in the report. The report tracks the entire value chain of the market along with the suppliers and distributor analysis. Moreover, the industry attractiveness section in the offers the significance of the competitive rivalry in the market affected by the forces such as power of supplier, power of buyer, threat of new entrant and threat of substitution. The report provides precise and comprehensive insights on the market trends, industry trends, and macro & micro factors impacting the market growth.
The report also focuses the geographic markets, with special emphasis on North America, Europe, APAC, Latin America, and Middle-East and Africa. Developing countries like China, India, and Brazil have high growth rate for the next generation data center market in recent years and expected that the trend is going to continue through next 5 years. Apart from regional perspective the report also gives detailed insights on country level analysis of the market and identifies new opportunities in such countries. The leading suppliers, manufacturers, OEMs, ODMs, and end-users are identified and mapped in the report.
The competitiveness in the industry is measured on the basis of business development strategies adopted by the leading vendors of next generation data center market. The strategies adopted by the players are new product launches, mergers and acquisitions, partnerships, agreements, collaborations, and JVs.
Sample Companies
Profiled in this Report are:
- IBM
- Cisco
- HCL Technologies
- HP
- Nxt Gen
- 10+.
1. Next Generation Data Center Market - Overview
1.1. Definitions and Scope
2. Next Generation Data Center Market - Executive summary
2.1. Market Revenue, Market Size and Key Trends by Company
2.2. Key Trends by type of Application
2.3. Key Trends segmented by Geography
3. Next Generation Data Center Market
3.1. Comparative analysis
3.1.1. Product Benchmarking - Top 10 companies
3.1.2. Top 5 Financials Analysis
3.1.3. Market Value split by Top 10 companies
3.1.4. Patent Analysis - Top 10 companies
3.1.5. Pricing Analysis
4. Next Generation Data Center Market – Startup companies Scenario Premium
4.1. Top 10 startup company Analysis by
4.1.1. Investment
4.1.2. Revenue
4.1.3. Market Shares
4.1.4. Market Size and Application Analysis
4.1.5. Venture Capital and Funding Scenario
5. Next Generation Data Center Market – Industry Market Entry Scenario Premium
5.1. Regulatory Framework Overview
5.2. New Business and Ease of Doing business index
5.3. Case studies of successful ventures
5.4. Customer Analysis – Top 10 companies
6. Next Generation Data Center Market Forces
6.1. Drivers
6.2. Constraints
6.3. Challenges
6.4. Porters five force model
6.4.1. Bargaining power of suppliers
6.4.2. Bargaining powers of customers
6.4.3. Threat of new entrants
6.4.4. Rivalry among existing players
6.4.5. Threat of substitutes
7. Next Generation Data Center Market -Strategic analysis
7.1. Value chain analysis
7.2. Opportunities analysis
7.3. Product life cycle
7.4. Suppliers and distributors Market Share
8. Next Generation Data Center Market – By Component (Market Size -$Million / $Billion)
8.1. Market Size and Market Share Analysis
8.2. Application Revenue and Trend Research
8.3. Product Segment Analysis
8.3.1. Hardware
8.3.2. Software
8.3.3. Services
11. Next Generation Data Center - By Geography (Market Size -$Million / $Billion)
11.1. Next Generation Data Center Market - North America Segment Research
11.2. North America Market Research (Million / $Billion)
11.2.1. Segment type Size and Market Size Analysis
11.2.2. Revenue and Trends
11.2.3. Application Revenue and Trends by type of Application
11.2.4. Company Revenue and Product Analysis
11.2.5. North America Product type and Application Market Size
11.2.5.1. U.S.
11.2.5.2. Canada
11.2.5.3. Mexico
11.2.5.4. Rest of North America
11.3. Next Generation Data Center - South America Segment Research
11.4. South America Market Research (Market Size -$Million / $Billion)
11.4.1. Segment type Size and Market Size Analysis
11.4.2. Revenue and Trends
11.4.3. Application Revenue and Trends by type of Application
11.4.4. Company Revenue and Product Analysis
11.4.5. South America Product type and Application Market Size
11.4.5.1. Brazil
11.4.5.2. Venezuela
11.4.5.3. Argentina
11.4.5.4. Ecuador
11.4.5.5. Peru
11.4.5.6. Colombia
11.4.5.7. Costa Rica
11.4.5.8. Rest of South America
11.5. Next Generation Data Center - Europe Segment Research
11.6. Europe Market Research (Market Size -$Million / $Billion)
11.6.1. Segment type Size and Market Size Analysis
11.6.2. Revenue and Trends
11.6.3. Application Revenue and Trends by type of Application
11.6.4. Company Revenue and Product Analysis
11.6.5. Europe Segment Product type and Application Market Size
11.6.5.1. U.K
11.6.5.2. Germany
11.6.5.3. Italy
11.6.5.4. France
11.6.5.5. Netherlands
11.6.5.6. Belgium
11.6.5.7. Spain
11.6.5.8. Denmark
11.6.5.9. Rest of Europe
11.7. Next Generation Data Center – APAC Segment Research
11.8. APAC Market Research (Market Size -$Million / $Billion)
11.8.1. Segment type Size and Market Size Analysis
11.8.2. Revenue and Trends
11.8.3. Application Revenue and Trends by type of Application
11.8.4. Company Revenue and Product Analysis
11.8.5. APAC Segment – Product type and Application Market Size
11.8.5.1. China
11.8.5.2. Australia
11.8.5.3. Japan
11.8.5.4. South Korea
11.8.5.5. India
11.8.5.6. Taiwan
11.8.5.7. Malaysia
12. Next Generation Data Center Market - Entropy
12.1. New product launches
12.2. M&A's, collaborations, JVs and partnerships
13. Next Generation Data Center Market – Industry / Segment Competition landscape Premium
13.1. Market Share Analysis
13.1.1. Market Share by Country- Top companies
13.1.2. Market Share by Region- Top 10 companies
13.1.3. Market Share by type of Application – Top 10 companies
13.1.4. Market Share by type of Product / Product category- Top 10 companies
13.1.5. Market Share at global level- Top 10 companies
13.1.6. Best Practises for companies
14. Next Generation Data Center Market – Key Company List by Country Premium
15. Next Generation Data Center Market Company Analysis
15.1. Market Share, Company Revenue, Products, M&A, Developments
15.2. IBM
15.3. Cisco
15.4. HCL Technologies
15.5. HP
15.6. Nxt Gen
15.7. Company 6
15.8. Company 7
15.9. Company 8
15.10. Company 9
15.11. Company 10 and more
"*Financials would be provided on a best efforts basis for private companies"
16. Next Generation Data Center Market -Appendix
16.1. Abbreviations
16.2. Sources
17. Next Generation Data Center Market -Methodology Premium
17.1. Research Methodology
17.1.1. Company Expert Interviews
17.1.2. Industry Databases
17.1.3. Associations
17.1.4. Company News
17.1.5. Company Annual Reports
17.1.6. Application Trends
17.1.7. New Products and Product database
17.1.8. Company Transcripts
17.1.9. R&D Trends
17.1.10. Key Opinion Leaders Interviews
17.1.11. Supply and Demand Trends
List of Tables
Table1 Next Generation Data Center Market Overview 2021-2026
Table2 Next Generation Data Center Market Leader Analysis 2018-2019 (US$)
Table3 Next Generation Data Center MarketProduct Analysis 2018-2019 (US$)
Table4 Next Generation Data Center MarketEnd User Analysis 2018-2019 (US$)
Table5 Next Generation Data Center MarketPatent Analysis 2013-2018* (US$)
Table6 Next Generation Data Center MarketFinancial Analysis 2018-2019 (US$)
Table7 Next Generation Data Center Market Driver Analysis 2018-2019 (US$)
Table8 Next Generation Data Center MarketChallenges Analysis 2018-2019 (US$)
Table9 Next Generation Data Center MarketConstraint Analysis 2018-2019 (US$)
Table10 Next Generation Data Center Market Supplier Bargaining Power Analysis 2018-2019 (US$)
Table11 Next Generation Data Center Market Buyer Bargaining Power Analysis 2018-2019 (US$)
Table12 Next Generation Data Center Market Threat of Substitutes Analysis 2018-2019 (US$)
Table13 Next Generation Data Center Market Threat of New Entrants Analysis 2018-2019 (US$)
Table14 Next Generation Data Center Market Degree of Competition Analysis 2018-2019 (US$)
Table15 Next Generation Data Center MarketValue Chain Analysis 2018-2019 (US$)
Table16 Next Generation Data Center MarketPricing Analysis 2021-2026 (US$)
Table17 Next Generation Data Center MarketOpportunities Analysis 2021-2026 (US$)
Table18 Next Generation Data Center MarketProduct Life Cycle Analysis 2021-2026 (US$)
Table19 Next Generation Data Center MarketSupplier Analysis 2018-2019 (US$)
Table20 Next Generation Data Center MarketDistributor Analysis 2018-2019 (US$)
Table21 Next Generation Data Center Market Trend Analysis 2018-2019 (US$)
Table22 Next Generation Data Center Market Size 2018 (US$)
Table23 Next Generation Data Center Market Forecast Analysis 2021-2026 (US$)
Table24 Next Generation Data Center Market Sales Forecast Analysis 2021-2026 (Units)
Table25 Next Generation Data Center Market, Revenue & Volume,By Component, 2021-2026 ($)
Table26 Next Generation Data Center MarketBy Component, Revenue & Volume,By Hardware, 2021-2026 ($)
Table27 Next Generation Data Center MarketBy Component, Revenue & Volume,By Software, 2021-2026 ($)
Table28 Next Generation Data Center MarketBy Component, Revenue & Volume,By Services, 2021-2026 ($)
Table29 North America Next Generation Data Center Market, Revenue & Volume,By Component, 2021-2026 ($)
Table30 South america Next Generation Data Center Market, Revenue & Volume,By Component, 2021-2026 ($)
Table31 Europe Next Generation Data Center Market, Revenue & Volume,By Component, 2021-2026 ($)
Table32 APAC Next Generation Data Center Market, Revenue & Volume,By Component, 2021-2026 ($)
Table33 Middle East & Africa Next Generation Data Center Market, Revenue & Volume,By Component, 2021-2026 ($)
Table34 Russia Next Generation Data Center Market, Revenue & Volume,By Component, 2021-2026 ($)
Table35 Israel Next Generation Data Center Market, Revenue & Volume,By Component, 2021-2026 ($)
Table36 Top Companies 2018 (US$)Next Generation Data Center Market, Revenue & Volume,,
Table37 Product Launch 2018-2019Next Generation Data Center Market, Revenue & Volume,,
Table38 Mergers & Acquistions 2018-2019Next Generation Data Center Market, Revenue & Volume,,
List of Figures
Figure 1 Overview of Next Generation Data Center Market 2021-2026
Figure 2 Market Share Analysis for Next Generation Data Center Market 2018 (US$)
Figure 3 Product Comparison in Next Generation Data Center Market 2018-2019 (US$)
Figure 4 End User Profile for Next Generation Data Center Market 2018-2019 (US$)
Figure 5 Patent Application and Grant in Next Generation Data Center Market 2013-2018* (US$)
Figure 6 Top 5 Companies Financial Analysis in Next Generation Data Center Market 2018-2019 (US$)
Figure 7 Market Entry Strategy in Next Generation Data Center Market 2018-2019
Figure 8 Ecosystem Analysis in Next Generation Data Center Market2018
Figure 9 Average Selling Price in Next Generation Data Center Market 2021-2026
Figure 10 Top Opportunites in Next Generation Data Center Market 2018-2019
Figure 11 Market Life Cycle Analysis in Next Generation Data Center Market
Figure 12 GlobalBy ComponentNext Generation Data Center Market Revenue, 2021-2026 ($)
Figure 13 Global Next Generation Data Center Market - By Geography
Figure 14 Global Next Generation Data Center Market Value & Volume, By Geography, 2021-2026 ($)
Figure 15 Global Next Generation Data Center Market CAGR, By Geography, 2021-2026 (%)
Figure 16 North America Next Generation Data Center Market Value & Volume, 2021-2026 ($)
Figure 17 US Next Generation Data Center Market Value & Volume, 2021-2026 ($)
Figure 18 US GDP and Population, 2018-2019 ($)
Figure 19 US GDP – Composition of 2018, By Sector of Origin
Figure 20 US Export and Import Value & Volume, 2018-2019 ($)
Figure 21 Canada Next Generation Data Center Market Value & Volume, 2021-2026 ($)
Figure 22 Canada GDP and Population, 2018-2019 ($)
Figure 23 Canada GDP – Composition of 2018, By Sector of Origin
Figure 24 Canada Export and Import Value & Volume, 2018-2019 ($)
Figure 25 Mexico Next Generation Data Center Market Value & Volume, 2021-2026 ($)
Figure 26 Mexico GDP and Population, 2018-2019 ($)
Figure 27 Mexico GDP – Composition of 2018, By Sector of Origin
Figure 28 Mexico Export and Import Value & Volume, 2018-2019 ($)
Figure 29 South America Next Generation Data Center MarketSouth America 3D Printing Market Value & Volume, 2021-2026 ($)
Figure 30 Brazil Next Generation Data Center Market Value & Volume, 2021-2026 ($)
Figure 31 Brazil GDP and Population, 2018-2019 ($)
Figure 32 Brazil GDP – Composition of 2018, By Sector of Origin
Figure 33 Brazil Export and Import Value & Volume, 2018-2019 ($)
Figure 34 Venezuela Next Generation Data Center Market Value & Volume, 2021-2026 ($)
Figure 35 Venezuela GDP and Population, 2018-2019 ($)
Figure 36 Venezuela GDP – Composition of 2018, By Sector of Origin
Figure 37 Venezuela Export and Import Value & Volume, 2018-2019 ($)
Figure 38 Argentina Next Generation Data Center Market Value & Volume, 2021-2026 ($)
Figure 39 Argentina GDP and Population, 2018-2019 ($)
Figure 40 Argentina GDP – Composition of 2018, By Sector of Origin
Figure 41 Argentina Export and Import Value & Volume, 2018-2019 ($)
Figure 42 Ecuador Next Generation Data Center Market Value & Volume, 2021-2026 ($)
Figure 43 Ecuador GDP and Population, 2018-2019 ($)
Figure 44 Ecuador GDP – Composition of 2018, By Sector of Origin
Figure 45 Ecuador Export and Import Value & Volume, 2018-2019 ($)
Figure 46 Peru Next Generation Data Center Market Value & Volume, 2021-2026 ($)
Figure 47 Peru GDP and Population, 2018-2019 ($)
Figure 48 Peru GDP – Composition of 2018, By Sector of Origin
Figure 49 Peru Export and Import Value & Volume, 2018-2019 ($)
Figure 50 Colombia Next Generation Data Center Market Value & Volume, 2021-2026 ($)
Figure 51 Colombia GDP and Population, 2018-2019 ($)
Figure 52 Colombia GDP – Composition of 2018, By Sector of Origin
Figure 53 Colombia Export and Import Value & Volume, 2018-2019 ($)
Figure 54 Costa Rica Next Generation Data Center MarketCosta Rica 3D Printing Market Value & Volume, 2021-2026 ($)
Figure 55 Costa Rica GDP and Population, 2018-2019 ($)
Figure 56 Costa Rica GDP – Composition of 2018, By Sector of Origin
Figure 57 Costa Rica Export and Import Value & Volume, 2018-2019 ($)
Figure 58 Europe Next Generation Data Center Market Value & Volume, 2021-2026 ($)
Figure 59 U.K Next Generation Data Center Market Value & Volume, 2021-2026 ($)
Figure 60 U.K GDP and Population, 2018-2019 ($)
Figure 61 U.K GDP – Composition of 2018, By Sector of Origin
Figure 62 U.K Export and Import Value & Volume, 2018-2019 ($)
Figure 63 Germany Next Generation Data Center Market Value & Volume, 2021-2026 ($)
Figure 64 Germany GDP and Population, 2018-2019 ($)
Figure 65 Germany GDP – Composition of 2018, By Sector of Origin
Figure 66 Germany Export and Import Value & Volume, 2018-2019 ($)
Figure 67 Italy Next Generation Data Center Market Value & Volume, 2021-2026 ($)
Figure 68 Italy GDP and Population, 2018-2019 ($)
Figure 69 Italy GDP – Composition of 2018, By Sector of Origin
Figure 70 Italy Export and Import Value & Volume, 2018-2019 ($)
Figure 71 France Next Generation Data Center Market Value & Volume, 2021-2026 ($)
Figure 72 France GDP and Population, 2018-2019 ($)
Figure 73 France GDP – Composition of 2018, By Sector of Origin
Figure 74 France Export and Import Value & Volume, 2018-2019 ($)
Figure 75 Netherlands Next Generation Data Center Market Value & Volume, 2021-2026 ($)
Figure 76 Netherlands GDP and Population, 2018-2019 ($)
Figure 77 Netherlands GDP – Composition of 2018, By Sector of Origin
Figure 78 Netherlands Export and Import Value & Volume, 2018-2019 ($)
Figure 79 Belgium Next Generation Data Center Market Value & Volume, 2021-2026 ($)
Figure 80 Belgium GDP and Population, 2018-2019 ($)
Figure 81 Belgium GDP – Composition of 2018, By Sector of Origin
Figure 82 Belgium Export and Import Value & Volume, 2018-2019 ($)
Figure 83 Spain Next Generation Data Center Market Value & Volume, 2021-2026 ($)
Figure 84 Spain GDP and Population, 2018-2019 ($)
Figure 85 Spain GDP – Composition of 2018, By Sector of Origin
Figure 86 Spain Export and Import Value & Volume, 2018-2019 ($)
Figure 87 Denmark Next Generation Data Center Market Value & Volume, 2021-2026 ($)
Figure 88 Denmark GDP and Population, 2018-2019 ($)
Figure 89 Denmark GDP – Composition of 2018, By Sector of Origin
Figure 90 Denmark Export and Import Value & Volume, 2018-2019 ($)
Figure 91 APAC Next Generation Data Center Market Value & Volume, 2021-2026 ($)
Figure 92 China Next Generation Data Center MarketValue & Volume, 2021-2026
Figure 93 China GDP and Population, 2018-2019 ($)
Figure 94 China GDP – Composition of 2018, By Sector of Origin
Figure 95 China Export and Import Value & Volume, 2018-2019 ($)Next Generation Data Center MarketChina Export and Import Value & Volume, 2018-2019 ($)
Figure 96 Australia Next Generation Data Center Market Value & Volume, 2021-2026 ($)
Figure 97 Australia GDP and Population, 2018-2019 ($)
Figure 98 Australia GDP – Composition of 2018, By Sector of Origin
Figure 99 Australia Export and Import Value & Volume, 2018-2019 ($)
Figure 100 South Korea Next Generation Data Center Market Value & Volume, 2021-2026 ($)
Figure 101 South Korea GDP and Population, 2018-2019 ($)
Figure 102 South Korea GDP – Composition of 2018, By Sector of Origin
Figure 103 South Korea Export and Import Value & Volume, 2018-2019 ($)
Figure 104 India Next Generation Data Center Market Value & Volume, 2021-2026 ($)
Figure 105 India GDP and Population, 2018-2019 ($)
Figure 106 India GDP – Composition of 2018, By Sector of Origin
Figure 107 India Export and Import Value & Volume, 2018-2019 ($)
Figure 108 Taiwan Next Generation Data Center MarketTaiwan 3D Printing Market Value & Volume, 2021-2026 ($)
Figure 109 Taiwan GDP and Population, 2018-2019 ($)
Figure 110 Taiwan GDP – Composition of 2018, By Sector of Origin
Figure 111 Taiwan Export and Import Value & Volume, 2018-2019 ($)
Figure 112 Malaysia Next Generation Data Center MarketMalaysia 3D Printing Market Value & Volume, 2021-2026 ($)
Figure 113 Malaysia GDP and Population, 2018-2019 ($)
Figure 114 Malaysia GDP – Composition of 2018, By Sector of Origin
Figure 115 Malaysia Export and Import Value & Volume, 2018-2019 ($)
Figure 116 Hong Kong Next Generation Data Center MarketHong Kong 3D Printing Market Value & Volume, 2021-2026 ($)
Figure 117 Hong Kong GDP and Population, 2018-2019 ($)
Figure 118 Hong Kong GDP – Composition of 2018, By Sector of Origin
Figure 119 Hong Kong Export and Import Value & Volume, 2018-2019 ($)
Figure 120 Middle East & Africa Next Generation Data Center MarketMiddle East & Africa 3D Printing Market Value & Volume, 2021-2026 ($)
Figure 121 Russia Next Generation Data Center MarketRussia 3D Printing Market Value & Volume, 2021-2026 ($)
Figure 122 Russia GDP and Population, 2018-2019 ($)
Figure 123 Russia GDP – Composition of 2018, By Sector of Origin
Figure 124 Russia Export and Import Value & Volume, 2018-2019 ($)
Figure 125 Israel Next Generation Data Center Market Value & Volume, 2021-2026 ($)
Figure 126 Israel GDP and Population, 2018-2019 ($)
Figure 127 Israel GDP – Composition of 2018, By Sector of Origin
Figure 128 Israel Export and Import Value & Volume, 2018-2019 ($)
Figure 129 Entropy Share, By Strategies, 2018-2019* (%)Next Generation Data Center Market
Figure 130 Developments, 2018-2019*Next Generation Data Center Market
Figure 131 Company 1 Next Generation Data Center Market Net Revenue, By Years, 2018-2019* ($)
Figure 132 Company 1 Next Generation Data Center Market Net Revenue Share, By Business segments, 2018 (%)
Figure 133 Company 1 Next Generation Data Center Market Net Sales Share, By Geography, 2018 (%)
Figure 134 Company 2 Next Generation Data Center Market Net Revenue, By Years, 2018-2019* ($)
Figure 135 Company 2 Next Generation Data Center Market Net Revenue Share, By Business segments, 2018 (%)
Figure 136 Company 2 Next Generation Data Center Market Net Sales Share, By Geography, 2018 (%)
Figure 137 Company 3Next Generation Data Center Market Net Revenue, By Years, 2018-2019* ($)
Figure 138 Company 3Next Generation Data Center Market Net Revenue Share, By Business segments, 2018 (%)
Figure 139 Company 3Next Generation Data Center Market Net Sales Share, By Geography, 2018 (%)
Figure 140 Company 4 Next Generation Data Center Market Net Revenue, By Years, 2018-2019* ($)
Figure 141 Company 4 Next Generation Data Center Market Net Revenue Share, By Business segments, 2018 (%)
Figure 142 Company 4 Next Generation Data Center Market Net Sales Share, By Geography, 2018 (%)
Figure 143 Company 5 Next Generation Data Center Market Net Revenue, By Years, 2018-2019* ($)
Figure 144 Company 5 Next Generation Data Center Market Net Revenue Share, By Business segments, 2018 (%)
Figure 145 Company 5 Next Generation Data Center Market Net Sales Share, By Geography, 2018 (%)
Figure 146 Company 6 Next Generation Data Center Market Net Revenue, By Years, 2018-2019* ($)
Figure 147 Company 6 Next Generation Data Center Market Net Revenue Share, By Business segments, 2018 (%)
Figure 148 Company 6 Next Generation Data Center Market Net Sales Share, By Geography, 2018 (%)
Figure 149 Company 7 Next Generation Data Center Market Net Revenue, By Years, 2018-2019* ($)
Figure 150 Company 7 Next Generation Data Center Market Net Revenue Share, By Business segments, 2018 (%)
Figure 151 Company 7 Next Generation Data Center Market Net Sales Share, By Geography, 2018 (%)
Figure 152 Company 8 Next Generation Data Center Market Net Revenue, By Years, 2018-2019* ($)
Figure 153 Company 8 Next Generation Data Center Market Net Revenue Share, By Business segments, 2018 (%)
Figure 154 Company 8 Next Generation Data Center Market Net Sales Share, By Geography, 2018 (%)
Figure 155 Company 9 Next Generation Data Center Market Net Revenue, By Years, 2018-2019* ($)
Figure 156 Company 9 Next Generation Data Center Market Net Revenue Share, By Business segments, 2018 (%)
Figure 157 Company 9 Next Generation Data Center Market Net Sales Share, By Geography, 2018 (%)
Figure 158 Company 10 Next Generation Data Center Market Net Revenue, By Years, 2018-2019* ($)
Figure 159 Company 10 Next Generation Data Center Market Net Revenue Share, By Business segments, 2018 (%)
Figure 160 Company 10 Next Generation Data Center Market Net Sales Share, By Geography, 2018 (%)
Figure 161 Company 11 Next Generation Data Center Market Net Revenue, By Years, 2018-2019* ($)
Figure 162 Company 11 Next Generation Data Center Market Net Revenue Share, By Business segments, 2018 (%)
Figure 163 Company 11 Next Generation Data Center Market Net Sales Share, By Geography, 2018 (%)
Figure 164 Company 12 Next Generation Data Center Market Net Revenue, By Years, 2018-2019* ($)
Figure 165 Company 12 Next Generation Data Center Market Net Revenue Share, By Business segments, 2018 (%)
Figure 166 Company 12 Next Generation Data Center Market Net Sales Share, By Geography, 2018 (%)
Figure 167 Company 13Next Generation Data Center Market Net Revenue, By Years, 2018-2019* ($)
Figure 168 Company 13Next Generation Data Center Market Net Revenue Share, By Business segments, 2018 (%)
Figure 169 Company 13Next Generation Data Center Market Net Sales Share, By Geography, 2018 (%)
Figure 170 Company 14 Next Generation Data Center Market Net Revenue, By Years, 2018-2019* ($)
Figure 171 Company 14 Next Generation Data Center Market Net Revenue Share, By Business segments, 2018 (%)
Figure 172 Company 14 Next Generation Data Center Market Net Sales Share, By Geography, 2018 (%)
Figure 173 Company 15 Next Generation Data Center Market Net Revenue, By Years, 2018-2019* ($)
Figure 174 Company 15 Next Generation Data Center Market Net Revenue Share, By Business segments, 2018 (%)
Figure 175 Company 15 Next Generation Data Center Market Net Sales Share, By Geography, 2018 (%)