 Email
Email Print
Print


Artificial Tears Market Analysis - Forecast(2024 - 2030)
Artificial Tears Market Overview
Artificial tears are lubricating eye drops and gels that are used to add moisture to the eye. These are also called ocular lubricants and are basically formulated to relieve burning, irritation and discomfort caused by dry eyes. Dry eyes can be caused by prolonged use of computers, dry and smoky weather, tiredness, and some other factors.
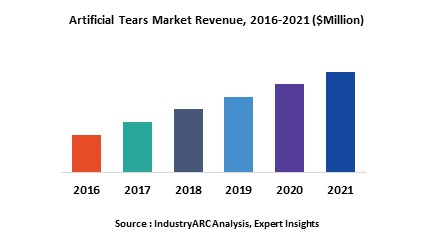
Artificial Tears are segmented into different types such as cellulose-derived tears, glycerin-derived tears, polyethylene glycol and propylene glycol based tears, oil-based emulsion tears, and others. The increasing incidences of dry eyes syndrome are boosting the demand for artificial tears across the globe. In this report, the Artificial Tears market is segmented by type, by end user age groups, and by geography. The Artificial Tears Market generated revenue of $2142.1m in 2017 and estimated to exceed $2639.6m by 2023, growing at an estimated CAGR of 3.6%.
Artificial Tears Market Outlook
The global market for artificial tears has been witnessing a brisk growth in the recent years owing to increasing incidences of dry eye syndrome and other eye-related problems. There is a dramatic rise in dry eye complaints among people in their teens and 20s in the past five years due to prolonged exposure to blue light emitted from digital screens, increased use of mobile phones, increased pollution levels, and dry weather spells. The 60 years end-user age group accounted for 45% of the total market share in 2017, followed by the 40–60 years age group with 35%.
The artificial tears market with respect to the 40–60 years age group was valued at $753.0m in 2017 and is estimated to reach $952.9m by 2023, growing at a CAGR of 4.06% during the forecast period. It is estimated that nearly five million Americans above the age of 50 years are afflicted with dry eyes, which is more common in women than men.
Artificial Tears Market Growth Drivers
One of the major drivers of the artificial tears market is the growing prevalence of dry eye syndrome (DES) owing to several factors such as prolonged exposure to digital displays, rising pollution levels, protein and vitamin deficiencies, and climatic changes. The growing geriatric population and rising number of eye surgeries that demands the use of artificial tears for post-surgery management are also boosting the market growth.
Development of several preservative-free artificial tear brands such as Systane Ultra (Alcon), Blink Tears Preservative Free Drops (Johnson & Johnson Vision Care, Inc.) and REFRESH OPTIVE Preservative-Free (Allergan, Inc.), and their benefits on ocular health have also increased the adoption of lubricant eye drops. The Asia-Pacific artificial tears market is forecast to grow at the highest CAGR OF 5.68% during the forecast period 2018–2023.
Artificial Tears Market Challenges
The use of artificial tears is associated with several side effects such as blurred vision, long-term irritation, and so on, which is a major challenge for the artificial tears market. There are some preservatives that are present in artificial tears, which has several adverse effects on eye health. The development of various medications that are capable of reducing irritation caused by dry eye syndrome is also limiting the growth of the artificial tears market.
Artificial Tears Market Research Scope
The base year of the study is 2017, with forecast done up to 2023. The study presents a thorough analysis of the competitive landscape, taking into account the market shares of the leading companies. It also provides information on unit shipments. These provide the key market participants with the necessary business intelligence and help them understand the future of the Artificial Tears Market. The assessment includes the forecast, an overview of the competitive structure, the market shares of the competitors, as well as the market trends, market demands, market drivers, market challenges, and product analysis. The market drivers and restraints have been assessed to fathom their impact over the forecast period. This report further identifies the key opportunities for growth while also detailing the key challenges and possible threats. The key areas of focus include the types of artificial tears, end their uses by different age groups.
Artificial Tears Market Report: Industry Coverage
Artificial Tears Market – By Type: Cellulose-Derived Tears, Glycerin-Derived Tears, Polyethylene Glycol and Propylene Glycol Based Tears, Oil-Based Emulsion Tears, and Others
Artificial Tears Market – By End-User Age Group: 20–40 Years, 40–60 Years, Above 60 Years
The Artificial Tears Market report also analyzes the major geographic regions for the market as well as the major countries for the market in these regions. The regions and countries covered in the study include:
- North America: The U.S., Canada, Mexico
- South America: Brazil, Venezuela, Argentina, Ecuador, Peru, Colombia, Costa Rica, and Rest of South America
- Europe: The U.K., Germany, Italy, France, Netherlands, Belgium, Spain, Denmark, and Rest of Europe
- Asia-Pacific: China, Australia, Japan, South Korea, India, Taiwan, Malaysia, and Rest of Asia-Pacific
- Rest of the World (RoW): Middle East and Africa
Artificial Tears Market Key Players
Some of the key players mentioned in this market research report include Bausch + Lomb (the U.S.), Johnson & Johnson (the U.S.) Novartis International AG (Switzerland), AFT Pharmaceuticals (New Zealand), Allergan plc (Republic of Ireland), Akorn Inc. (the U.S.), Santen Pharmaceutical Co., Ltd. (Japan), Rohto Pharmaceutical Co., Ltd. (Japan), VISUfarma (Netherlands), Otsuka Pharmaceutical Co., Ltd. (Japan), NovaMedica LLC (Russia), ENTOD Research Cell UK Ltd (the U.K.), OASIS Medical, Inc. (the U.S.), and Abbott Medical Optics Inc. (the U.S.).
Artificial Tears Market Trends
- Rising incidences of Dry Eye Syndrome (DES) across the globe due to prolonged exposure to digital displays, rising pollution levels, protein and vitamin deficiencies, and climatic changes are driving the market for artificial tears.
- According to the National Health and Wellness Survey, approximately 5% to 30% of the people above 50 years in the U.S. are afflicted with dry eyes syndrome.
1. Artificial Tears Market – Market Overview
1.1. Definitions and Scope
2. Artificial Tears Market – Executive Summary
2.1. Market Revenue, Market Size and Key Trends by Company
2.2. Key Trends by type of Application
2.3. Key Trends segmented by Geography
3. Artificial Tears Market – Comparative Analysis
3.1. Comparative analysis
3.1.1. Product Benchmarking – Key companies
3.1.2. Top 5 Financials Analysis
3.1.3. Market Value split by Top 10 companies
3.1.4. Patent Analysis – Key companies
3.1.5. Pricing Analysis
4. Artificial Tears Market – Startup Companies Scenario
4.1. Top 10 startup company Analysis by
4.1.1. Investment
4.1.2. Revenue
4.1.3. Venture Capital and Funding Scenario
5. Artificial Tears Market – Industry Market Entry Scenario Premium
5.1. Regulatory Framework Overview
5.2. New Business and Ease of Doing business index
5.3. Case studies of successful ventures
5.4. Customer Analysis – Key companies
6. Artificial Tears Market Forces
6.1. Drivers
6.2. Constraints & Challenges
6.3. Porters five force model
6.3.1. Bargaining power of suppliers
6.3.2. Bargaining powers of customers
6.3.3. Threat of new entrants
6.3.4. Rivalry among existing players
6.3.5. Threat of substitutes
7. Artificial Tears Market -Strategic Analysis
7.1. Value chain analysis
7.2. Opportunities analysis
7.3. Product life cycle
8. Artificial Tears Market – By Type (Market Size – $Million/$Billion)
8.1. Market Size and Market Share Analysis
8.2. Product Segment Analysis
8.2.1. Cellulose-Derived Tears
8.2.2. Glycerin-Derived Tears
8.2.3. Polyethylene Glycol and Propylene Glycol Based Tears
8.2.4. Oil-Based Emulsion Tears
8.2.5. Others
9. Artificial Tears Market – By End-user Age Group (Market Size – $Million/$Billion)
9.1. Market Size and Market Share Analysis
9.2. Product Segment Analysis
9.2.1. 20-40 Years
9.2.2. 40-60 Years
9.2.3. Above 60 Years
10. Artificial Tears Market – By Geography (Market Size – $Million/$Billion)
10.1. Artificial Tears Market - North America Segment Research
10.2. North America Market Research ($Million/$Billion)
10.2.1. Segment type Size and Market Size Analysis
10.2.2. Revenue and Trends
10.2.3. North America Product Type and End User Market Size
10.2.3.1. U.S.
10.2.3.2. Canada
10.2.3.3. Mexico
10.3. Artificial Tears Market – South America Segment Research
10.4. South America Market Research (Market Size – $Million/$Billion)
10.4.1. Segment type Size and Market Size Analysis
10.4.2. Revenue and Trends
10.4.3. South America Product Type and End User Market Size
10.4.3.1. Brazil
10.4.3.2. Venezuela
10.4.3.3. Argentina
10.4.3.4. Ecuador
10.4.3.5. Peru
10.4.3.6. Colombia
10.4.3.7. Costa Rica
10.4.3.8. Rest of South America
10.5. Artificial Tears Market – Europe Segment Research
10.6. Europe Market Research (Market Size – $Million/$Billion)
10.6.1. Segment type Size and Market Size Analysis
10.6.2. Revenue and Trends
10.6.3. Europe Segment Product Type and End User Market Size
10.6.3.1. U.K.
10.6.3.2. Germany
10.6.3.3. Italy
10.6.3.4. France
10.6.3.5. Netherlands
10.6.3.6. Belgium
10.6.3.7. Spain
10.6.3.8. Denmark
10.6.3.9. Rest of Europe
10.7. Artificial Tears Market – APAC Segment Research
10.8. APAC Market Research (Market Size – $Million/$Billion)
10.8.1. Segment type Size and Market Size Analysis
10.8.2. Revenue and Trends
10.8.3. APAC Segment Product Type and End User Market Size
10.8.3.1. China
10.8.3.2. Australia
10.8.3.3. Japan
10.8.3.4. South Korea
10.8.3.5. India
10.8.3.6. Taiwan
10.8.3.7. Malaysia
10.8.3.8. Rest of APAC
10.9. Artificial Tears Market – RoW Segment Research
10.10. RoW Market Research (Market Size – $Million/$Billion)
10.10.1. Segment type Size and Market Size Analysis
10.10.2. Revenue and Trends
10.10.3. Row Segment Product Type and End User Market Size
10.10.3.1. Middle East
10.10.3.2. Africa
11. Artificial Tears Market – Market Entropy
11.1. New product launches
11.2. M&As, Collaborations, JVs, and Partnerships
12. Artificial Tears Market – Industry/Segment Competition Landscape
12.1. Market Share Analysis
12.1.1. Market Share by Country – Top companies
12.1.2. Market Share by Region – Top 10 companies
12.1.3. Best Practices for companies
13. Artificial Tears Market – Key Company List by Country Premium
14. Artificial Tears Market Company Analysis
14.1. Bausch + Lomb
14.2. Johnson & Johnson
14.3. Dole Food Company, Inc.
14.4. Lamb Weston Holdings, Inc.
14.5. Nash Produce, LLC
14.6. Yantai China Pet Foods Co., Ltd.
14.7. The Kraft Heinz Company
14.8. Wayne E. Bailey Produce Company, Inc.
14.9. A.V. Thomas Produce, Inc.
14.10. Ham Farms
15. Artificial Tears Market – Appendix
15.1. Abbreviations
15.2. Sources
16. Artificial Tears Market – Research Methodology
16.1. Research Methodology
16.1.1. Company Expert Interviews
16.1.2. Industry Databases
16.1.3. Associations
16.1.4. Company News
16.1.5. Company Annual Reports
16.1.6. Application Trends
16.1.7. New Products and Product database
16.1.8. Company Transcripts
16.1.9. R&D Trends
16.1.10. Key Opinion Leaders Interviews
16.1.11. Supply and Demand Trends
List of Tables
Table1: Artificial Tears Market Analysis Overview 2021-2026
Table2: Artificial Tears Market Analysis Leader Analysis 2018-2019 (US$)
Table3: Artificial Tears Market AnalysisProduct Analysis 2018-2019 (US$)
Table4: Artificial Tears Market AnalysisEnd User Analysis 2018-2019 (US$)
Table5: Artificial Tears Market AnalysisPatent Analysis 2013-2018* (US$)
Table6: Artificial Tears Market AnalysisFinancial Analysis 2018-2019 (US$)
Table7: Artificial Tears Market Analysis Driver Analysis 2018-2019 (US$)
Table8: Artificial Tears Market AnalysisChallenges Analysis 2018-2019 (US$)
Table9: Artificial Tears Market AnalysisConstraint Analysis 2018-2019 (US$)
Table10: Artificial Tears Market Analysis Supplier Bargaining Power Analysis 2018-2019 (US$)
Table11: Artificial Tears Market Analysis Buyer Bargaining Power Analysis 2018-2019 (US$)
Table12: Artificial Tears Market Analysis Threat of Substitutes Analysis 2018-2019 (US$)
Table13: Artificial Tears Market Analysis Threat of New Entrants Analysis 2018-2019 (US$)
Table14: Artificial Tears Market Analysis Degree of Competition Analysis 2018-2019 (US$)
Table15: Artificial Tears Market AnalysisValue Chain Analysis 2018-2019 (US$)
Table16: Artificial Tears Market AnalysisPricing Analysis 2021-2026 (US$)
Table17: Artificial Tears Market AnalysisOpportunities Analysis 2021-2026 (US$)
Table18: Artificial Tears Market AnalysisProduct Life Cycle Analysis 2021-2026 (US$)
Table19: Artificial Tears Market AnalysisSupplier Analysis 2018-2019 (US$)
Table20: Artificial Tears Market AnalysisDistributor Analysis 2018-2019 (US$)
Table21: Artificial Tears Market Analysis Trend Analysis 2018-2019 (US$)
Table22: Artificial Tears Market Analysis Size 2018 (US$)
Table23: Artificial Tears Market Analysis Forecast Analysis 2021-2026 (US$)
Table24: Artificial Tears Market Analysis Sales Forecast Analysis 2021-2026 (Units)
Table25: Artificial Tears Market Analysis, Revenue & Volume, By Type, 2021-2026 ($)
Table26: Artificial Tears Market AnalysisBy Type, Revenue & Volume, Cellulose-derived tears, 2021-2026 ($)
Table27: Artificial Tears Market AnalysisBy Type, Revenue & Volume, Glycerin-derived tears, 2021-2026 ($)
Table28: Artificial Tears Market AnalysisBy Type, Revenue & Volume, Polyethylene glycol and propylene glycol based tears, 2021-2026 ($)
Table29: Artificial Tears Market AnalysisBy Type, Revenue & Volume, Oil-based emulsion tears , 2021-2026 ($)
Table30: Artificial Tears Market AnalysisBy Type, Revenue & Volume, By Type 5, 2021-2026 ($)
Table31: Artificial Tears Market Analysis, Revenue & Volume, By End-user Age Group, 2021-2026 ($)
Table32: Artificial Tears Market AnalysisBy End-user Age Group, Revenue & Volume, 20-40 years, 2021-2026 ($)
Table33: Artificial Tears Market AnalysisBy End-user Age Group, Revenue & Volume, 40-60 years, 2021-2026 ($)
Table34: Artificial Tears Market AnalysisBy End-user Age Group, Revenue & Volume, Above 60 years, 2021-2026 ($)
Table35: North America Artificial Tears Market Analysis, Revenue & Volume, By Type, 2021-2026 ($)
Table36: North America Artificial Tears Market Analysis, Revenue & Volume, By End-user Age Group, 2021-2026 ($)
Table37: South america Artificial Tears Market Analysis, Revenue & Volume, By Type, 2021-2026 ($)
Table38: South america Artificial Tears Market Analysis, Revenue & Volume, By End-user Age Group, 2021-2026 ($)
Table39: Europe Artificial Tears Market Analysis, Revenue & Volume, By Type, 2021-2026 ($)
Table40: Europe Artificial Tears Market Analysis, Revenue & Volume, By End-user Age Group, 2021-2026 ($)
Table41: APAC Artificial Tears Market Analysis, Revenue & Volume, By Type, 2021-2026 ($)
Table42: APAC Artificial Tears Market Analysis, Revenue & Volume, By End-user Age Group, 2021-2026 ($)
Table43: Middle East & Africa Artificial Tears Market Analysis, Revenue & Volume, By Type, 2021-2026 ($)
Table44: Middle East & Africa Artificial Tears Market Analysis, Revenue & Volume, By End-user Age Group, 2021-2026 ($)
Table45: Russia Artificial Tears Market Analysis, Revenue & Volume, By Type, 2021-2026 ($)
Table46: Russia Artificial Tears Market Analysis, Revenue & Volume, By End-user Age Group, 2021-2026 ($)
Table47: Israel Artificial Tears Market Analysis, Revenue & Volume, By Type, 2021-2026 ($)
Table48: Israel Artificial Tears Market Analysis, Revenue & Volume, By End-user Age Group, 2021-2026 ($)
Table49: Top Companies 2018 (US$)Artificial Tears Market Analysis, Revenue & Volume
Table50: Product Launch 2018-2019Artificial Tears Market Analysis, Revenue & Volume
Table51: Mergers & Acquistions 2018-2019Artificial Tears Market Analysis, Revenue & Volume
List of Figures
Figure 1: Overview of Artificial Tears Market Analysis 2021-2026
Figure 2: Market Share Analysis for Artificial Tears Market Analysis 2018 (US$)
Figure 3: Product Comparison in Artificial Tears Market Analysis 2018-2019 (US$)
Figure 4: End User Profile for Artificial Tears Market Analysis 2018-2019 (US$)
Figure 5: Patent Application and Grant in Artificial Tears Market Analysis 2013-2018* (US$)
Figure 6: Top 5 Companies Financial Analysis in Artificial Tears Market Analysis 2018-2019 (US$)
Figure 7: Market Entry Strategy in Artificial Tears Market Analysis 2018-2019
Figure 8: Ecosystem Analysis in Artificial Tears Market Analysis2018
Figure 9: Average Selling Price in Artificial Tears Market Analysis 2021-2026
Figure 10: Top Opportunites in Artificial Tears Market Analysis 2018-2019
Figure 11: Market Life Cycle Analysis in Artificial Tears Market Analysis
Figure 12: GlobalBy TypeArtificial Tears Market Analysis Revenue, 2021-2026 ($)
Figure 13: GlobalBy End-user Age GroupArtificial Tears Market Analysis Revenue, 2021-2026 ($)
Figure 14: Global Artificial Tears Market Analysis - By Geography
Figure 15: Global Artificial Tears Market Analysis Value & Volume, By Geography, 2021-2026 ($)
Figure 16: Global Artificial Tears Market Analysis CAGR, By Geography, 2021-2026 (%)
Figure 17: North America Artificial Tears Market Analysis Value & Volume, 2021-2026 ($)
Figure 18: US Artificial Tears Market Analysis Value & Volume, 2021-2026 ($)
Figure 19: US GDP and Population, 2018-2019 ($)
Figure 20: US GDP – Composition of 2018, By Sector of Origin
Figure 21: US Export and Import Value & Volume, 2018-2019 ($)
Figure 22: Canada Artificial Tears Market Analysis Value & Volume, 2021-2026 ($)
Figure 23: Canada GDP and Population, 2018-2019 ($)
Figure 24: Canada GDP – Composition of 2018, By Sector of Origin
Figure 25: Canada Export and Import Value & Volume, 2018-2019 ($)
Figure 26: Mexico Artificial Tears Market Analysis Value & Volume, 2021-2026 ($)
Figure 27: Mexico GDP and Population, 2018-2019 ($)
Figure 28: Mexico GDP – Composition of 2018, By Sector of Origin
Figure 29: Mexico Export and Import Value & Volume, 2018-2019 ($)
Figure 30: South America Artificial Tears Market AnalysisValue & Volume, 2021-2026 ($)
Figure 31: Brazil Artificial Tears Market Analysis Value & Volume, 2021-2026 ($)
Figure 32: Brazil GDP and Population, 2018-2019 ($)
Figure 33: Brazil GDP – Composition of 2018, By Sector of Origin
Figure 34: Brazil Export and Import Value & Volume, 2018-2019 ($)
Figure 35: Venezuela Artificial Tears Market Analysis Value & Volume, 2021-2026 ($)
Figure 36: Venezuela GDP and Population, 2018-2019 ($)
Figure 37: Venezuela GDP – Composition of 2018, By Sector of Origin
Figure 38: Venezuela Export and Import Value & Volume, 2018-2019 ($)
Figure 39: Argentina Artificial Tears Market Analysis Value & Volume, 2021-2026 ($)
Figure 40: Argentina GDP and Population, 2018-2019 ($)
Figure 41: Argentina GDP – Composition of 2018, By Sector of Origin
Figure 42: Argentina Export and Import Value & Volume, 2018-2019 ($)
Figure 43: Ecuador Artificial Tears Market Analysis Value & Volume, 2021-2026 ($)
Figure 44: Ecuador GDP and Population, 2018-2019 ($)
Figure 45: Ecuador GDP – Composition of 2018, By Sector of Origin
Figure 46: Ecuador Export and Import Value & Volume, 2018-2019 ($)
Figure 47: Peru Artificial Tears Market Analysis Value & Volume, 2021-2026 ($)
Figure 48: Peru GDP and Population, 2018-2019 ($)
Figure 49: Peru GDP – Composition of 2018, By Sector of Origin
Figure 50: Peru Export and Import Value & Volume, 2018-2019 ($)
Figure 51: Colombia Artificial Tears Market Analysis Value & Volume, 2021-2026 ($)
Figure 52: Colombia GDP and Population, 2018-2019 ($)
Figure 53: Colombia GDP – Composition of 2018, By Sector of Origin
Figure 54: Colombia Export and Import Value & Volume, 2018-2019 ($)
Figure 55: Costa Rica Artificial Tears Market Analysis Value & Volume, 2021-2026 ($)
Figure 56: Costa Rica GDP and Population, 2018-2019 ($)
Figure 57: Costa Rica GDP – Composition of 2018, By Sector of Origin
Figure 58: Costa Rica Export and Import Value & Volume, 2018-2019 ($)
Figure 59: Europe Artificial Tears Market Analysis Value & Volume, 2021-2026 ($)
Figure 60: U.K Artificial Tears Market Analysis Value & Volume, 2021-2026 ($)
Figure 61: U.K GDP and Population, 2018-2019 ($)
Figure 62: U.K GDP – Composition of 2018, By Sector of Origin
Figure 63: U.K Export and Import Value & Volume, 2018-2019 ($)
Figure 64: Germany Artificial Tears Market Analysis Value & Volume, 2021-2026 ($)
Figure 65: Germany GDP and Population, 2018-2019 ($)
Figure 66: Germany GDP – Composition of 2018, By Sector of Origin
Figure 67: Germany Export and Import Value & Volume, 2018-2019 ($)
Figure 68: Italy Artificial Tears Market Analysis Value & Volume, 2021-2026 ($)
Figure 69: Italy GDP and Population, 2018-2019 ($)
Figure 70: Italy GDP – Composition of 2018, By Sector of Origin
Figure 71: Italy Export and Import Value & Volume, 2018-2019 ($)
Figure 72: France Artificial Tears Market Analysis Value & Volume, 2021-2026 ($)
Figure 73: France GDP and Population, 2018-2019 ($)
Figure 74: France GDP – Composition of 2018, By Sector of Origin
Figure 75: France Export and Import Value & Volume, 2018-2019 ($)
Figure 76: Netherlands Artificial Tears Market Analysis Value & Volume, 2021-2026 ($)
Figure 77: Netherlands GDP and Population, 2018-2019 ($)
Figure 78: Netherlands GDP – Composition of 2018, By Sector of Origin
Figure 79: Netherlands Export and Import Value & Volume, 2018-2019 ($)
Figure 80: Belgium Artificial Tears Market Analysis Value & Volume, 2021-2026 ($)
Figure 81: Belgium GDP and Population, 2018-2019 ($)
Figure 82: Belgium GDP – Composition of 2018, By Sector of Origin
Figure 83: Belgium Export and Import Value & Volume, 2018-2019 ($)
Figure 84: Spain Artificial Tears Market Analysis Value & Volume, 2021-2026 ($)
Figure 85: Spain GDP and Population, 2018-2019 ($)
Figure 86: Spain GDP – Composition of 2018, By Sector of Origin
Figure 87: Spain Export and Import Value & Volume, 2018-2019 ($)
Figure 88: Denmark Artificial Tears Market Analysis Value & Volume, 2021-2026 ($)
Figure 89: Denmark GDP and Population, 2018-2019 ($)
Figure 90: Denmark GDP – Composition of 2018, By Sector of Origin
Figure 91: Denmark Export and Import Value & Volume, 2018-2019 ($)
Figure 92: APAC Artificial Tears Market Analysis Value & Volume, 2021-2026 ($)
Figure 93: China Artificial Tears Market AnalysisValue & Volume, 2021-2026
Figure 94: China GDP and Population, 2018-2019 ($)
Figure 95: China GDP – Composition of 2018, By Sector of Origin
Figure 96: China Export and Import Value & Volume, 2018-2019 ($)Artificial Tears Market AnalysisChina Export and Import Value & Volume, 2018-2019 ($)
Figure 97: Australia Artificial Tears Market Analysis Value & Volume, 2021-2026 ($)
Figure 98: Australia GDP and Population, 2018-2019 ($)
Figure 99: Australia GDP – Composition of 2018, By Sector of Origin
Figure 100: Australia Export and Import Value & Volume, 2018-2019 ($)
Figure 101: South Korea Artificial Tears Market Analysis Value & Volume, 2021-2026 ($)
Figure 102: South Korea GDP and Population, 2018-2019 ($)
Figure 103: South Korea GDP – Composition of 2018, By Sector of Origin
Figure 104: South Korea Export and Import Value & Volume, 2018-2019 ($)
Figure 105: India Artificial Tears Market Analysis Value & Volume, 2021-2026 ($)
Figure 106: India GDP and Population, 2018-2019 ($)
Figure 107: India GDP – Composition of 2018, By Sector of Origin
Figure 108: India Export and Import Value & Volume, 2018-2019 ($)
Figure 109: Taiwan Artificial Tears Market Analysis Value & Volume, 2021-2026 ($)
Figure 110: Taiwan GDP and Population, 2018-2019 ($)
Figure 111: Taiwan GDP – Composition of 2018, By Sector of Origin
Figure 112: Taiwan Export and Import Value & Volume, 2018-2019 ($)
Figure 113: Malaysia Artificial Tears Market Analysis Value & Volume, 2021-2026 ($)
Figure 114: Malaysia GDP and Population, 2018-2019 ($)
Figure 115: Malaysia GDP – Composition of 2018, By Sector of Origin
Figure 116: Malaysia Export and Import Value & Volume, 2018-2019 ($)
Figure 117: Hong Kong Artificial Tears Market Analysis Value & Volume, 2021-2026 ($)
Figure 118: Hong Kong GDP and Population, 2018-2019 ($)
Figure 119: Hong Kong GDP – Composition of 2018, By Sector of Origin
Figure 120: Hong Kong Export and Import Value & Volume, 2018-2019 ($)
Figure 121: Middle East & Africa Artificial Tears Market AnalysisMiddle East & Africa 3D Printing Market Value & Volume, 2021-2026 ($)
Figure 122: Russia Artificial Tears Market Analysis Value & Volume, 2021-2026 ($)
Figure 123: Russia GDP and Population, 2018-2019 ($)
Figure 124: Russia GDP – Composition of 2018, By Sector of Origin
Figure 125: Russia Export and Import Value & Volume, 2018-2019 ($)
Figure 126: Israel Artificial Tears Market Analysis Value & Volume, 2021-2026 ($)
Figure 127: Israel GDP and Population, 2018-2019 ($)
Figure 128: Israel GDP – Composition of 2018, By Sector of Origin
Figure 129: Israel Export and Import Value & Volume, 2018-2019 ($)
Figure 130: Entropy Share, By Strategies, 2018-2019* (%)Artificial Tears Market Analysis
Figure 131: Developments, 2018-2019*Artificial Tears Market Analysis
Figure 132: Company 1 Artificial Tears Market Analysis Net Revenue, By Years, 2018-2019* ($)
Figure 133: Company 1 Artificial Tears Market Analysis Net Revenue Share, By Business segments, 2018 (%)
Figure 134: Company 1 Artificial Tears Market Analysis Net Sales Share, By Geography, 2018 (%)
Figure 135: Company 2 Artificial Tears Market Analysis Net Revenue, By Years, 2018-2019* ($)
Figure 136: Company 2 Artificial Tears Market Analysis Net Revenue Share, By Business segments, 2018 (%)
Figure 137: Company 2 Artificial Tears Market Analysis Net Sales Share, By Geography, 2018 (%)
Figure 138: Company 3 Artificial Tears Market Analysis Net Revenue, By Years, 2018-2019* ($)
Figure 139: Company 3 Artificial Tears Market Analysis Net Revenue Share, By Business segments, 2018 (%)
Figure 140: Company 3 Artificial Tears Market Analysis Net Sales Share, By Geography, 2018 (%)
Figure 141: Company 4 Artificial Tears Market Analysis Net Revenue, By Years, 2018-2019* ($)
Figure 142: Company 4 Artificial Tears Market Analysis Net Revenue Share, By Business segments, 2018 (%)
Figure 143: Company 4 Artificial Tears Market Analysis Net Sales Share, By Geography, 2018 (%)
Figure 144: Company 5 Artificial Tears Market Analysis Net Revenue, By Years, 2018-2019* ($)
Figure 145: Company 5 Artificial Tears Market Analysis Net Revenue Share, By Business segments, 2018 (%)
Figure 146: Company 5 Artificial Tears Market Analysis Net Sales Share, By Geography, 2018 (%)
Figure 147: Company 6 Artificial Tears Market Analysis Net Revenue, By Years, 2018-2019* ($)
Figure 148: Company 6 Artificial Tears Market Analysis Net Revenue Share, By Business segments, 2018 (%)
Figure 149: Company 6 Artificial Tears Market Analysis Net Sales Share, By Geography, 2018 (%)
Figure 150: Company 7 Artificial Tears Market Analysis Net Revenue, By Years, 2018-2019* ($)
Figure 151: Company 7 Artificial Tears Market Analysis Net Revenue Share, By Business segments, 2018 (%)
Figure 152: Company 7 Artificial Tears Market Analysis Net Sales Share, By Geography, 2018 (%)
Figure 153: Company 8 Artificial Tears Market Analysis Net Revenue, By Years, 2018-2019* ($)
Figure 154: Company 8 Artificial Tears Market Analysis Net Revenue Share, By Business segments, 2018 (%)
Figure 155: Company 8 Artificial Tears Market Analysis Net Sales Share, By Geography, 2018 (%)
Figure 156: Company 9 Artificial Tears Market Analysis Net Revenue, By Years, 2018-2019* ($)
Figure 157: Company 9 Artificial Tears Market Analysis Net Revenue Share, By Business segments, 2018 (%)
Figure 158: Company 9 Artificial Tears Market Analysis Net Sales Share, By Geography, 2018 (%)
Figure 159: Company 10 Artificial Tears Market Analysis Net Revenue, By Years, 2018-2019* ($)
Figure 160: Company 10 Artificial Tears Market Analysis Net Revenue Share, By Business segments, 2018 (%)
Figure 161: Company 10 Artificial Tears Market Analysis Net Sales Share, By Geography, 2018 (%)
Figure 162: Company 11 Artificial Tears Market Analysis Net Revenue, By Years, 2018-2019* ($)
Figure 163: Company 11 Artificial Tears Market Analysis Net Revenue Share, By Business segments, 2018 (%)
Figure 164: Company 11 Artificial Tears Market Analysis Net Sales Share, By Geography, 2018 (%)
Figure 165: Company 12 Artificial Tears Market Analysis Net Revenue, By Years, 2018-2019* ($)
Figure 166: Company 12 Artificial Tears Market Analysis Net Revenue Share, By Business segments, 2018 (%)
Figure 167: Company 12 Artificial Tears Market Analysis Net Sales Share, By Geography, 2018 (%)
Figure 168: Company 13 Artificial Tears Market Analysis Net Revenue, By Years, 2018-2019* ($)
Figure 169: Company 13 Artificial Tears Market Analysis Net Revenue Share, By Business segments, 2018 (%)
Figure 170: Company 13 Artificial Tears Market Analysis Net Sales Share, By Geography, 2018 (%)
Figure 171: Company 14 Artificial Tears Market Analysis Net Revenue, By Years, 2018-2019* ($)
Figure 172: Company 14 Artificial Tears Market Analysis Net Revenue Share, By Business segments, 2018 (%)
Figure 173: Company 14 Artificial Tears Market Analysis Net Sales Share, By Geography, 2018 (%)
Figure 174: Company 15 Artificial Tears Market Analysis Net Revenue, By Years, 2018-2019* ($)
Figure 175: Company 15 Artificial Tears Market Analysis Net Revenue Share, By Business segments, 2018 (%)
Figure 176: Company 15 Artificial Tears Market Analysis Net Sales Share, By Geography, 2018 (%)