 Email
Email Print
Print


Care Management Solutions Market - Forecast(2024 - 2030)
Care management solutions are the first data collection point to assess patient’s health and their healthcare needs. Care management solutions then provides customised healthcare plans to the patients to and helps in bringing various coordinators on the same page in order to seamlessly and effectively execute the related tasks and helps in increasing coordination amongst various departments. Some advanced care management solutions are also integrated with transplant networks or other healthcare establishments and creates a 360 degree platform where the healthcare providers, the patient, and their family can track and monitor the status of healthcare programs, care management solutions have redefined patient-centric care in more ways than one. Demand for care management solutions is expected to be boosted by various factors such as increasing medical tourism and it also helps in reducing the healthcare costs.
This report identifies the care management solutions market size in for the year 2014-2016, and forecast of the same for year 2021. It also highlights the potential growth opportunities in the coming years, while also reviewing the market drivers, restraints, growth indicators, challenges, market dynamics, competitive landscape, and other key aspects with respect to care management solutions market.
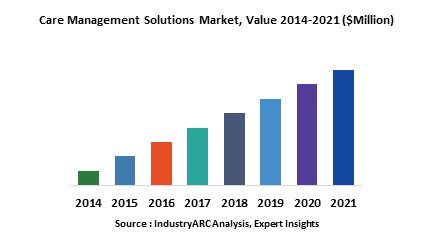
Globally North America dominated the market for care management solutions in 2015 due to highly developed and systematic medical infrastructure with advanced and latest technologies. North America is expected to continue its domination during the period of study and was followed by Europe and Asia-Pacific as the second and third largest markets respectively in 2015. However Asia-Pacific is expected to be the fastest growing market due to rapidly changing and fast developing medical infrastructure in the region.
This report on global care management solutions is segmented on the basis of applications, deployment and end-users of care management solutions and market size in various geographical regions.
Sample Companies profiled in this report are:
This report identifies the care management solutions market size in for the year 2014-2016, and forecast of the same for year 2021. It also highlights the potential growth opportunities in the coming years, while also reviewing the market drivers, restraints, growth indicators, challenges, market dynamics, competitive landscape, and other key aspects with respect to care management solutions market.
Globally North America dominated the market for care management solutions in 2015 due to highly developed and systematic medical infrastructure with advanced and latest technologies. North America is expected to continue its domination during the period of study and was followed by Europe and Asia-Pacific as the second and third largest markets respectively in 2015. However Asia-Pacific is expected to be the fastest growing market due to rapidly changing and fast developing medical infrastructure in the region.
This report on global care management solutions is segmented on the basis of applications, deployment and end-users of care management solutions and market size in various geographical regions.
- On the basis of applications of care management solutions this report is classified as follows covering all major applications of care management solutions: Chronic Care Management (Cancer, Diabetes, Stroke, Cardiovascular Disease, and Others), Case Management, Disease Management, Utilization Management and Others
- This report care management solutions market is also segmented on the basis of deployment of care management solutions: Network based, On-cloud, and On premises
- This report care management solutions market is also segmented on the basis of major end-users of care management solutions, some of the major end-users care management solutions are: Hospitals, Home/Ambulatory and Others
- This is report has been further segmented into major regions, which includes detailed analysis of each region such as North America, Europe, Asia-Pacific (APAC) and Rest of the World (RoW) covering all the major country level markets for care management solutions in each of the region.
Sample Companies profiled in this report are:
- Allscripts Healthcare Solutions, Inc.
- Harmony Information Systems, Inc.
- Salesforce.Com, Inc.
- Healthsmart Holdings, Inc
- Exl Healthcare (Exlservice Holdings, Inc.)
- 10+.
1. Care Management Solutions – Market Overview
2. Executive Summary
3. Care Management Solutions Market Landscape
3.1. Market Share Analysis
3.2. Comparative Analysis
3.2.1. Product Benchmarking
3.2.2. End User Profiling
3.2.3. Top 5 Financials Analysis
4. Care Management Solutions – Market Forces
4.1. Drivers
4.1.1. Growing medical tourism in emerging economies
4.1.2. Care management solutions helps in reducing the healthcare costs
4.2. Restraints
4.2.1. High Cost
4.3. Opportunities
4.3.1. Technological advancement leading to transformation of the hospital infrastructure
4.4. Challenges
4.5. Porter’s Five Forces Analysis
4.5.1. Bargaining Power of Suppliers
4.5.2. Bargaining Power of Buyers
4.5.3. Threat of New Entrants
4.5.4. Threat of Substitutes
4.5.5. Degree of Competition
5. Care Management Solutions Market – Strategic Analysis
5.1. Value Chain Analysis
5.2. Pricing Analysis
5.3. Opportunities Analysis
5.4. Product/Market Life Cycle Analysis
5.5. Suppliers and Distributors
6. Global Care Management Solutions Market, By Application
6.1. Chronic Care Management
6.1.1. Cancer
6.1.2. Diabetes
6.1.3. Stroke
6.1.4. Cardiovascular Disease,
6.1.5. Others
6.2. Case Management
6.3. Disease Management
6.4. Utilization Management
6.5. Others
7. Global Care Management Solutions Market, By Deployment
7.1. Network based
7.2. On-Cloud
7.3. On Premises
8. Global Care Management Solutions Market, By End-User
8.1. Hospitals
8.2. Home/Ambulatory
8.3. Others
9. Global Care Management Solutions Market, By Geography
9.1. Europe
9.1.1. Germany
9.1.2. France
9.1.3. Italy
9.1.4. Spain
9.1.5. Russia
9.1.6. U.K.
9.1.7. Rest of Europe
9.2. Asia Pacific
9.2.1. China
9.2.2. India
9.2.3. Japan
9.2.4. South Korea
9.2.5. Rest of Asia-Pacific
9.3. North America
9.3.1. U.S.
9.3.2. Canada
9.3.3. Mexico
9.4. Rest of the World (RoW)
9.4.1. Brazil
9.4.2. Rest of RoW
10. Care Management Solutions – Market Entropy
10.1. Expansion
10.2. Technological Developments
10.3. Merger & Acquisitions, and Joint Ventures
10.4. Supply- Contract
11. Company Profiles
11.1. Allscripts Healthcare Solutions, Inc.
11.1.1. Introduction
11.1.2. Financials
11.1.3. Key Insights
11.1.4. Key Strategy
11.1.5. Product Portfolio
11.1.6. SWOT Analysis
11.2. Harmony Information Systems, Inc.
11.2.1. Introduction
11.2.2. Financials
11.2.3. Key Insights
11.2.4. Key Strategy
11.2.5. Product Portfolio
11.2.6. SWOT Analysis
11.3. Salesforce.Com, Inc.
11.3.1. Introduction
11.3.2. Financials
11.3.3. Key Insights
11.3.4. Key Strategy
11.3.5. Product Portfolio
11.3.6. SWOT Analysis
11.4. Healthsmart Holdings, Inc
11.4.1. Introduction
11.4.2. Financials
11.4.3. Key Insights
11.4.4. Key Strategy
11.4.5. Product Portfolio
11.4.6. SWOT Analysis
11.5. Exl Healthcare (Exlservice Holdings, Inc.)
11.5.1. Introduction
11.5.2. Financials
11.5.3. Key Insights
11.5.4. Key Strategy
11.5.5. Product Portfolio
11.5.6. SWOT Analysis
11.6. Medecision Inc.
11.6.1. Introduction
11.6.2. Financials
11.6.3. Key Insights
11.6.4. Key Strategy
11.6.5. Product Portfolio
11.6.6. SWOT Analysis
11.7. Trizetto Corporation
11.7.1. Introduction
11.7.2. Financials
11.7.3. Key Insights
11.7.4. Key Strategy
11.7.5. Product Portfolio
11.7.6. SWOT Analysis
11.8. Pegasystems Inc.
11.8.1. Introduction
11.8.2. Financials
11.8.3. Key Insights
11.8.4. Key Strategy
11.8.5. Product Portfolio
11.8.6. SWOT Analysis
11.9. Wellcentive, Inc.
11.9.1. Introduction
11.9.2. Financials
11.9.3. Key Insights
11.9.4. Key Strategy
11.9.5. Product Portfolio
11.9.6. SWOT Analysis
11.10. Phytel, Inc.
11.10.1. Introduction
11.10.2. Financials
11.10.3. Key Insights
11.10.4. Key Strategy
11.10.5. Product Portfolio
11.10.6. SWOT Analysis
*More than 10 Companies are profiled in this Research Report*
"*Financials would be provided on a best efforts basis for private companies"
12. Appendix
12.1. Abbreviations
12.2. Sources
12.3. Research Methodology
12.4. Expert Insights
List of Tables:
Table1: Care Management Solutions Market Overview 2021-2026
Table2: Care Management Solutions Market Leader Analysis 2018-2019 (US$)
Table3: Care Management Solutions Market Product Analysis 2018-2019 (US$)
Table4: Care Management Solutions Market End User Analysis 2018-2019 (US$)
Table5: Care Management Solutions Market Patent Analysis 2013-2018* (US$)
Table6: Care Management Solutions Market Financial Analysis 2018-2019 (US$)
Table7: Care Management Solutions Market Driver Analysis 2018-2019 (US$)
Table8: Care Management Solutions Market Challenges Analysis 2018-2019 (US$)
Table9: Care Management Solutions Market Constraint Analysis 2018-2019 (US$)
Table10: Care Management Solutions Market Supplier Bargaining Power Analysis 2018-2019 (US$)
Table11: Care Management Solutions Market Buyer Bargaining Power Analysis 2018-2019 (US$)
Table12: Care Management Solutions Market Threat of Substitutes Analysis 2018-2019 (US$)
Table13: Care Management Solutions Market Threat of New Entrants Analysis 2018-2019 (US$)
Table14: Care Management Solutions Market Degree of Competition Analysis 2018-2019 (US$)
Table15: Care Management Solutions Market Value Chain Analysis 2018-2019 (US$)
Table16: Care Management Solutions Market Pricing Analysis 2021-2026 (US$)
Table17: Care Management Solutions Market Opportunities Analysis 2021-2026 (US$)
Table18: Care Management Solutions Market Product Life Cycle Analysis 2021-2026 (US$)
Table19: Care Management Solutions Market Supplier Analysis 2018-2019 (US$)
Table20: Care Management Solutions Market Distributor Analysis 2018-2019 (US$)
Table21: Care Management Solutions Market Trend Analysis 2018-2019 (US$)
Table22: Care Management Solutions Market Size 2018 (US$)
Table23: Care Management Solutions Market Forecast Analysis 2021-2026 (US$)
Table24: Care Management Solutions Market Sales Forecast Analysis 2021-2026 (Units)
Table25: Care Management Solutions Market, Revenue & Volume, By Deployment, 2021-2026 ($)
Table26: Care Management Solutions Market By Deployment, Revenue & Volume, By Network based, 2021-2026 ($)
Table27: Care Management Solutions Market By Deployment, Revenue & Volume, By On-Cloud, 2021-2026 ($)
Table28: Care Management Solutions Market By Deployment, Revenue & Volume, By On Premises, 2021-2026 ($)
Table29: Care Management Solutions Market, Revenue & Volume, By Application, 2021-2026 ($)
Table30: Care Management Solutions Market By Application, Revenue & Volume, By Chronic Care Management, 2021-2026 ($)
Table31: Care Management Solutions Market By Application, Revenue & Volume, By Case Management, 2021-2026 ($)
Table32: Care Management Solutions Market By Application, Revenue & Volume, By Disease Management, 2021-2026 ($)
Table33: Care Management Solutions Market By Application, Revenue & Volume, By Utilization Management, 2021-2026 ($)
Table34: Care Management Solutions Market, Revenue & Volume, By End Use, 2021-2026 ($)
Table35: Care Management Solutions Market By End Use, Revenue & Volume, By Hospitals, 2021-2026 ($)
Table36: Care Management Solutions Market By End Use, Revenue & Volume, By Home/Ambulatory, 2021-2026 ($)
Table37: North America Care Management Solutions Market, Revenue & Volume, By Deployment, 2021-2026 ($)
Table38: North America Care Management Solutions Market, Revenue & Volume, By Application, 2021-2026 ($)
Table39: North America Care Management Solutions Market, Revenue & Volume, By End Use, 2021-2026 ($)
Table40: South america Care Management Solutions Market, Revenue & Volume, By Deployment, 2021-2026 ($)
Table41: South america Care Management Solutions Market, Revenue & Volume, By Application, 2021-2026 ($)
Table42: South america Care Management Solutions Market, Revenue & Volume, By End Use, 2021-2026 ($)
Table43: Europe Care Management Solutions Market, Revenue & Volume, By Deployment, 2021-2026 ($)
Table44: Europe Care Management Solutions Market, Revenue & Volume, By Application, 2021-2026 ($)
Table45: Europe Care Management Solutions Market, Revenue & Volume, By End Use, 2021-2026 ($)
Table46: APAC Care Management Solutions Market, Revenue & Volume, By Deployment, 2021-2026 ($)
Table47: APAC Care Management Solutions Market, Revenue & Volume, By Application, 2021-2026 ($)
Table48: APAC Care Management Solutions Market, Revenue & Volume, By End Use, 2021-2026 ($)
Table49: Middle East & Africa Care Management Solutions Market, Revenue & Volume, By Deployment, 2021-2026 ($)
Table50: Middle East & Africa Care Management Solutions Market, Revenue & Volume, By Application, 2021-2026 ($)
Table51: Middle East & Africa Care Management Solutions Market, Revenue & Volume, By End Use, 2021-2026 ($)
Table52: Russia Care Management Solutions Market, Revenue & Volume, By Deployment, 2021-2026 ($)
Table53: Russia Care Management Solutions Market, Revenue & Volume, By Application, 2021-2026 ($)
Table54: Russia Care Management Solutions Market, Revenue & Volume, By End Use, 2021-2026 ($)
Table55: Israel Care Management Solutions Market, Revenue & Volume, By Deployment, 2021-2026 ($)
Table56: Israel Care Management Solutions Market, Revenue & Volume, By Application, 2021-2026 ($)
Table57: Israel Care Management Solutions Market, Revenue & Volume, By End Use, 2021-2026 ($)
Table58: Top Companies 2018 (US$)Care Management Solutions Market, Revenue & Volume
Table59: Product Launch 2018-2019Care Management Solutions Market, Revenue & Volume
Table60: Mergers & Acquistions 2018-2019Care Management Solutions Market, Revenue & Volume
List of Figures:
Figure 1: Overview of Care Management Solutions Market 2021-2026
Figure 2: Market Share Analysis for Care Management Solutions Market 2018 (US$)
Figure 3: Product Comparison in Care Management Solutions Market 2018-2019 (US$)
Figure 4: End User Profile for Care Management Solutions Market 2018-2019 (US$)
Figure 5: Patent Application and Grant in Care Management Solutions Market 2013-2018* (US$)
Figure 6: Top 5 Companies Financial Analysis in Care Management Solutions Market 2018-2019 (US$)
Figure 7: Market Entry Strategy in Care Management Solutions Market 2018-2019
Figure 8: Ecosystem Analysis in Care Management Solutions Market 2018
Figure 9: Average Selling Price in Care Management Solutions Market 2021-2026
Figure 10: Top Opportunites in Care Management Solutions Market 2018-2019
Figure 11: Market Life Cycle Analysis in Care Management Solutions Market
Figure 12: GlobalBy DeploymentCare Management Solutions Market Revenue, 2021-2026 ($)
Figure 13: GlobalBy ApplicationCare Management Solutions Market Revenue, 2021-2026 ($)
Figure 14: GlobalBy End UseCare Management Solutions Market Revenue, 2021-2026 ($)
Figure 15: Global Care Management Solutions Market - By Geography
Figure 16: Global Care Management Solutions Market Value & Volume, By Geography, 2021-2026 ($)
Figure 17: Global Care Management Solutions Market CAGR, By Geography, 2021-2026 (%)
Figure 18: North America Care Management Solutions Market Value & Volume, 2021-2026 ($)
Figure 19: US Care Management Solutions Market Value & Volume, 2021-2026 ($)
Figure 20: US GDP and Population, 2018-2019 ($)
Figure 21: US GDP – Composition of 2018, By Sector of Origin
Figure 22: US Export and Import Value & Volume, 2018-2019 ($)
Figure 23: Canada Care Management Solutions Market Value & Volume, 2021-2026 ($)
Figure 24: Canada GDP and Population, 2018-2019 ($)
Figure 25: Canada GDP – Composition of 2018, By Sector of Origin
Figure 26: Canada Export and Import Value & Volume, 2018-2019 ($)
Figure 27: Mexico Care Management Solutions Market Value & Volume, 2021-2026 ($)
Figure 28: Mexico GDP and Population, 2018-2019 ($)
Figure 29: Mexico GDP – Composition of 2018, By Sector of Origin
Figure 30: Mexico Export and Import Value & Volume, 2018-2019 ($)
Figure 31: South America Care Management Solutions Market Value & Volume, 2021-2026 ($)
Figure 32: Brazil Care Management Solutions Market Value & Volume, 2021-2026 ($)
Figure 33: Brazil GDP and Population, 2018-2019 ($)
Figure 34: Brazil GDP – Composition of 2018, By Sector of Origin
Figure 35: Brazil Export and Import Value & Volume, 2018-2019 ($)
Figure 36: Venezuela Care Management Solutions Market Value & Volume, 2021-2026 ($)
Figure 37: Venezuela GDP and Population, 2018-2019 ($)
Figure 38: Venezuela GDP – Composition of 2018, By Sector of Origin
Figure 39: Venezuela Export and Import Value & Volume, 2018-2019 ($)
Figure 40: Argentina Care Management Solutions Market Value & Volume, 2021-2026 ($)
Figure 41: Argentina GDP and Population, 2018-2019 ($)
Figure 42: Argentina GDP – Composition of 2018, By Sector of Origin
Figure 43: Argentina Export and Import Value & Volume, 2018-2019 ($)
Figure 44: Ecuador Care Management Solutions Market Value & Volume, 2021-2026 ($)
Figure 45: Ecuador GDP and Population, 2018-2019 ($)
Figure 46: Ecuador GDP – Composition of 2018, By Sector of Origin
Figure 47: Ecuador Export and Import Value & Volume, 2018-2019 ($)
Figure 48: Peru Care Management Solutions Market Value & Volume, 2021-2026 ($)
Figure 49: Peru GDP and Population, 2018-2019 ($)
Figure 50: Peru GDP – Composition of 2018, By Sector of Origin
Figure 51: Peru Export and Import Value & Volume, 2018-2019 ($)
Figure 52: Colombia Care Management Solutions Market Value & Volume, 2021-2026 ($)
Figure 53: Colombia GDP and Population, 2018-2019 ($)
Figure 54: Colombia GDP – Composition of 2018, By Sector of Origin
Figure 55: Colombia Export and Import Value & Volume, 2018-2019 ($)
Figure 56: Costa Rica Care Management Solutions Market Value & Volume, 2021-2026 ($)
Figure 57: Costa Rica GDP and Population, 2018-2019 ($)
Figure 58: Costa Rica GDP – Composition of 2018, By Sector of Origin
Figure 59: Costa Rica Export and Import Value & Volume, 2018-2019 ($)
Figure 60: Europe Care Management Solutions Market Value & Volume, 2021-2026 ($)
Figure 61: U.K Care Management Solutions Market Value & Volume, 2021-2026 ($)
Figure 62: U.K GDP and Population, 2018-2019 ($)
Figure 63: U.K GDP – Composition of 2018, By Sector of Origin
Figure 64: U.K Export and Import Value & Volume, 2018-2019 ($)
Figure 65: Germany Care Management Solutions Market Value & Volume, 2021-2026 ($)
Figure 66: Germany GDP and Population, 2018-2019 ($)
Figure 67: Germany GDP – Composition of 2018, By Sector of Origin
Figure 68: Germany Export and Import Value & Volume, 2018-2019 ($)
Figure 69: Italy Care Management Solutions Market Value & Volume, 2021-2026 ($)
Figure 70: Italy GDP and Population, 2018-2019 ($)
Figure 71: Italy GDP – Composition of 2018, By Sector of Origin
Figure 72: Italy Export and Import Value & Volume, 2018-2019 ($)
Figure 73: France Care Management Solutions Market Value & Volume, 2021-2026 ($)
Figure 74: France GDP and Population, 2018-2019 ($)
Figure 75: France GDP – Composition of 2018, By Sector of Origin
Figure 76: France Export and Import Value & Volume, 2018-2019 ($)
Figure 77: Netherlands Care Management Solutions Market Value & Volume, 2021-2026 ($)
Figure 78: Netherlands GDP and Population, 2018-2019 ($)
Figure 79: Netherlands GDP – Composition of 2018, By Sector of Origin
Figure 80: Netherlands Export and Import Value & Volume, 2018-2019 ($)
Figure 81: Belgium Care Management Solutions Market Value & Volume, 2021-2026 ($)
Figure 82: Belgium GDP and Population, 2018-2019 ($)
Figure 83: Belgium GDP – Composition of 2018, By Sector of Origin
Figure 84: Belgium Export and Import Value & Volume, 2018-2019 ($)
Figure 85: Spain Care Management Solutions Market Value & Volume, 2021-2026 ($)
Figure 86: Spain GDP and Population, 2018-2019 ($)
Figure 87: Spain GDP – Composition of 2018, By Sector of Origin
Figure 88: Spain Export and Import Value & Volume, 2018-2019 ($)
Figure 89: Denmark Care Management Solutions Market Value & Volume, 2021-2026 ($)
Figure 90: Denmark GDP and Population, 2018-2019 ($)
Figure 91: Denmark GDP – Composition of 2018, By Sector of Origin
Figure 92: Denmark Export and Import Value & Volume, 2018-2019 ($)
Figure 93: APAC Care Management Solutions Market Value & Volume, 2021-2026 ($)
Figure 94: China Care Management Solutions Market Value & Volume, 2021-2026
Figure 95: China GDP and Population, 2018-2019 ($)
Figure 96: China GDP – Composition of 2018, By Sector of Origin
Figure 97: China Export and Import Value & Volume, 2018-2019 ($)Care Management Solutions Market China Export and Import Value & Volume, 2018-2019 ($)
Figure 98: Australia Care Management Solutions Market Value & Volume, 2021-2026 ($)
Figure 99: Australia GDP and Population, 2018-2019 ($)
Figure 100: Australia GDP – Composition of 2018, By Sector of Origin
Figure 101: Australia Export and Import Value & Volume, 2018-2019 ($)
Figure 102: South Korea Care Management Solutions Market Value & Volume, 2021-2026 ($)
Figure 103: South Korea GDP and Population, 2018-2019 ($)
Figure 104: South Korea GDP – Composition of 2018, By Sector of Origin
Figure 105: South Korea Export and Import Value & Volume, 2018-2019 ($)
Figure 106: India Care Management Solutions Market Value & Volume, 2021-2026 ($)
Figure 107: India GDP and Population, 2018-2019 ($)
Figure 108: India GDP – Composition of 2018, By Sector of Origin
Figure 109: India Export and Import Value & Volume, 2018-2019 ($)
Figure 110: Taiwan Care Management Solutions Market Value & Volume, 2021-2026 ($)
Figure 111: Taiwan GDP and Population, 2018-2019 ($)
Figure 112: Taiwan GDP – Composition of 2018, By Sector of Origin
Figure 113: Taiwan Export and Import Value & Volume, 2018-2019 ($)
Figure 114: Malaysia Care Management Solutions Market Value & Volume, 2021-2026 ($)
Figure 115: Malaysia GDP and Population, 2018-2019 ($)
Figure 116: Malaysia GDP – Composition of 2018, By Sector of Origin
Figure 117: Malaysia Export and Import Value & Volume, 2018-2019 ($)
Figure 118: Hong Kong Care Management Solutions Market Value & Volume, 2021-2026 ($)
Figure 119: Hong Kong GDP and Population, 2018-2019 ($)
Figure 120: Hong Kong GDP – Composition of 2018, By Sector of Origin
Figure 121: Hong Kong Export and Import Value & Volume, 2018-2019 ($)
Figure 122: Middle East & Africa Care Management Solutions Market Middle East & Africa 3D Printing Market Value & Volume, 2021-2026 ($)
Figure 123: Russia Care Management Solutions Market Value & Volume, 2021-2026 ($)
Figure 124: Russia GDP and Population, 2018-2019 ($)
Figure 125: Russia GDP – Composition of 2018, By Sector of Origin
Figure 126: Russia Export and Import Value & Volume, 2018-2019 ($)
Figure 127: Israel Care Management Solutions Market Value & Volume, 2021-2026 ($)
Figure 128: Israel GDP and Population, 2018-2019 ($)
Figure 129: Israel GDP – Composition of 2018, By Sector of Origin
Figure 130: Israel Export and Import Value & Volume, 2018-2019 ($)
Figure 131: Entropy Share, By Strategies, 2018-2019* (%)Care Management Solutions Market
Figure 132: Developments, 2018-2019*Care Management Solutions Market
Figure 133: Company 1 Care Management Solutions Market Net Revenue, By Years, 2018-2019* ($)
Figure 134: Company 1 Care Management Solutions Market Net Revenue Share, By Business segments, 2018 (%)
Figure 135: Company 1 Care Management Solutions Market Net Sales Share, By Geography, 2018 (%)
Figure 136: Company 2 Care Management Solutions Market Net Revenue, By Years, 2018-2019* ($)
Figure 137: Company 2 Care Management Solutions Market Net Revenue Share, By Business segments, 2018 (%)
Figure 138: Company 2 Care Management Solutions Market Net Sales Share, By Geography, 2018 (%)
Figure 139: Company 3 Care Management Solutions Market Net Revenue, By Years, 2018-2019* ($)
Figure 140: Company 3 Care Management Solutions Market Net Revenue Share, By Business segments, 2018 (%)
Figure 141: Company 3 Care Management Solutions Market Net Sales Share, By Geography, 2018 (%)
Figure 142: Company 4 Care Management Solutions Market Net Revenue, By Years, 2018-2019* ($)
Figure 143: Company 4 Care Management Solutions Market Net Revenue Share, By Business segments, 2018 (%)
Figure 144: Company 4 Care Management Solutions Market Net Sales Share, By Geography, 2018 (%)
Figure 145: Company 5 Care Management Solutions Market Net Revenue, By Years, 2018-2019* ($)
Figure 146: Company 5 Care Management Solutions Market Net Revenue Share, By Business segments, 2018 (%)
Figure 147: Company 5 Care Management Solutions Market Net Sales Share, By Geography, 2018 (%)
Figure 148: Company 6 Care Management Solutions Market Net Revenue, By Years, 2018-2019* ($)
Figure 149: Company 6 Care Management Solutions Market Net Revenue Share, By Business segments, 2018 (%)
Figure 150: Company 6 Care Management Solutions Market Net Sales Share, By Geography, 2018 (%)
Figure 151: Company 7 Care Management Solutions Market Net Revenue, By Years, 2018-2019* ($)
Figure 152: Company 7 Care Management Solutions Market Net Revenue Share, By Business segments, 2018 (%)
Figure 153: Company 7 Care Management Solutions Market Net Sales Share, By Geography, 2018 (%)
Figure 154: Company 8 Care Management Solutions Market Net Revenue, By Years, 2018-2019* ($)
Figure 155: Company 8 Care Management Solutions Market Net Revenue Share, By Business segments, 2018 (%)
Figure 156: Company 8 Care Management Solutions Market Net Sales Share, By Geography, 2018 (%)
Figure 157: Company 9 Care Management Solutions Market Net Revenue, By Years, 2018-2019* ($)
Figure 158: Company 9 Care Management Solutions Market Net Revenue Share, By Business segments, 2018 (%)
Figure 159: Company 9 Care Management Solutions Market Net Sales Share, By Geography, 2018 (%)
Figure 160: Company 10 Care Management Solutions Market Net Revenue, By Years, 2018-2019* ($)
Figure 161: Company 10 Care Management Solutions Market Net Revenue Share, By Business segments, 2018 (%)
Figure 162: Company 10 Care Management Solutions Market Net Sales Share, By Geography, 2018 (%)
Figure 163: Company 11 Care Management Solutions Market Net Revenue, By Years, 2018-2019* ($)
Figure 164: Company 11 Care Management Solutions Market Net Revenue Share, By Business segments, 2018 (%)
Figure 165: Company 11 Care Management Solutions Market Net Sales Share, By Geography, 2018 (%)
Figure 166: Company 12 Care Management Solutions Market Net Revenue, By Years, 2018-2019* ($)
Figure 167: Company 12 Care Management Solutions Market Net Revenue Share, By Business segments, 2018 (%)
Figure 168: Company 12 Care Management Solutions Market Net Sales Share, By Geography, 2018 (%)
Figure 169: Company 13 Care Management Solutions Market Net Revenue, By Years, 2018-2019* ($)
Figure 170: Company 13 Care Management Solutions Market Net Revenue Share, By Business segments, 2018 (%)
Figure 171: Company 13 Care Management Solutions Market Net Sales Share, By Geography, 2018 (%)
Figure 172: Company 14 Care Management Solutions Market Net Revenue, By Years, 2018-2019* ($)
Figure 173: Company 14 Care Management Solutions Market Net Revenue Share, By Business segments, 2018 (%)
Figure 174: Company 14 Care Management Solutions Market Net Sales Share, By Geography, 2018 (%)
Figure 175: Company 15 Care Management Solutions Market Net Revenue, By Years, 2018-2019* ($)
Figure 176: Company 15 Care Management Solutions Market Net Revenue Share, By Business segments, 2018 (%)
Figure 177: Company 15 Care Management Solutions Market Net Sales Share, By Geography, 2018 (%)