 Email
Email Print
Print


Calcium Acetate Market Overview
The Calcium Acetate Market size is projected to reach US$128.9 million by 2027, after growing at a CAGR of 3.2% during the forecast period 2022-2027. Calcium acetate is a chemical compound that is a calcium salt of acetic acid. It is also known as calcium ethanoate. Calcium acetate has several important properties, including high wettability, a high melting point, efficient free-flow ability and others. These characteristics ensure a superior base for a variety of products. Thus, calcium acetate is utilized in pharmaceutical and industrial applications. The growth of the pharmaceutical industry is driving the Calcium Acetate Market. However, in 2020, the restrictions relating to production activities due to the Covid-19 pandemic negatively impacted the calcium acetate industry growth. In 2021, the ease of restrictions strengthened the growth of various industries, including pharmaceuticals, food & beverage and more. This, in turn, accelerated the growth of the calcium acetate industry. Moreover, the booming food & beverage industry will boost the demand for calcium acetate. As a result, the Calcium Acetate Market size will grow during the forecast period of 2022-2027.
Report Coverage
The "Calcium Acetate Market Report–Forecast (2022-2027)” by IndustryARC, covers an in-depth analysis of the following segments in the Calcium Acetate Market.
Key Takeaways
- Asia-Pacific dominated the Calcium Acetate Market, owing to the growth of the pharmaceutical industry in the region. For instance, according to the General Statistics Office of Vietnam, in 2020, the total pharmaceutical production in Vietnam was US$3484.5 million, an increase of about 7.03% over 2019.
- The key factors such as the rapid pace of industrialization, increasing disposable income of people and other factors will accelerate the demand for the automotive and construction industry. This, in turn, will propel the demand for calcium acetate-based lubricants, coatings and ceramics. Hence, this will create an opportunity for the Calcium Acetate Market in the upcoming years.
- Moreover, the growth of the bakery industry is propelling the demand for calcium acetate-based food additives to extend the shelf-life of bakery products. This factor is driving the market growth.
- Nevertheless, the availability of calcium acetate substitutes such as calcium carbonate, phoslyra, camphor and more may restrict the market growth in the coming years.
Calcium Acetate Market Segment Analysis – by Application
The pharmaceutical ingredient segment held the largest Calcium Acetate Market share in 2021 and is forecasted to grow at a CAGR of 3.3% during the forecast period 2022-2027. Calcium acetate, a chemical compound that is a calcium salt of acetic acid is employed as a phosphate binder in pharmaceutical ingredients to reduce the absorption of phosphate in the body. Calcium acetate is used in medicines for end-stage renal disease (ESRD) patients whose kidneys are unable to filter out the phosphates found in everyday food due to hyperphosphatemia. Also, neither dialysis nor kidney dialysis can completely remove all phosphorus from the body. The phosphates found in the majority of meals and beverages are mixed with calcium acetate to produce insoluble calcium phosphate complexes, which are excreted from the body. As a result, the body absorbs less phosphorus and the blood's phosphorus levels decrease. Thus, owing to these benefits the application of pharmaceutical ingredients is increasing. This, in turn, is accelerating the Calcium Acetate Market growth.
Calcium Acetate Market Segment Analysis – by End-use Industry
The pharmaceutical segment held the largest Calcium Acetate Market share in 2021 and is forecasted to grow at a CAGR of 3.5% during the forecast period 2022-2027. Calcium acetate is deployed in the pharmaceutical industry to treat hyperphosphatemia in patients with end-stage kidney disease who are on dialysis. The rapidly growing expansion of modern technology, increasing demand for medicine for kidney diseases and other similar factors are accelerating the growth of the pharmaceutical industry. For instance, according to the European Federation of Pharmaceutical Industries and Associations (EFPIA), in 2020, the total production of pharmaceuticals in Europe was EURO 310,000 million (approximately US$354,080.76 million), including medicines for kidney diseases, an increase of 5.7% over 2019. Hence, the growth of the pharmaceutical industry is projected to drive the demand for calcium acetate. As a result, the market growth will propel during the projected forecast period.
Calcium Acetate Market Segment Analysis – by Geography
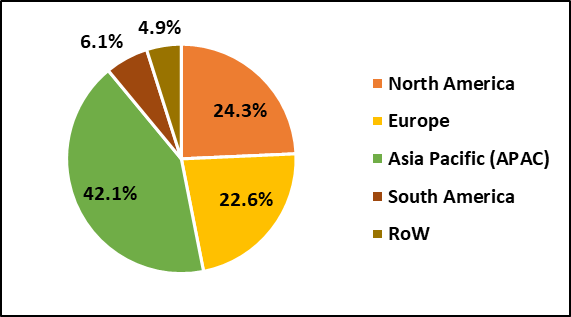
Asia-Pacific is the dominating region as it held the largest Calcium Acetate Market share in 2021 up to 42%. The sectoral growth of the Asia-Pacific countries is expanding due to the growth of the various industries, including pharmaceuticals, food & beverage and other such sectors in the region. The growth of the pharmaceuticals sector in the Asia-Pacific region is attributed to various factors such as ongoing research and development related to medicines for kidney patients, the development of specialty hospitals dedicated to kidney patients and other factors fueling the pharmaceutical industry growth. For instance, according to the International Trade Administration, the pharmaceuticals market, including medicines for kidney diseases in Vietnam is expected to grow by a 10% annual rate from 2017 to 2028, with revenues per capita virtually tripling in ten years from 2017 to 2027. Moreover, according to the recent report by the United States Renal Data System (USRDS), an association for end-stage renal disease (ESRD) data collection, in 2019, the case of treated end-stage renal disease (ESRD) in Asian countries was Taiwan (529 per million population), Thailand (377 per million population), South Korea (360 per million population) and more. Therefore the growth of the pharmaceuticals industry and surging cases of end-stage renal disease (ESRD) in the Asia-Pacific region are fueling the demand for calcium acetate. This factor is expanding the Calcium Acetate Market size.
Calcium Acetate Market Drivers
Bolstering Bakery Industry
The high moisture content of bakery products leads to the growth of molds and rope bacteria. Many bacteria and molds are inhibited from growing by calcium acetate. As a result, calcium acetate, a substance of acetic acid calcium salt is often used in bread and other bakery products to extend their shelf life and prevent rope formation. The factors such as increasing consumer preference for convenience food, nutritional values and more are resulting in the surging bakery industry. For instance, according to the China Chain Store Association, the bakery and dessert franchises are growing in China. In the year 2019, in tier 1 and 2 cities of China bakery and dessert shop franchises grow by 95% and in tier 3 and 4 cities in China, it was 43%. Also, according to the Federation of Bakers Ltd, in the year 2020, the U.K morning and snacks bakery production were 1.09 billion and in 2021 it was 1.18 billion units, an increase of 7.6%. Hence, the growth of the bakery industry is boosting the demand for calcium acetate. This is driving the market growth.
Surging Demand for Medicines for End-Stage Renal Disease (ESRD)
Calcium Acetate is deployed in medicines to control high blood phosphorus levels in dialysis patients with end-stage renal disease (ESRD). The surging number of diabetic paints coupled with increasing cases of high blood pressure are the vital factors accelerating the surge in end-stage renal disease (ESRD) cases. For instance, according to the National Institute of Diabetes and Digestive and Kidney Diseases (NIDDK), in 2021, about 2 in every 1,000 Americans are living with end-stage kidney disease (ESKD). Furthermore, according to the most recent United States Renal Data System (USRDS) report, 134,608 people were assed with end-stage renal disease (ESRD) in 2019, an increase of 2.7 percent over 2018. Therefore, the increasing cases of end-stage renal disease (ESRD) are spurring the demand for medicines for the treatment of end-stage renal disease (ESRD). As a result, the Calcium Acetate Market is growing.
Calcium Acetate Market Challenges
Substitutes and High Price of Calcium Acetate
The substitutes for calcium acetate are calcium carbonate, phoslyra, calphron and more. These substitutes have various similar properties and in some cases superior properties over calcium acetate. For instance, calcium carbonate has various essential properties such as Superior light scattering capability, high brightness and lower costs. As a result, for the application industries such as textile, construction and other applications, calcium carbonate is preferred over calcium acetate. Moreover, the surge in the prices of calcium acetate because of the spillover effect of rising acetate prices on the global market, high freight charges and a scarcity of shipping containers contributed to the growing calcium acetate pricing trend. For illustration, calcium acetate IR Grade CFR-Kandla monthly average September 2021 prices were US$1946.13 per MT, a marginal increase from July 2021. Hence, the availability of substitute products and high prices of calcium acetate may limit the calcium acetate industry growth during the forecast period of 2022-2027.
Calcium Acetate Industry Outlook
Technology launches, acquisitions and increased R&D activities are key strategies adopted by players in the Calcium Acetate Market. The top 10 companies in the Calcium Acetate Market are:
- Niacet
- Macco Organiques
- Akshay Group
- Amsyn
- Daito Chemical
- Plater Group
- Jiangsu Kolod Food
- Wuxi Yangshan Biochemical
- Tengzhou Zhongzheng Chemical
- Alemark
Relevant Reports
Report Code: HCR 0054
Report Code: CMR 0333
Report Code: CMR 49438
For more Chemicals and Materials Market reports, please click here
Table 1: Calcium Acetate Market Overview 2021-2026
Table 2: Calcium Acetate Market Leader Analysis 2018-2019 (US$)
Table 3: Calcium Acetate Market Product Analysis 2018-2019 (US$)
Table 4: Calcium Acetate Market End User Analysis 2018-2019 (US$)
Table 5: Calcium Acetate Market Patent Analysis 2013-2018* (US$)
Table 6: Calcium Acetate Market Financial Analysis 2018-2019 (US$)
Table 7: Calcium Acetate Market Driver Analysis 2018-2019 (US$)
Table 8: Calcium Acetate Market Challenges Analysis 2018-2019 (US$)
Table 9: Calcium Acetate Market Constraint Analysis 2018-2019 (US$)
Table 10: Calcium Acetate Market Supplier Bargaining Power Analysis 2018-2019 (US$)
Table 11: Calcium Acetate Market Buyer Bargaining Power Analysis 2018-2019 (US$)
Table 12: Calcium Acetate Market Threat of Substitutes Analysis 2018-2019 (US$)
Table 13: Calcium Acetate Market Threat of New Entrants Analysis 2018-2019 (US$)
Table 14: Calcium Acetate Market Degree of Competition Analysis 2018-2019 (US$)
Table 15: Calcium Acetate Market Value Chain Analysis 2018-2019 (US$)
Table 16: Calcium Acetate Market Pricing Analysis 2021-2026 (US$)
Table 17: Calcium Acetate Market Opportunities Analysis 2021-2026 (US$)
Table 18: Calcium Acetate Market Product Life Cycle Analysis 2021-2026 (US$)
Table 19: Calcium Acetate Market Supplier Analysis 2018-2019 (US$)
Table 20: Calcium Acetate Market Distributor Analysis 2018-2019 (US$)
Table 21: Calcium Acetate Market Trend Analysis 2018-2019 (US$)
Table 22: Calcium Acetate Market Size 2018 (US$)
Table 23: Calcium Acetate Market Forecast Analysis 2021-2026 (US$)
Table 24: Calcium Acetate Market Sales Forecast Analysis 2021-2026 (Units)
Table 25: Calcium Acetate Market, Revenue & Volume,By Application Industry, 2021-2026 ($)
Table 26: Calcium Acetate Market By Application Industry, Revenue & Volume,By Food & Beverage, 2021-2026 ($)
Table 27: Calcium Acetate Market By Application Industry, Revenue & Volume,By Pharmaceutical, 2021-2026 ($)
Table 28: Calcium Acetate Market By Application Industry, Revenue & Volume,By Chemical Manufacturing, 2021-2026 ($)
Table 29: Calcium Acetate Market By Application Industry, Revenue & Volume,By Water Treatment, 2021-2026 ($)
Table 30: Calcium Acetate Market By Application Industry, Revenue & Volume,By Construction, 2021-2026 ($)
Table 31: North America Calcium Acetate Market, Revenue & Volume,By Application Industry, 2021-2026 ($)
Table 32: South america Calcium Acetate Market, Revenue & Volume,By Application Industry, 2021-2026 ($)
Table 33: Europe Calcium Acetate Market, Revenue & Volume,By Application Industry, 2021-2026 ($)
Table 34: APAC Calcium Acetate Market, Revenue & Volume,By Application Industry, 2021-2026 ($)
Table 35: Middle East & Africa Calcium Acetate Market, Revenue & Volume,By Application Industry, 2021-2026 ($)
Table 36: Russia Calcium Acetate Market, Revenue & Volume,By Application Industry, 2021-2026 ($)
Table 37: Israel Calcium Acetate Market, Revenue & Volume,By Application Industry, 2021-2026 ($)
Table 38: Top Companies 2018 (US$)Calcium Acetate Market, Revenue & Volume
Table 39: Product Launch 2018-2019Calcium Acetate Market, Revenue & Volume
Table 40: Mergers & Acquistions 2018-2019Calcium Acetate Market, Revenue & Volume
List of Figures
Figure 1: Overview of Calcium Acetate Market 2021-2026
Figure 2: Market Share Analysis for Calcium Acetate Market 2018 (US$)
Figure 3: Product Comparison in Calcium Acetate Market 2018-2019 (US$)
Figure 4: End User Profile for Calcium Acetate Market 2018-2019 (US$)
Figure 5: Patent Application and Grant in Calcium Acetate Market 2013-2018* (US$)
Figure 6: Top 5 Companies Financial Analysis in Calcium Acetate Market 2018-2019 (US$)
Figure 7: Market Entry Strategy in Calcium Acetate Market 2018-2019
Figure 8: Ecosystem Analysis in Calcium Acetate Market 2018
Figure 9: Average Selling Price in Calcium Acetate Market 2021-2026
Figure 10: Top Opportunites in Calcium Acetate Market 2018-2019
Figure 11: Market Life Cycle Analysis in Calcium Acetate Market
Figure 12: GlobalBy Application IndustryCalcium Acetate Market Revenue, 2021-2026 ($)
Figure 13: Global Calcium Acetate Market - By Geography
Figure 14: Global Calcium Acetate Market Value & Volume, By Geography, 2021-2026 ($)
Figure 15: Global Calcium Acetate Market CAGR, By Geography, 2021-2026 (%)
Figure 16: North America Calcium Acetate Market Value & Volume, 2021-2026 ($)
Figure 17: US Calcium Acetate Market Value & Volume, 2021-2026 ($)
Figure 18: US GDP and Population, 2018-2019 ($)
Figure 19: US GDP – Composition of 2018, By Sector of Origin
Figure 20: US Export and Import Value & Volume, 2018-2019 ($)
Figure 21: Canada Calcium Acetate Market Value & Volume, 2021-2026 ($)
Figure 22: Canada GDP and Population, 2018-2019 ($)
Figure 23: Canada GDP – Composition of 2018, By Sector of Origin
Figure 24: Canada Export and Import Value & Volume, 2018-2019 ($)
Figure 25: Mexico Calcium Acetate Market Value & Volume, 2021-2026 ($)
Figure 26: Mexico GDP and Population, 2018-2019 ($)
Figure 27: Mexico GDP – Composition of 2018, By Sector of Origin
Figure 28: Mexico Export and Import Value & Volume, 2018-2019 ($)
Figure 29: South America Calcium Acetate Market Value & Volume, 2021-2026 ($)
Figure 30: Brazil Calcium Acetate Market Value & Volume, 2021-2026 ($)
Figure 31: Brazil GDP and Population, 2018-2019 ($)
Figure 32: Brazil GDP – Composition of 2018, By Sector of Origin
Figure 33: Brazil Export and Import Value & Volume, 2018-2019 ($)
Figure 34: Venezuela Calcium Acetate Market Value & Volume, 2021-2026 ($)
Figure 35: Venezuela GDP and Population, 2018-2019 ($)
Figure 36: Venezuela GDP – Composition of 2018, By Sector of Origin
Figure 37: Venezuela Export and Import Value & Volume, 2018-2019 ($)
Figure 38: Argentina Calcium Acetate Market Value & Volume, 2021-2026 ($)
Figure 39: Argentina GDP and Population, 2018-2019 ($)
Figure 40: Argentina GDP – Composition of 2018, By Sector of Origin
Figure 41: Argentina Export and Import Value & Volume, 2018-2019 ($)
Figure 42: Ecuador Calcium Acetate Market Value & Volume, 2021-2026 ($)
Figure 43: Ecuador GDP and Population, 2018-2019 ($)
Figure 44: Ecuador GDP – Composition of 2018, By Sector of Origin
Figure 45: Ecuador Export and Import Value & Volume, 2018-2019 ($)
Figure 46: Peru Calcium Acetate Market Value & Volume, 2021-2026 ($)
Figure 47: Peru GDP and Population, 2018-2019 ($)
Figure 48: Peru GDP – Composition of 2018, By Sector of Origin
Figure 49: Peru Export and Import Value & Volume, 2018-2019 ($)
Figure 50: Colombia Calcium Acetate Market Value & Volume, 2021-2026 ($)
Figure 51: Colombia GDP and Population, 2018-2019 ($)
Figure 52: Colombia GDP – Composition of 2018, By Sector of Origin
Figure 53: Colombia Export and Import Value & Volume, 2018-2019 ($)
Figure 54: Costa Rica Calcium Acetate Market Value & Volume, 2021-2026 ($)
Figure 55: Costa Rica GDP and Population, 2018-2019 ($)
Figure 56: Costa Rica GDP – Composition of 2018, By Sector of Origin
Figure 57: Costa Rica Export and Import Value & Volume, 2018-2019 ($)
Figure 58: Europe Calcium Acetate Market Value & Volume, 2021-2026 ($)
Figure 59: U.K Calcium Acetate Market Value & Volume, 2021-2026 ($)
Figure 60: U.K GDP and Population, 2018-2019 ($)
Figure 61: U.K GDP – Composition of 2018, By Sector of Origin
Figure 62: U.K Export and Import Value & Volume, 2018-2019 ($)
Figure 63: Germany Calcium Acetate Market Value & Volume, 2021-2026 ($)
Figure 64: Germany GDP and Population, 2018-2019 ($)
Figure 65: Germany GDP – Composition of 2018, By Sector of Origin
Figure 66: Germany Export and Import Value & Volume, 2018-2019 ($)
Figure 67: Italy Calcium Acetate Market Value & Volume, 2021-2026 ($)
Figure 68: Italy GDP and Population, 2018-2019 ($)
Figure 69: Italy GDP – Composition of 2018, By Sector of Origin
Figure 70: Italy Export and Import Value & Volume, 2018-2019 ($)
Figure 71: France Calcium Acetate Market Value & Volume, 2021-2026 ($)
Figure 72: France GDP and Population, 2018-2019 ($)
Figure 73: France GDP – Composition of 2018, By Sector of Origin
Figure 74: France Export and Import Value & Volume, 2018-2019 ($)
Figure 75: Netherlands Calcium Acetate Market Value & Volume, 2021-2026 ($)
Figure 76: Netherlands GDP and Population, 2018-2019 ($)
Figure 77: Netherlands GDP – Composition of 2018, By Sector of Origin
Figure 78: Netherlands Export and Import Value & Volume, 2018-2019 ($)
Figure 79: Belgium Calcium Acetate Market Value & Volume, 2021-2026 ($)
Figure 80: Belgium GDP and Population, 2018-2019 ($)
Figure 81: Belgium GDP – Composition of 2018, By Sector of Origin
Figure 82: Belgium Export and Import Value & Volume, 2018-2019 ($)
Figure 83: Spain Calcium Acetate Market Value & Volume, 2021-2026 ($)
Figure 84: Spain GDP and Population, 2018-2019 ($)
Figure 85: Spain GDP – Composition of 2018, By Sector of Origin
Figure 86: Spain Export and Import Value & Volume, 2018-2019 ($)
Figure 87: Denmark Calcium Acetate Market Value & Volume, 2021-2026 ($)
Figure 88: Denmark GDP and Population, 2018-2019 ($)
Figure 89: Denmark GDP – Composition of 2018, By Sector of Origin
Figure 90: Denmark Export and Import Value & Volume, 2018-2019 ($)
Figure 91: APAC Calcium Acetate Market Value & Volume, 2021-2026 ($)
Figure 92: China Calcium Acetate Market Value & Volume, 2021-2026
Figure 93: China GDP and Population, 2018-2019 ($)
Figure 94: China GDP – Composition of 2018, By Sector of Origin
Figure 95: China Export and Import Value & Volume, 2018-2019 ($)Calcium Acetate Market China Export and Import Value & Volume, 2018-2019 ($)
Figure 96: Australia Calcium Acetate Market Value & Volume, 2021-2026 ($)
Figure 97: Australia GDP and Population, 2018-2019 ($)
Figure 98: Australia GDP – Composition of 2018, By Sector of Origin
Figure 99: Australia Export and Import Value & Volume, 2018-2019 ($)
Figure 100: South Korea Calcium Acetate Market Value & Volume, 2021-2026 ($)
Figure 101: South Korea GDP and Population, 2018-2019 ($)
Figure 102: South Korea GDP – Composition of 2018, By Sector of Origin
Figure 103: South Korea Export and Import Value & Volume, 2018-2019 ($)
Figure 104: India Calcium Acetate Market Value & Volume, 2021-2026 ($)
Figure 105: India GDP and Population, 2018-2019 ($)
Figure 106: India GDP – Composition of 2018, By Sector of Origin
Figure 107: India Export and Import Value & Volume, 2018-2019 ($)
Figure 108: Taiwan Calcium Acetate Market Value & Volume, 2021-2026 ($)
Figure 109: Taiwan GDP and Population, 2018-2019 ($)
Figure 110: Taiwan GDP – Composition of 2018, By Sector of Origin
Figure 111: Taiwan Export and Import Value & Volume, 2018-2019 ($)
Figure 112: Malaysia Calcium Acetate Market Value & Volume, 2021-2026 ($)
Figure 113: Malaysia GDP and Population, 2018-2019 ($)
Figure 114: Malaysia GDP – Composition of 2018, By Sector of Origin
Figure 115: Malaysia Export and Import Value & Volume, 2018-2019 ($)
Figure 116: Hong Kong Calcium Acetate Market Value & Volume, 2021-2026 ($)
Figure 117: Hong Kong GDP and Population, 2018-2019 ($)
Figure 118: Hong Kong GDP – Composition of 2018, By Sector of Origin
Figure 119: Hong Kong Export and Import Value & Volume, 2018-2019 ($)
Figure 120: Middle East & Africa Calcium Acetate Market Middle East & Africa 3D Printing Market Value & Volume, 2021-2026 ($)
Figure 121: Russia Calcium Acetate Market Value & Volume, 2021-2026 ($)
Figure 122: Russia GDP and Population, 2018-2019 ($)
Figure 123: Russia GDP – Composition of 2018, By Sector of Origin
Figure 124: Russia Export and Import Value & Volume, 2018-2019 ($)
Figure 125: Israel Calcium Acetate Market Value & Volume, 2021-2026 ($)
Figure 126: Israel GDP and Population, 2018-2019 ($)
Figure 127: Israel GDP – Composition of 2018, By Sector of Origin
Figure 128: Israel Export and Import Value & Volume, 2018-2019 ($)
Figure 129: Entropy Share, By Strategies, 2018-2019* (%)Calcium Acetate Market
Figure 130: Developments, 2018-2019*Calcium Acetate Market
Figure 131: Company 1 Calcium Acetate Market Net Revenue, By Years, 2018-2019* ($)
Figure 132: Company 1 Calcium Acetate Market Net Revenue Share, By Business segments, 2018 (%)
Figure 133: Company 1 Calcium Acetate Market Net Sales Share, By Geography, 2018 (%)
Figure 134: Company 2 Calcium Acetate Market Net Revenue, By Years, 2018-2019* ($)
Figure 135: Company 2 Calcium Acetate Market Net Revenue Share, By Business segments, 2018 (%)
Figure 136: Company 2 Calcium Acetate Market Net Sales Share, By Geography, 2018 (%)
Figure 137: Company 3Calcium Acetate Market Net Revenue, By Years, 2018-2019* ($)
Figure 138: Company 3Calcium Acetate Market Net Revenue Share, By Business segments, 2018 (%)
Figure 139: Company 3Calcium Acetate Market Net Sales Share, By Geography, 2018 (%)
Figure 140: Company 4 Calcium Acetate Market Net Revenue, By Years, 2018-2019* ($)
Figure 141: Company 4 Calcium Acetate Market Net Revenue Share, By Business segments, 2018 (%)
Figure 142: Company 4 Calcium Acetate Market Net Sales Share, By Geography, 2018 (%)
Figure 143: Company 5 Calcium Acetate Market Net Revenue, By Years, 2018-2019* ($)
Figure 144: Company 5 Calcium Acetate Market Net Revenue Share, By Business segments, 2018 (%)
Figure 145: Company 5 Calcium Acetate Market Net Sales Share, By Geography, 2018 (%)
Figure 146: Company 6 Calcium Acetate Market Net Revenue, By Years, 2018-2019* ($)
Figure 147: Company 6 Calcium Acetate Market Net Revenue Share, By Business segments, 2018 (%)
Figure 148: Company 6 Calcium Acetate Market Net Sales Share, By Geography, 2018 (%)
Figure 149: Company 7 Calcium Acetate Market Net Revenue, By Years, 2018-2019* ($)
Figure 150: Company 7 Calcium Acetate Market Net Revenue Share, By Business segments, 2018 (%)
Figure 151: Company 7 Calcium Acetate Market Net Sales Share, By Geography, 2018 (%)
Figure 152: Company 8 Calcium Acetate Market Net Revenue, By Years, 2018-2019* ($)
Figure 153: Company 8 Calcium Acetate Market Net Revenue Share, By Business segments, 2018 (%)
Figure 154: Company 8 Calcium Acetate Market Net Sales Share, By Geography, 2018 (%)
Figure 155: Company 9 Calcium Acetate Market Net Revenue, By Years, 2018-2019* ($)
Figure 156: Company 9 Calcium Acetate Market Net Revenue Share, By Business segments, 2018 (%)
Figure 157: Company 9 Calcium Acetate Market Net Sales Share, By Geography, 2018 (%)
Figure 158: Company 10 Calcium Acetate Market Net Revenue, By Years, 2018-2019* ($)
Figure 159: Company 10 Calcium Acetate Market Net Revenue Share, By Business segments, 2018 (%)
Figure 160: Company 10 Calcium Acetate Market Net Sales Share, By Geography, 2018 (%)
Figure 161: Company 11 Calcium Acetate Market Net Revenue, By Years, 2018-2019* ($)
Figure 162: Company 11 Calcium Acetate Market Net Revenue Share, By Business segments, 2018 (%)
Figure 163: Company 11 Calcium Acetate Market Net Sales Share, By Geography, 2018 (%)
Figure 164: Company 12 Calcium Acetate Market Net Revenue, By Years, 2018-2019* ($)
Figure 165: Company 12 Calcium Acetate Market Net Revenue Share, By Business segments, 2018 (%)
Figure 166: Company 12 Calcium Acetate Market Net Sales Share, By Geography, 2018 (%)
Figure 167: Company 13Calcium Acetate Market Net Revenue, By Years, 2018-2019* ($)
Figure 168: Company 13Calcium Acetate Market Net Revenue Share, By Business segments, 2018 (%)
Figure 169: Company 13Calcium Acetate Market Net Sales Share, By Geography, 2018 (%)
Figure 170: Company 14 Calcium Acetate Market Net Revenue, By Years, 2018-2019* ($)
Figure 171: Company 14 Calcium Acetate Market Net Revenue Share, By Business segments, 2018 (%)
Figure 172: Company 14 Calcium Acetate Market Net Sales Share, By Geography, 2018 (%)
Figure 173: Company 15 Calcium Acetate Market Net Revenue, By Years, 2018-2019* ($)
Figure 174: Company 15 Calcium Acetate Market Net Revenue Share, By Business segments, 2018 (%)
Figure 175: Company 15 Calcium Acetate Market Net Sales Share, By Geography, 2018 (%)