 Email
Email Print
Print


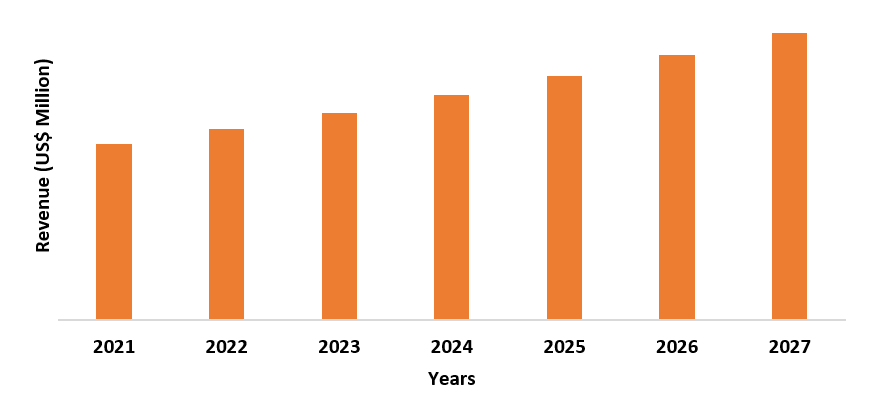
Calcium Propionate Market Overview
The Calcium Propionate Market size is estimated
to reach US$227 million by 2027, after growing at a CAGR of 5.84% during the
forecast period 2022-2027. Calcium propionate is an organic calcium salt that
is formed when calcium hydroxide reacts with propanoic acid. Calcium propionate is majorly utilized as a food
preservative due to its high shelf life feature and antifungal properties,
thereby having flourishing demand in the food and beverage industry. In addition, established demand across major
industries such as personal care & cosmetics, animal feed, pharmaceuticals
and others acts as a driving factor in the calcium propionate industry. In
addition, the flourishing trend for processed and frozen food items, majorly
bakery and processed meat are fueling the growth prospects for the calcium
propionate industry. The covid-19 outbreak resulted in major disruption in the calcium
propionate market due to the closure of various food outlets and halt in food
production units, supply chain disruption and other lockdown restrictions.
However, significant recovery in major end-use sectors such as personal care
& cosmetics, food & beverage and other industries post-pandemic are
boosting the demand for the calcium propionate market. Thus, the calcium propionate
industry is anticipated to grow rapidly and contribute to the calcium
propionate market size during the forecast period.
Calcium Propionate Market Report Coverage
The “Calcium
Propionate Market Report – Forecast (2022-2027)” by IndustryARC, covers an
in-depth analysis of the following segments in the Calcium Propionate Industry.
By Form: Liquid and Dry.
By Application: Frozen Food, Bread, Flavored Milk, Processed Meat,
Feed Supplement, Toothpaste, Shampoo, Topical Antifungal Agent and Others.
By
End-Use Industry: Food & Beverages (Dairy, Sports
Drinks, Poultry, Bakery and Others), Personal Care & Cosmetics (Face Care,
Body Care, Hair Care and Others), Pharmaceuticals, Animal Feed and Others.
By
Geography: North America (the USA, Canada and Mexico),
Europe (UK, Germany, France, Italy, Netherlands, Spain, Belgium and Rest of
Europe), Asia-Pacific (China, Japan, India, South Korea, Australia and New
Zealand, Indonesia, Taiwan, Malaysia and Rest of APAC), South America (Brazil,
Argentina, Colombia, Chile and Rest of South America), Rest of the World [Middle-East (Saudi Arabia, UAE, Israel and Rest of the Middle-East) and Africa (South Africa, Nigeria and Rest of Africa)]
Key Takeaways
- North America dominates the Calcium Propionate Market owing to growth factors such as the growing food & beverage sector, developed pharmaceutical sector and urbanization, thereby boosting growth in this region.
- The flourishing food & beverage industry across the world is propelling the demand for calcium propionate for various applications as a food preservative in bakeries, processed meat, dairy, flavored drinks, cheese and others, thereby contributing to the growing calcium propionate market size.
- The demand for dry calcium propionate is growing rapidly compared to liquid form due to ease in mixing and dispersion in food, thereby having major dominance during the forecast period.
- However, the availability of substitutes such as sodium propionate and rising concerns for food safety act as a challenging factor in the calcium propionate industry.
Calcium Propionate Market Segment Analysis – by Form
The dry segment held a significant Calcium
Propionate Market share in 2021 and is forecasted to grow at a CAGR of 5.8% during
the forecast period 2022-2027. The demand for the dry form of calcium
propionate is high over the liquid form due to comparatively easier mixing
property and better dispersion throughout the food matrix. The dry form offers
enhanced shelf life and improves the flavor, thereby has flourishing
applicability in a wide range of food items including confectioneries, bread,
flavored drinks, sauces and others. Thus, with increasing utilization of dry
form and high performance in the food & beverage sector, the dry segment is
projected to grow exponentially in the calcium propionate industry during the
forecast period.
Calcium Propionate Market Segment Analysis – by End-use Industry
The food & beverage segment held a
significant Calcium Propionate Market
share in 2021 and is forecasted to grow at a CAGR of 5.7% during the forecast
period 2022-2027. The demand for calcium propionate is high in the food and
beverage industry for a wide range of applicability in dairy, bakery, processed
meat, flavored milk, confectioneries and others due to its extended shelf life
feature and preservation properties. The
food and beverage sector is significantly growing owing to growth factors such
as high demand for ready-to-eat food items and rising production for dairy,
meat, fruits and vegetables and others. For
instance, according to the Food and Agriculture
Organization, the Asian region had around 136.06 million metric tons of meat
produced in 2019 and is expected to increase to 12% by 2029 around the world.
According to India Brand Equity Foundation (IBEF), the food processing sector
in India is expected to reach US$535 billion by the year 2025-26. With the
increase in consumption of processed food items, the applicability of calcium
propionate for food preservatives and extending shelf life is rising, which, in
turn, is anticipated to boost the growth prospects for the food & beverage
sector in the calcium propionate market during the forecast period.
Calcium Propionate Market Segment Analysis – by Geography
North America held the largest Calcium Propionate Market share in 2021 up to 38%. The robust growth scope of calcium propionate in this region is influenced by fast-paced growth in the food & beverage and pharmaceutical sector, rising revenues in the processed and packaged food segment and rising income levels. The food & beverage industry in North America is rapidly growing owing to factors such as growing consumption of packaged and processed food items, majorly bakery and preference for instant or ready-to-eat items and a growing manufacturing base. For instance, According to Food & Drink Federation, food & beverage in the UK contributed US$35.60 billion to the economy and marked a growth of 4.3% in 2021 compared to 2020. According to Food Export, packaged foods in Mexico totaled US$54.8 billion in 2020. Moreover, the sale of packaged food is projected to reach US$75 billion in Mexico by 2025, showing a growth of 28.5%. With the fast-paced production and consumption of processed and packaged food & beverage sector, the applicability of calcium propionate for various items such as bread, cheese, processed meat and others is rising, which, in turn, is projected to boost the growth scope for calcium propionate in the North America region and contribute majorly in the calcium propionate market size during the forecast period.
Calcium Propionate Market Drivers
Rapid Growth of Personal Care & Cosmetics Sector:
Calcium Propionate has flourishing
applications in the personal care & cosmetics sector for shampoo, creams,
toothpaste and others for preservation. The robust growth in the cosmetics and
personal industry is influenced by the rise in luxury and premium beauty
production, demand for color cosmetics and lifestyle trends. For instance,
according to the International Trade Administration (ITA), the beauty and
personal care sector in Thailand increased from US$6.2 billion in 2018 to US$8.0
billion in 2022, marking a projected growth rate of 7.8% from 2019 to 2022. Furthermore,
according to L’OREAL Annual Report 2021, the beauty sector of L’OREAL rose by
8.2% in the year 2021, after a sharp decline of 8% in 2020. With the increasing
production and consumption of cosmetics & personal care, the demand for calcium
propionate in hair care, cosmetics items and others is rising, which, in turn,
is boosting its applicability and driving the calcium propionate industry.
Flourishing Growth of the Pharmaceutical Industry:
Calcium Propionate has flourishing demand in
the pharmaceutical sector as an anti-microbial and anti-fungal treatment
medication. The
lucrative growth in the pharmaceutical industry is due to factors such as high
spending on drugs, growing healthcare infrastructure and a high rate of chronic
health incidents. For instance, according to the India Brand Equity
Foundation (IBEF), the Indian pharmaceuticals sector is expected to reach US$65
billion by 2024 and further expand to US$120-130 billion by the year 2030. According to the International Trade
Administration, the worldwide pharmaceuticals market was estimated to grow from
US$ 1 trillion in 2015 to US$1.3 trillion by 2020. With the increasing
pharmaceutical production and medication utilization, the applicability of
calcium propionate for fungal medication and treatment is also growing, which,
in turn, is driving the calcium propionate industry.
Calcium Propionate Market Challenge
Availability of Substitutes and Rising Concerns:
The availability of substitutes for Calcium
Propionate such as sodium propionate hinders the growth prospect in the calcium
propionate industry. The sodium version of propanoic acid is increasingly used
as a food preservative, which acts as a major competition for calcium
propionate. Moreover, the strict regulations regarding food safety and shelf-life
are other growth restraining factors. For instance, as per federal regulations,
calcium propionate increases the pH of the food by 0.1 to 0.5 pH units depending
on product type and quantity. Various government authorities have specified
usage levels for propanoic acid. Thus, owing to such factors, the demand and
applicability of calcium propionate face a slowdown, which creates a major
challenge in the calcium propionate market.
Calcium Propionate Industry Outlook
Technology launches, acquisitions and R&D
activities are key strategies adopted by players in the Calcium Propionate Market.
The top 10 companies in the Calcium Propionate Market are:
- Perstorp Holdings AB
- Macco Organiques Inc.
- AB Mauri
- Kemira
- Niacet Corporation
- Addcon GmbH
- Krishna Chemicals
- A.M. Food Chemicals Co. Ltd.
- Impextraco NV
- Calpro Specialities
Relevant Reports
Report Code: CMR 15434
Report Code: FBR 83887
Report Code: CMR 0342
For more Chemicals and Materials Market reports, please click her
Table 1: Calcium Propionate Market Overview 2021-2026
Table 2: Calcium Propionate Market Leader Analysis 2018-2019 (US$)
Table 3: Calcium Propionate Market Product Analysis 2018-2019 (US$)
Table 4: Calcium Propionate Market End User Analysis 2018-2019 (US$)
Table 5: Calcium Propionate Market Patent Analysis 2013-2018* (US$)
Table 6: Calcium Propionate Market Financial Analysis 2018-2019 (US$)
Table 7: Calcium Propionate Market Driver Analysis 2018-2019 (US$)
Table 8: Calcium Propionate Market Challenges Analysis 2018-2019 (US$)
Table 9: Calcium Propionate Market Constraint Analysis 2018-2019 (US$)
Table 10: Calcium Propionate Market Supplier Bargaining Power Analysis 2018-2019 (US$)
Table 11: Calcium Propionate Market Buyer Bargaining Power Analysis 2018-2019 (US$)
Table 12: Calcium Propionate Market Threat of Substitutes Analysis 2018-2019 (US$)
Table 13: Calcium Propionate Market Threat of New Entrants Analysis 2018-2019 (US$)
Table 14: Calcium Propionate Market Degree of Competition Analysis 2018-2019 (US$)
Table 15: Calcium Propionate Market Value Chain Analysis 2018-2019 (US$)
Table 16: Calcium Propionate Market Pricing Analysis 2021-2026 (US$)
Table 17: Calcium Propionate Market Opportunities Analysis 2021-2026 (US$)
Table 18: Calcium Propionate Market Product Life Cycle Analysis 2021-2026 (US$)
Table 19: Calcium Propionate Market Supplier Analysis 2018-2019 (US$)
Table 20: Calcium Propionate Market Distributor Analysis 2018-2019 (US$)
Table 21: Calcium Propionate Market Trend Analysis 2018-2019 (US$)
Table 22: Calcium Propionate Market Size 2018 (US$)
Table 23: Calcium Propionate Market Forecast Analysis 2021-2026 (US$)
Table 24: Calcium Propionate Market Sales Forecast Analysis 2021-2026 (Units)
Table 25: Calcium Propionate Market , Revenue & Volume,By Application, 2021-2026 ($)
Table 26: Calcium Propionate Market By Application, Revenue & Volume,By Bakery, 2021-2026 ($)
Table 27: Calcium Propionate Market By Application, Revenue & Volume,By Dairy, 2021-2026 ($)
Table 28: Calcium Propionate Market By Application, Revenue & Volume,By Animal Feed, 2021-2026 ($)
Table 29: Calcium Propionate Market By Application, Revenue & Volume,By Meat Processing, 2021-2026 ($)
Table 30: Calcium Propionate Market By Application, Revenue & Volume,By Packaged Food Products, 2021-2026 ($)
Table 31: North America Calcium Propionate Market , Revenue & Volume,By Application, 2021-2026 ($)
Table 32: South america Calcium Propionate Market , Revenue & Volume,By Application, 2021-2026 ($)
Table 33: Europe Calcium Propionate Market , Revenue & Volume,By Application, 2021-2026 ($)
Table 34: APAC Calcium Propionate Market , Revenue & Volume,By Application, 2021-2026 ($)
Table 35: Middle East & Africa Calcium Propionate Market , Revenue & Volume,By Application, 2021-2026 ($)
Table 36: Russia Calcium Propionate Market , Revenue & Volume,By Application, 2021-2026 ($)
Table 37: Israel Calcium Propionate Market , Revenue & Volume,By Application, 2021-2026 ($)
Table 38: Top Companies 2018 (US$)Calcium Propionate Market , Revenue & Volume
Table 39: Product Launch 2018-2019Calcium Propionate Market , Revenue & Volume
Table 40: Mergers & Acquistions 2018-2019Calcium Propionate Market , Revenue & Volume
List of Figures
Figure 1: Overview of Calcium Propionate Market 2021-2026
Figure 2: Market Share Analysis for Calcium Propionate Market 2018 (US$)
Figure 3: Product Comparison in Calcium Propionate Market 2018-2019 (US$)
Figure 4: End User Profile for Calcium Propionate Market 2018-2019 (US$)
Figure 5: Patent Application and Grant in Calcium Propionate Market 2013-2018* (US$)
Figure 6: Top 5 Companies Financial Analysis in Calcium Propionate Market 2018-2019 (US$)
Figure 7: Market Entry Strategy in Calcium Propionate Market 2018-2019
Figure 8: Ecosystem Analysis in Calcium Propionate Market 2018
Figure 9: Average Selling Price in Calcium Propionate Market 2021-2026
Figure 10: Top Opportunites in Calcium Propionate Market 2018-2019
Figure 11: Market Life Cycle Analysis in Calcium Propionate Market
Figure 12: GlobalBy ApplicationCalcium Propionate Market Revenue, 2021-2026 ($)
Figure 13: Global Calcium Propionate Market - By Geography
Figure 14: Global Calcium Propionate Market Value & Volume, By Geography, 2021-2026 ($)
Figure 15: Global Calcium Propionate Market CAGR, By Geography, 2021-2026 (%)
Figure 16: North America Calcium Propionate Market Value & Volume, 2021-2026 ($)
Figure 17: US Calcium Propionate Market Value & Volume, 2021-2026 ($)
Figure 18: US GDP and Population, 2018-2019 ($)
Figure 19: US GDP – Composition of 2018, By Sector of Origin
Figure 20: US Export and Import Value & Volume, 2018-2019 ($)
Figure 21: Canada Calcium Propionate Market Value & Volume, 2021-2026 ($)
Figure 22: Canada GDP and Population, 2018-2019 ($)
Figure 23: Canada GDP – Composition of 2018, By Sector of Origin
Figure 24: Canada Export and Import Value & Volume, 2018-2019 ($)
Figure 25: Mexico Calcium Propionate Market Value & Volume, 2021-2026 ($)
Figure 26: Mexico GDP and Population, 2018-2019 ($)
Figure 27: Mexico GDP – Composition of 2018, By Sector of Origin
Figure 28: Mexico Export and Import Value & Volume, 2018-2019 ($)
Figure 29: South America Calcium Propionate Market Value & Volume, 2021-2026 ($)
Figure 30: Brazil Calcium Propionate Market Value & Volume, 2021-2026 ($)
Figure 31: Brazil GDP and Population, 2018-2019 ($)
Figure 32: Brazil GDP – Composition of 2018, By Sector of Origin
Figure 33: Brazil Export and Import Value & Volume, 2018-2019 ($)
Figure 34: Venezuela Calcium Propionate Market Value & Volume, 2021-2026 ($)
Figure 35: Venezuela GDP and Population, 2018-2019 ($)
Figure 36: Venezuela GDP – Composition of 2018, By Sector of Origin
Figure 37: Venezuela Export and Import Value & Volume, 2018-2019 ($)
Figure 38: Argentina Calcium Propionate Market Value & Volume, 2021-2026 ($)
Figure 39: Argentina GDP and Population, 2018-2019 ($)
Figure 40: Argentina GDP – Composition of 2018, By Sector of Origin
Figure 41: Argentina Export and Import Value & Volume, 2018-2019 ($)
Figure 42: Ecuador Calcium Propionate Market Value & Volume, 2021-2026 ($)
Figure 43: Ecuador GDP and Population, 2018-2019 ($)
Figure 44: Ecuador GDP – Composition of 2018, By Sector of Origin
Figure 45: Ecuador Export and Import Value & Volume, 2018-2019 ($)
Figure 46: Peru Calcium Propionate Market Value & Volume, 2021-2026 ($)
Figure 47: Peru GDP and Population, 2018-2019 ($)
Figure 48: Peru GDP – Composition of 2018, By Sector of Origin
Figure 49: Peru Export and Import Value & Volume, 2018-2019 ($)
Figure 50: Colombia Calcium Propionate Market Value & Volume, 2021-2026 ($)
Figure 51: Colombia GDP and Population, 2018-2019 ($)
Figure 52: Colombia GDP – Composition of 2018, By Sector of Origin
Figure 53: Colombia Export and Import Value & Volume, 2018-2019 ($)
Figure 54: Costa Rica Calcium Propionate Market Value & Volume, 2021-2026 ($)
Figure 55: Costa Rica GDP and Population, 2018-2019 ($)
Figure 56: Costa Rica GDP – Composition of 2018, By Sector of Origin
Figure 57: Costa Rica Export and Import Value & Volume, 2018-2019 ($)
Figure 58: Europe Calcium Propionate Market Value & Volume, 2021-2026 ($)
Figure 59: U.K Calcium Propionate Market Value & Volume, 2021-2026 ($)
Figure 60: U.K GDP and Population, 2018-2019 ($)
Figure 61: U.K GDP – Composition of 2018, By Sector of Origin
Figure 62: U.K Export and Import Value & Volume, 2018-2019 ($)
Figure 63: Germany Calcium Propionate Market Value & Volume, 2021-2026 ($)
Figure 64: Germany GDP and Population, 2018-2019 ($)
Figure 65: Germany GDP – Composition of 2018, By Sector of Origin
Figure 66: Germany Export and Import Value & Volume, 2018-2019 ($)
Figure 67: Italy Calcium Propionate Market Value & Volume, 2021-2026 ($)
Figure 68: Italy GDP and Population, 2018-2019 ($)
Figure 69: Italy GDP – Composition of 2018, By Sector of Origin
Figure 70: Italy Export and Import Value & Volume, 2018-2019 ($)
Figure 71: France Calcium Propionate Market Value & Volume, 2021-2026 ($)
Figure 72: France GDP and Population, 2018-2019 ($)
Figure 73: France GDP – Composition of 2018, By Sector of Origin
Figure 74: France Export and Import Value & Volume, 2018-2019 ($)
Figure 75: Netherlands Calcium Propionate Market Value & Volume, 2021-2026 ($)
Figure 76: Netherlands GDP and Population, 2018-2019 ($)
Figure 77: Netherlands GDP – Composition of 2018, By Sector of Origin
Figure 78: Netherlands Export and Import Value & Volume, 2018-2019 ($)
Figure 79: Belgium Calcium Propionate Market Value & Volume, 2021-2026 ($)
Figure 80: Belgium GDP and Population, 2018-2019 ($)
Figure 81: Belgium GDP – Composition of 2018, By Sector of Origin
Figure 82: Belgium Export and Import Value & Volume, 2018-2019 ($)
Figure 83: Spain Calcium Propionate Market Value & Volume, 2021-2026 ($)
Figure 84: Spain GDP and Population, 2018-2019 ($)
Figure 85: Spain GDP – Composition of 2018, By Sector of Origin
Figure 86: Spain Export and Import Value & Volume, 2018-2019 ($)
Figure 87: Denmark Calcium Propionate Market Value & Volume, 2021-2026 ($)
Figure 88: Denmark GDP and Population, 2018-2019 ($)
Figure 89: Denmark GDP – Composition of 2018, By Sector of Origin
Figure 90: Denmark Export and Import Value & Volume, 2018-2019 ($)
Figure 91: APAC Calcium Propionate Market Value & Volume, 2021-2026 ($)
Figure 92: China Calcium Propionate Market Value & Volume, 2021-2026
Figure 93: China GDP and Population, 2018-2019 ($)
Figure 94: China GDP – Composition of 2018, By Sector of Origin
Figure 95: China Export and Import Value & Volume, 2018-2019 ($)Calcium Propionate Market China Export and Import Value & Volume, 2018-2019 ($)
Figure 96: Australia Calcium Propionate Market Value & Volume, 2021-2026 ($)
Figure 97: Australia GDP and Population, 2018-2019 ($)
Figure 98: Australia GDP – Composition of 2018, By Sector of Origin
Figure 99: Australia Export and Import Value & Volume, 2018-2019 ($)
Figure 100: South Korea Calcium Propionate Market Value & Volume, 2021-2026 ($)
Figure 101: South Korea GDP and Population, 2018-2019 ($)
Figure 102: South Korea GDP – Composition of 2018, By Sector of Origin
Figure 103: South Korea Export and Import Value & Volume, 2018-2019 ($)
Figure 104: India Calcium Propionate Market Value & Volume, 2021-2026 ($)
Figure 105: India GDP and Population, 2018-2019 ($)
Figure 106: India GDP – Composition of 2018, By Sector of Origin
Figure 107: India Export and Import Value & Volume, 2018-2019 ($)
Figure 108: Taiwan Calcium Propionate Market Value & Volume, 2021-2026 ($)
Figure 109: Taiwan GDP and Population, 2018-2019 ($)
Figure 110: Taiwan GDP – Composition of 2018, By Sector of Origin
Figure 111: Taiwan Export and Import Value & Volume, 2018-2019 ($)
Figure 112: Malaysia Calcium Propionate Market Value & Volume, 2021-2026 ($)
Figure 113: Malaysia GDP and Population, 2018-2019 ($)
Figure 114: Malaysia GDP – Composition of 2018, By Sector of Origin
Figure 115: Malaysia Export and Import Value & Volume, 2018-2019 ($)
Figure 116: Hong Kong Calcium Propionate Market Value & Volume, 2021-2026 ($)
Figure 117: Hong Kong GDP and Population, 2018-2019 ($)
Figure 118: Hong Kong GDP – Composition of 2018, By Sector of Origin
Figure 119: Hong Kong Export and Import Value & Volume, 2018-2019 ($)
Figure 120: Middle East & Africa Calcium Propionate Market Middle East & Africa 3D Printing Market Value & Volume, 2021-2026 ($)
Figure 121: Russia Calcium Propionate Market Value & Volume, 2021-2026 ($)
Figure 122: Russia GDP and Population, 2018-2019 ($)
Figure 123: Russia GDP – Composition of 2018, By Sector of Origin
Figure 124: Russia Export and Import Value & Volume, 2018-2019 ($)
Figure 125: Israel Calcium Propionate Market Value & Volume, 2021-2026 ($)
Figure 126: Israel GDP and Population, 2018-2019 ($)
Figure 127: Israel GDP – Composition of 2018, By Sector of Origin
Figure 128: Israel Export and Import Value & Volume, 2018-2019 ($)
Figure 129: Entropy Share, By Strategies, 2018-2019* (%)Calcium Propionate Market
Figure 130: Developments, 2018-2019*Calcium Propionate Market
Figure 131: Company 1 Calcium Propionate Market Net Revenue, By Years, 2018-2019* ($)
Figure 132: Company 1 Calcium Propionate Market Net Revenue Share, By Business segments, 2018 (%)
Figure 133: Company 1 Calcium Propionate Market Net Sales Share, By Geography, 2018 (%)
Figure 134: Company 2 Calcium Propionate Market Net Revenue, By Years, 2018-2019* ($)
Figure 135: Company 2 Calcium Propionate Market Net Revenue Share, By Business segments, 2018 (%)
Figure 136: Company 2 Calcium Propionate Market Net Sales Share, By Geography, 2018 (%)
Figure 137: Company 3Calcium Propionate Market Net Revenue, By Years, 2018-2019* ($)
Figure 138: Company 3Calcium Propionate Market Net Revenue Share, By Business segments, 2018 (%)
Figure 139: Company 3Calcium Propionate Market Net Sales Share, By Geography, 2018 (%)
Figure 140: Company 4 Calcium Propionate Market Net Revenue, By Years, 2018-2019* ($)
Figure 141: Company 4 Calcium Propionate Market Net Revenue Share, By Business segments, 2018 (%)
Figure 142: Company 4 Calcium Propionate Market Net Sales Share, By Geography, 2018 (%)
Figure 143: Company 5 Calcium Propionate Market Net Revenue, By Years, 2018-2019* ($)
Figure 144: Company 5 Calcium Propionate Market Net Revenue Share, By Business segments, 2018 (%)
Figure 145: Company 5 Calcium Propionate Market Net Sales Share, By Geography, 2018 (%)
Figure 146: Company 6 Calcium Propionate Market Net Revenue, By Years, 2018-2019* ($)
Figure 147: Company 6 Calcium Propionate Market Net Revenue Share, By Business segments, 2018 (%)
Figure 148: Company 6 Calcium Propionate Market Net Sales Share, By Geography, 2018 (%)
Figure 149: Company 7 Calcium Propionate Market Net Revenue, By Years, 2018-2019* ($)
Figure 150: Company 7 Calcium Propionate Market Net Revenue Share, By Business segments, 2018 (%)
Figure 151: Company 7 Calcium Propionate Market Net Sales Share, By Geography, 2018 (%)
Figure 152: Company 8 Calcium Propionate Market Net Revenue, By Years, 2018-2019* ($)
Figure 153: Company 8 Calcium Propionate Market Net Revenue Share, By Business segments, 2018 (%)
Figure 154: Company 8 Calcium Propionate Market Net Sales Share, By Geography, 2018 (%)
Figure 155: Company 9 Calcium Propionate Market Net Revenue, By Years, 2018-2019* ($)
Figure 156: Company 9 Calcium Propionate Market Net Revenue Share, By Business segments, 2018 (%)
Figure 157: Company 9 Calcium Propionate Market Net Sales Share, By Geography, 2018 (%)
Figure 158: Company 10 Calcium Propionate Market Net Revenue, By Years, 2018-2019* ($)
Figure 159: Company 10 Calcium Propionate Market Net Revenue Share, By Business segments, 2018 (%)
Figure 160: Company 10 Calcium Propionate Market Net Sales Share, By Geography, 2018 (%)
Figure 161: Company 11 Calcium Propionate Market Net Revenue, By Years, 2018-2019* ($)
Figure 162: Company 11 Calcium Propionate Market Net Revenue Share, By Business segments, 2018 (%)
Figure 163: Company 11 Calcium Propionate Market Net Sales Share, By Geography, 2018 (%)
Figure 164: Company 12 Calcium Propionate Market Net Revenue, By Years, 2018-2019* ($)
Figure 165: Company 12 Calcium Propionate Market Net Revenue Share, By Business segments, 2018 (%)
Figure 166: Company 12 Calcium Propionate Market Net Sales Share, By Geography, 2018 (%)
Figure 167: Company 13Calcium Propionate Market Net Revenue, By Years, 2018-2019* ($)
Figure 168: Company 13Calcium Propionate Market Net Revenue Share, By Business segments, 2018 (%)
Figure 169: Company 13Calcium Propionate Market Net Sales Share, By Geography, 2018 (%)
Figure 170: Company 14 Calcium Propionate Market Net Revenue, By Years, 2018-2019* ($)
Figure 171: Company 14 Calcium Propionate Market Net Revenue Share, By Business segments, 2018 (%)
Figure 172: Company 14 Calcium Propionate Market Net Sales Share, By Geography, 2018 (%)
Figure 173: Company 15 Calcium Propionate Market Net Revenue, By Years, 2018-2019* ($)
Figure 174: Company 15 Calcium Propionate Market Net Revenue Share, By Business segments, 2018 (%)
Figure 175: Company 15 Calcium Propionate Market Net Sales Share, By Geography, 2018 (%)