Carbamate Insecticides Market - Forecast(2024 - 2030)

Report Code: CMR 0349 Report Format: PDF + Excel

Carbamate Insecticides Market Overview

The Carbamate Insecticides market size is forecasted to reach a value of US$341.6 million by the end of 2027 after growing at a CAGR of 4.5% during the forecast period 2022-2027. The carbamates are a group of insecticides that consists of compounds such as methiocarb, carbamyl, methomyl and carbofuran. It is used to kill and control pest infestation. The ease of access to insecticides, an increase in the awareness of health hazards caused due to insects and the eradication services are the key factors driving the market growth. Rapid urbanization and infrastructural developments in emerging economies are anticipated to drive the demand for carbamate insecticides in residential, commercial and industrial sectors. Moreover, the increasing requirement for carbamate insecticides in the agriculture industry is anticipated to upsurge the demand for the carbamate insecticides industry in the forecast period. The global economic downturn caused by the COVID-19 pandemic resulted in a huge drop in demand for plantation crops, floriculture and others, all across the world, which had a significant impact on the growth of the Carbamate Insecticides market size.

Carbamate Insecticides Market Report Coverage

The “Carbamate Insecticides Market Report – Forecast (2022 - 2027)” by Industry ARC, covers an in-depth analysis of the following segments in the Carbamate Insecticides industry.

By Type: Aldicarb, Oxamyl, Carbaryl, Methiocarb, Carbofuran, Methomyl, Thiodicarb and Others.
By Crop Type: Cash Crop (Rice, Cotton, Oilseeds, Soybean and Others), Food Crops (Wheat, Rice, Maize and Others), Horticulture Crops (Fruits, Orange, Apples, Grapes, Banana and Others), Vegetables (Tomato, Potato, Onions, Carrot and Others), Plantation Crops (Tea, Coffee and Others) and Others.
By Form: Baits, Sprays and Strips.
By End-use Industry: Agriculture, Forests, Building and Construction (Residential, Commercial, Industrial and Infrastructural) and Others.
By Geography: North America (the USA, Canada and Mexico), Europe (the UK, Germany, France, Italy, the Netherlands, Spain, Belgium and the Rest of Europe), Asia-Pacific (China, Japan, India, South Korea, Australia and New Zealand, Indonesia, Taiwan, Malaysia and the Rest of APAC), South America (Brazil, Argentina, Colombia, Chile and the Rest of South America) and the Rest of the World (the Middle East and Africa).

Key Takeaways

  • The Asia Pacific region dominates the Carbamate Insecticides market owing to the rising growth in the building & construction industry. According to the World Bank, in 2020, the building and construction industry reached about US$11.9 trillion, with an increase of about 4.2% from 2019.
  • Rapidly rising demand for Carbamate Insecticides to meet the growing demand for high-quality and quantity of crops has driven the growth of the Carbamate Insecticides market.
  • The increasing demand for Carbamate Insecticides in the agriculture sector, due to their usage to protect the crops from infectious diseases, has been a critical factor driving the growth of the market in the upcoming years.
  • However, increasing health hazards associated with the rising usage of carbamate insecticides can hinder the growth of the Carbamate Insecticides market.

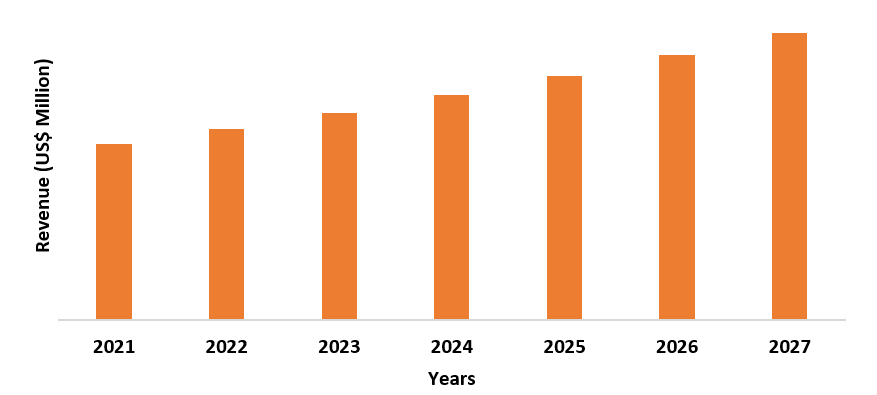
Figure: Asia-Pacific Carbamate Insecticides Market Revenue, 2021-2027 (US$ Million)

Carbamate Insecticides Marke

For More Details On this report - Request For Sample

Carbamate Insecticides Market Segment Analysis – by Crop Type

The horticulture crops segment held the largest Carbamate Insecticides Market share in 2021 and is anticipated to grow at a CAGR of 4.6% during the forecast period 2022-2027. Carbamate insecticides such as methiocarb, methomyl and carbofuran are mainly applied on horticulture crops as compared to other crops such as field and plantation crops, due to the growing demand for high-value crops among consumers. Moreover, horticulture crops are more susceptible to insects such as fruit flies, codling moths and peach-tree borers. The growing popularity of organic crop protection products has increased the demand for insecticides among farmers. The emerging trend of consuming organic and clean-label foods is expected to boost the utilization of horticulture crops. According to the Indian Brand Equity Foundation (IBEF), the Indian Organic Sector is forecasted to reach Rs75,000 crore (US$10.73 billion) by 2025 from Rs2,700 crore (US$386.32 million) in 2015. Thus, with the growing demand for horticulture crops, the market growth for Carbamate Insecticides would further rise over the forecast period.

Carbamate Insecticides Market Segment Analysis – by End-use Industry

The building & construction industry held the largest Carbamate Insecticides Market share in 2021 and is estimated to grow at a CAGR of 5.1% during the forecast period 2022-2027. In the building & construction industry, carbamate insecticides are utilized as sprays, baits or strips to kill insects and control pest infestation, by affecting their brains and nervous systems. These insecticides are applied in residential, commercial and infrastructural facilities to kill insects such as cockroaches, fleas, crickets, ants, aphids, scale, lace bugs, whitefly and mealy bugs. Some carbamates also control mosquitoes. According to the U.S Department of Commerce, the privately-owned housing units authorized by building permits in March 2022 were around 1,873,000, which was 0.4% above February 2022 of 1,865,000 units and was 6.7% above March 2021 of around 1,755,000 units. Moreover, according to Statistics of Japan, the number of construction contract orders went from 60,046,960 units in 2020 to 63,610,223 in 2021 and witnessed a growth in 2021 (Jan-July) compared to 2020(Jan-July). Thus, the growing building and construction industry would require more Carbamate Insecticides for controlling insects, which would drive the demand for carbamate insecticides market growth during the forecast period.

Carbamate Insecticides Market Segment Analysis – by Geography

The Asia-Pacific region dominated the Carbamate Insecticides Market share by 43% in the year 2021, due to the increasing requirement for carbamate insecticides in developing countries such as China, Japan, India and South Korea. China is expected to continue its dominance in the carbamate insecticides market during the forecast period. This is due to the growth in the building & construction industry throughout the country. According to International Trade Administration (ITA), China is the world’s largest construction market and is forecasted to grow at an annual average growth of 8.6% between 2022 and 2030. Also, according to the Australian Government, the building and construction sector remains healthy in Singapore, with strong government spending on public infrastructure, of about S$2 billion (US$1.43 billion) in contracts being awarded each month. Moreover, according to Invest India, by 2025, the building and construction industry is estimated to reach US$1.4 Trillion. Such increasing building & construction activities in the APAC countries are anticipated to increase the demand for Carbamate Insecticide products in the forecasted period and are proving to be a market booster for the Carbamate Insecticides market size in this region.

Carbamate Insecticides Market Drivers

Increasing High-Quality and Quantity of Crops:

Increasing population and income have led to rising demand for high quantity and quality crops. For instance, the world’s population is estimated to increase by 2 billion people in the next 30 years, from 7.7 billion in 2021 to 9.7 billion in 2050, according to the United Nations. Globally, farmers are increasing crop production, either by increasing the agricultural land to grow crops or by improving the production of crops on existing agricultural lands, by using fertilizer, insecticides, irrigation and adopting other new products. The rising demand for freshly produced, high-quality crops has increased the demand for carbamate insecticides such as methiocarb, carbamyl and carbofuran for crop protection. The yield of high-quality crops is increasing. According to the Indian Brand Equity Foundation, in September 2021, the Union Ministry of Agriculture and Farmers’ Welfare signed five MoUs with Ninjacart, Jio Platforms Limited, CISCO, NCDEX e-markets Limited and ITC Limited to support farmers in decision-making on the kind of crops to grow, variety of seeds to use and best practices to adopt to maximize the yield. Also, according to the United States Department of Agriculture (USDA), in 2022, Russian wheat production for the marketing year is forecast at 81.0 million metric tons (MMT), which is 1 percent more than last month and 8 percent more than last year. Moreover, in Brazil, the total corn production for marketing year (MY) 2021/22 was116.0 million metric tons (MMT), which was larger than the previous year’s crop (MY 2020/21) by 29.0mmt (33 percent). Thus, the growing demand for high-quality and quantity of crops would drive the growth of the Carbamate Insecticides industry.

Growing Agriculture Sector:

The demand for Carbamate Insecticides to protect crops from infectious diseases caused by insects and pests such as bacterial panicle blight and bacterial leaf scorch is expected to drive the Carbamate Insecticides market growth. The increasing population with decreasing arable land generates the necessity for using insecticides to prevent damage to food crops. In September 2021, the Spanish government allocated EUR13 million (US$15.4 million) to fund the country’s agricultural projects. The projects aim at increasing the country’s food production capacity while contributing to rural development and regional balance. Also, according to the Ministry for Development of the North-East Region, in 2019, the Government of Japan invested 205.784 billion Yen (USD1.50 billion) in several ongoing projects for Sustainable Agriculture & Irrigation as well as new projects in different states of India's North-Eastern region. Moreover, increasing government initiatives to strengthen the agrochemicals sector is anticipated to surge the demand for carbamate insecticides in the agriculture sector. For instance, according to the Indian Brand Equity Foundation, in 2021-2022, the government planned to introduce production-linked incentives (PLI) scheme to promote domestic manufacturing of agrochemicals such as insecticides and fertilizers, with an allocation of US$32.2 million to the department of chemicals and petrochemicals. Thus, the Carbamate Insecticides market is forecasted to rise as such materials are needed to protect the farm yield, to control the damage to farm output and to better utilize the increased investments by the government in the agriculture sector

Carbamate Insecticides Market Challenge:

Rising Toxicity and Side-effects of Carbamate Insecticides:

The toxicity of Carbamate Insecticides to humans and animals is a major concern for the insecticide industries. It is listed under the toxicity category for dermal and eye irritation allergies. Additionally, inhalation of spray mist or dust from these insecticides may cause throat irritation, coughing and sneezing. As a result, carbamate insecticides in buildings to control pest infestation and in agricultural practices are highly regulated in Europe and the U.S. Moreover, the world's population is expected to grow to almost 10 billion by 2050. Therefore, in order to protect the plantations and crops' yield, the use of carbamate insecticides has increased. For instance, according to Food and Agriculture Organization (FAO), pesticide use went up by 36% between 2000 and 2019. Thus, increasing health hazards with the rising usage of Carbamate Insecticides would create hurdles for the market's growth.

Carbamate Insecticides Market Industry Outlook

Technology launches, acquisitions and R&D activities are key strategies players adopt in the Carbamate Insecticides markets. The top 10 companies in the carbamate insecticides market are:

  1. Syngenta
  2. Monsanto
  3. Lebanon Seaboard
  4. BASF
  5. Drexel Chemical
  6. Bayer
  7. Sumimoto Chemical
  8. The Dow Chemical Company
  9. DuPont
  10. FMC Corporation

Recent Developments

In November 2020, Syngenta, a global leader in crop protection, introduced Spiropidion, a novel insect control technology. This product aids farmers in protecting crops from pests such as aphids and scales, while also being safe for beneficial insects such as bees.

In March 2021, FMC Corporation announced a strategic partnership with UPL Ltd. to expand their production capabilities and expand the market for agricultural products like Rynaxypr. These commercial agreements allow the company to achieve long-term agricultural growth while also providing new product offerings to its customers.

Relevant Reports

Insecticides Market - Industry Analysis, Market Size, Share, Trends, Application Analysis, Growth and Forecast Analysis

Report Code: CMR 0421

North America Insecticides Market - Industry Analysis, Market Size, Share, Trends, Application Analysis, Growth and Forecast Analysis

Report Code: CMR 1334

Slow And Controlled Release Pesticides Market - Industry Analysis, Market Size, Share, Trends, Application Analysis, Growth and Forecast Analysis

Report Code: CMR 10349

For more Chemicals and Materials Market reports, please click here

1. Carbamate Insecticides Market - Market Overview
    1.1 Definitions and Scope
2. Carbamate Insecticides Market - Executive Summary
    2.1 Key Trends by Type
    2.2 Key Trends by Form
    2.3 Key Trends by Crop Type
    2.4 Key Trends by End-use Industry
    2.5 Key Trends by Geography
3. Carbamate Insecticides Market – Comparative analysis
    3.1 Market Share Analysis - Major Companies
    3.2 Product Benchmarking - Major Companies
    3.3 Top 5 Financials Analysis
    3.4 Patent Analysis - Major Companies
    3.5 Pricing Analysis (ASPs will be provided)
4. Carbamate Insecticides Market - Startup Companies Scenario Premium 
    4.1 Major startup company analysis:
        4.1.1 Investment
        4.1.2 Revenue
        4.1.3 Product portfolio
        4.1.4 Venture Capital and Funding Scenario
5. Carbamate Insecticides Market – Industry Market Entry Scenario Premium Premium
    5.1 Regulatory Framework Overview
    5.2 New Business and Ease of Doing Business Index
    5.3 Successful Venture Profiles
    5.4 Customer Analysis – Major companies
6. Carbamate Insecticides Market - Market Forces
    6.1 Market Drivers
    6.2 Market Constraints
    6.3 Porter's Five Force Model
        6.3.1 Bargaining Power of Suppliers
        6.3.2 Bargaining Powers of Buyers
        6.3.3 Threat of New Entrants
        6.3.4 Competitive Rivalry
        6.3.5 Threat of Substitutes
7. Carbamate Insecticides Market – Strategic Analysis
    7.1 Value/Supply Chain Analysis
    7.2 Opportunity Analysis
    7.3 Product/Market Life Cycle
    7.4 Distributor Analysis – Major Companies
8. Carbamate Insecticides Market – by Type (Market Size - US$ Million/Billion)
    8.1 Aldicarb
    8.2 Oxamyl
    8.3 Carbaryl
    8.4 Methiocarb
    8.5 Carbofuran
    8.6 Methomyl
    8.7 Thiodicarb
    8.8 Others
9. Carbamate Insecticides Market - by Form (Market Size - US$ Million/Billion)
    9.1 Baits
    9.2 Sprays
    9.3 Strips
10. Carbamate Insecticides Market – by Crop Type (Market Size - US$ Million/Billion)
    10.1 Cash Crop
        10.1.1 Rice
        10.1.2 Cotton
        10.1.3 Oilseeds
        10.1.4 Soybean
        10.1.5 Others
    10.2 Food Crops
        10.2.1 Wheat
        10.2.2 Rice
        10.2.3 Maize
        10.2.4 Others
    10.3 Horticulture Crops
        10.3.1 Fruits
            10.3.1.1 Orange
            10.3.1.2 Apples
            10.3.1.3 Grapes
            10.3.1.4 Banana
            10.3.1.5 Others
        10.3.2 Vegetables
            10.3.2.1 Tomato
            10.3.2.2 Potato
            10.3.2.3 Onions
            10.3.2.4 Carrot
            10.3.2.5 Others
    10.4 Plantation Crops
        10.4.1 Tea
        10.4.2 Coffee
        10.4.3 Others
    10.5 Others
11. Carbamate Insecticides Market - by End-use Industry (Market Size - US$ Million/Billion)
    11.1 Agriculture
    11.2 Forests
    11.3 Building and Construction
        11.3.1 Residential
        11.3.2 Commercial
        11.3.3 Industrial
        11.3.4 Infrastructural
    11.4 Others
12. Carbamate Insecticides Market - by Geography (Market Size - US$ Million/Billion)
    12.1 North America
        12.1.1 The USA
        12.1.2 Canada
        12.1.3 Mexico
    12.2 Europe
        12.2.1 The UK
        12.2.2 Germany
        12.2.3 France
        12.2.4 Italy
        12.2.5 The Netherlands
        12.2.6 Spain
        12.2.7 Belgium
        12.2.8 The Rest of Europe
    12.3 Asia-Pacific
        12.3.1 China
        12.3.2 Japan
        12.3.3 India
        12.3.4 South Korea
        12.3.5 Australia and New Zeeland
        12.3.6 Indonesia
        12.3.7 Taiwan
        12.3.8 Malaysia
        12.3.9 The Rest of APAC
    12.4 South America
        12.4.1 Brazil
        12.4.2 Argentina
        12.4.3 Colombia
        12.4.4 Chile
        12.4.5 The Rest of South America
    12.5 The Rest of the World
        12.5.1 The Middle East
            12.5.1.1 Saudi Arabia
            12.5.1.2 The UAE
            12.5.1.3 Israel
            12.5.1.4 The Rest of the Middle East
        12.5.2 Africa
            12.5.2.1 South Africa
            12.5.2.2 Nigeria
            12.5.2.3 Rhe Rest of Africa
13. Carbamate Insecticides Market – Entropy
    13.1 New Product Launches
    13.2 M&As, Collaborations, JVs and Partnerships
14. Carbamate Insecticides Market – Industry/Segment Competition Landscape Premium
    14.1 Company Benchmarking Matrix – Major Companies
    14.2 Market Share at Global Level - Major companies
    14.3 Market Share at Country Level - Major companies
    14.4 Market Share by Key Geography - Major companies
    14.5 Market Share by Key Application - Major companies
    14.6 Market Share by Key Product - Major companies
15. Carbamate Insecticides Market – Key Company List by Country Premium Premium
16. Carbamate Insecticides Market Company Analysis - Business Overview, Product Portfolio, Financials and Developments
    16.1 Company 1
    16.2 Company 2
    16.3 Company 3
    16.4 Company 4
    16.5 Company 5
    16.6 Company 6
    16.7 Company 7
    16.8 Company 8
    16.9 Company 9
    16.10 Company 10 and more
    * "Financials would be provided to private companies on best-efforts basis."
    Connect with our experts to get customized reports that best suit your requirements. Our reports include global-level data, niche markets and competitive landscape.
List of Tables
Table 1: Carbamate Insecticides Market Overview 2021-2026
Table 2: Carbamate Insecticides Market Leader Analysis 2018-2019 (US$)
Table 3: Carbamate Insecticides Market Product Analysis 2018-2019 (US$)
Table 4: Carbamate Insecticides Market End User Analysis 2018-2019 (US$)
Table 5: Carbamate Insecticides Market Patent Analysis 2013-2018* (US$)
Table 6: Carbamate Insecticides Market Financial Analysis 2018-2019 (US$)
Table 7: Carbamate Insecticides Market Driver Analysis 2018-2019 (US$)
Table 8: Carbamate Insecticides Market Challenges Analysis 2018-2019 (US$)
Table 9: Carbamate Insecticides Market Constraint Analysis 2018-2019 (US$)
Table 10: Carbamate Insecticides Market Supplier Bargaining Power Analysis 2018-2019 (US$)
Table 11: Carbamate Insecticides Market Buyer Bargaining Power Analysis 2018-2019 (US$)
Table 12: Carbamate Insecticides Market Threat of Substitutes Analysis 2018-2019 (US$)
Table 13: Carbamate Insecticides Market Threat of New Entrants Analysis 2018-2019 (US$)
Table 14: Carbamate Insecticides Market Degree of Competition Analysis 2018-2019 (US$)
Table 15: Carbamate Insecticides Market Value Chain Analysis 2018-2019 (US$)
Table 16: Carbamate Insecticides Market Pricing Analysis 2021-2026 (US$)
Table 17: Carbamate Insecticides Market Opportunities Analysis 2021-2026 (US$)
Table 18: Carbamate Insecticides Market Product Life Cycle Analysis 2021-2026 (US$)
Table 19: Carbamate Insecticides Market Supplier Analysis 2018-2019 (US$)
Table 20: Carbamate Insecticides Market Distributor Analysis 2018-2019 (US$)
Table 21: Carbamate Insecticides Market Trend Analysis 2018-2019 (US$)
Table 22: Carbamate Insecticides Market Size 2018 (US$)
Table 23: Carbamate Insecticides Market Forecast Analysis 2021-2026 (US$)
Table 24: Carbamate Insecticides Market Sales Forecast Analysis 2021-2026 (Units)
Table 25: Carbamate Insecticides Market, Revenue & Volume,By Type, 2021-2026 ($)
Table 26: Carbamate Insecticides Market By Type, Revenue & Volume,By Aldicarb, 2021-2026 ($)
Table 27: Carbamate Insecticides Market By Type, Revenue & Volume,By Oxamyl, 2021-2026 ($)
Table 28: Carbamate Insecticides Market By Type, Revenue & Volume,By Carbaryl, 2021-2026 ($)
Table 29: Carbamate Insecticides Market By Type, Revenue & Volume,By Methiocarb, 2021-2026 ($)
Table 30: Carbamate Insecticides Market By Type, Revenue & Volume,By Carbofuran, 2021-2026 ($)
Table 31: Carbamate Insecticides Market, Revenue & Volume,By Application, 2021-2026 ($)
Table 32: Carbamate Insecticides Market By Application, Revenue & Volume,By Agriculture, 2021-2026 ($)
Table 33: Carbamate Insecticides Market By Application, Revenue & Volume,By Forests, 2021-2026 ($)
Table 34: Carbamate Insecticides Market By Application, Revenue & Volume,By Building & Construction, 2021-2026 ($)
Table 35: Carbamate Insecticides Market By Application, Revenue & Volume,By Residential, 2021-2026 ($)
Table 36: Carbamate Insecticides Market By Application, Revenue & Volume,By Commercial, 2021-2026 ($)
Table 37: North America Carbamate Insecticides Market, Revenue & Volume,By Type, 2021-2026 ($)
Table 38: North America Carbamate Insecticides Market, Revenue & Volume,By Application, 2021-2026 ($)
Table 39: South america Carbamate Insecticides Market, Revenue & Volume,By Type, 2021-2026 ($)
Table 40: South america Carbamate Insecticides Market, Revenue & Volume,By Application, 2021-2026 ($)
Table 41: Europe Carbamate Insecticides Market, Revenue & Volume,By Type, 2021-2026 ($)
Table 42: Europe Carbamate Insecticides Market, Revenue & Volume,By Application, 2021-2026 ($)
Table 43: APAC Carbamate Insecticides Market, Revenue & Volume,By Type, 2021-2026 ($)
Table 44: APAC Carbamate Insecticides Market, Revenue & Volume,By Application, 2021-2026 ($)
Table 45: Middle East & Africa Carbamate Insecticides Market, Revenue & Volume,By Type, 2021-2026 ($)
Table 46: Middle East & Africa Carbamate Insecticides Market, Revenue & Volume,By Application, 2021-2026 ($)
Table 47: Russia Carbamate Insecticides Market, Revenue & Volume,By Type, 2021-2026 ($)
Table 48: Russia Carbamate Insecticides Market, Revenue & Volume,By Application, 2021-2026 ($)
Table 49: Israel Carbamate Insecticides Market, Revenue & Volume,By Type, 2021-2026 ($)
Table 50: Israel Carbamate Insecticides Market, Revenue & Volume,By Application, 2021-2026 ($)
Table 51: Top Companies 2018 (US$)Carbamate Insecticides Market, Revenue & Volume
Table 52: Product Launch 2018-2019Carbamate Insecticides Market, Revenue & Volume
Table 53: Mergers & Acquistions 2018-2019Carbamate Insecticides Market, Revenue & Volume

List of Figures
Figure 1: Overview of Carbamate Insecticides Market 2021-2026
Figure 2: Market Share Analysis for Carbamate Insecticides Market 2018 (US$)
Figure 3: Product Comparison in Carbamate Insecticides Market 2018-2019 (US$)
Figure 4: End User Profile for Carbamate Insecticides Market 2018-2019 (US$)
Figure 5: Patent Application and Grant in Carbamate Insecticides Market 2013-2018* (US$)
Figure 6: Top 5 Companies Financial Analysis in Carbamate Insecticides Market 2018-2019 (US$)
Figure 7: Market Entry Strategy in Carbamate Insecticides Market 2018-2019
Figure 8: Ecosystem Analysis in Carbamate Insecticides Market 2018
Figure 9: Average Selling Price in Carbamate Insecticides Market 2021-2026
Figure 10: Top Opportunites in Carbamate Insecticides Market 2018-2019
Figure 11: Market Life Cycle Analysis in Carbamate Insecticides Market
Figure 12: GlobalBy TypeCarbamate Insecticides Market Revenue, 2021-2026 ($)
Figure 13: GlobalBy ApplicationCarbamate Insecticides Market Revenue, 2021-2026 ($)
Figure 14: Global Carbamate Insecticides Market - By Geography
Figure 15: Global Carbamate Insecticides Market Value & Volume, By Geography, 2021-2026 ($) 
Figure 16: Global Carbamate Insecticides Market CAGR, By Geography, 2021-2026 (%)
Figure 17: North America Carbamate Insecticides Market Value & Volume, 2021-2026 ($)
Figure 18: US Carbamate Insecticides Market Value & Volume, 2021-2026 ($)
Figure 19: US GDP and Population, 2018-2019 ($)
Figure 20: US GDP – Composition of 2018, By Sector of Origin
Figure 21: US Export and Import Value & Volume, 2018-2019 ($)
Figure 22: Canada Carbamate Insecticides Market Value & Volume, 2021-2026 ($)
Figure 23: Canada GDP and Population, 2018-2019 ($)
Figure 24: Canada GDP – Composition of 2018, By Sector of Origin
Figure 25: Canada Export and Import Value & Volume, 2018-2019 ($)
Figure 26: Mexico Carbamate Insecticides Market Value & Volume, 2021-2026 ($)
Figure 27: Mexico GDP and Population, 2018-2019 ($)
Figure 28: Mexico GDP – Composition of 2018, By Sector of Origin
Figure 29: Mexico Export and Import Value & Volume, 2018-2019 ($)
Figure 30: South America Carbamate Insecticides Market Value & Volume, 2021-2026 ($)
Figure 31: Brazil Carbamate Insecticides Market Value & Volume, 2021-2026 ($)
Figure 32: Brazil GDP and Population, 2018-2019 ($)
Figure 33: Brazil GDP – Composition of 2018, By Sector of Origin
Figure 34: Brazil Export and Import Value & Volume, 2018-2019 ($)
Figure 35: Venezuela Carbamate Insecticides Market Value & Volume, 2021-2026 ($)
Figure 36: Venezuela GDP and Population, 2018-2019 ($)
Figure 37: Venezuela GDP – Composition of 2018, By Sector of Origin
Figure 38: Venezuela Export and Import Value & Volume, 2018-2019 ($)
Figure 39: Argentina Carbamate Insecticides Market Value & Volume, 2021-2026 ($)
Figure 40: Argentina GDP and Population, 2018-2019 ($)
Figure 41: Argentina GDP – Composition of 2018, By Sector of Origin
Figure 42: Argentina Export and Import Value & Volume, 2018-2019 ($)
Figure 43: Ecuador Carbamate Insecticides Market Value & Volume, 2021-2026 ($)
Figure 44: Ecuador GDP and Population, 2018-2019 ($)
Figure 45: Ecuador GDP – Composition of 2018, By Sector of Origin
Figure 46: Ecuador Export and Import Value & Volume, 2018-2019 ($)
Figure 47: Peru Carbamate Insecticides Market Value & Volume, 2021-2026 ($)
Figure 48: Peru GDP and Population, 2018-2019 ($)
Figure 49: Peru GDP – Composition of 2018, By Sector of Origin
Figure 50: Peru Export and Import Value & Volume, 2018-2019 ($)
Figure 51: Colombia Carbamate Insecticides Market Value & Volume, 2021-2026 ($)
Figure 52: Colombia GDP and Population, 2018-2019 ($)
Figure 53: Colombia GDP – Composition of 2018, By Sector of Origin
Figure 54: Colombia Export and Import Value & Volume, 2018-2019 ($)
Figure 55: Costa Rica Carbamate Insecticides Market Value & Volume, 2021-2026 ($)
Figure 56: Costa Rica GDP and Population, 2018-2019 ($)
Figure 57: Costa Rica GDP – Composition of 2018, By Sector of Origin
Figure 58: Costa Rica Export and Import Value & Volume, 2018-2019 ($)
Figure 59: Europe Carbamate Insecticides Market Value & Volume, 2021-2026 ($)
Figure 60: U.K Carbamate Insecticides Market Value & Volume, 2021-2026 ($)
Figure 61: U.K GDP and Population, 2018-2019 ($)
Figure 62: U.K GDP – Composition of 2018, By Sector of Origin
Figure 63: U.K Export and Import Value & Volume, 2018-2019 ($)
Figure 64: Germany Carbamate Insecticides Market Value & Volume, 2021-2026 ($)
Figure 65: Germany GDP and Population, 2018-2019 ($)
Figure 66: Germany GDP – Composition of 2018, By Sector of Origin
Figure 67: Germany Export and Import Value & Volume, 2018-2019 ($)
Figure 68: Italy Carbamate Insecticides Market Value & Volume, 2021-2026 ($)
Figure 69: Italy GDP and Population, 2018-2019 ($)
Figure 70: Italy GDP – Composition of 2018, By Sector of Origin
Figure 71: Italy Export and Import Value & Volume, 2018-2019 ($)
Figure 72: France Carbamate Insecticides Market Value & Volume, 2021-2026 ($)
Figure 73: France GDP and Population, 2018-2019 ($)
Figure 74: France GDP – Composition of 2018, By Sector of Origin
Figure 75: France Export and Import Value & Volume, 2018-2019 ($)
Figure 76: Netherlands Carbamate Insecticides Market Value & Volume, 2021-2026 ($)
Figure 77: Netherlands GDP and Population, 2018-2019 ($)
Figure 78: Netherlands GDP – Composition of 2018, By Sector of Origin
Figure 79: Netherlands Export and Import Value & Volume, 2018-2019 ($)
Figure 80: Belgium Carbamate Insecticides Market Value & Volume, 2021-2026 ($)
Figure 81: Belgium GDP and Population, 2018-2019 ($)
Figure 82: Belgium GDP – Composition of 2018, By Sector of Origin
Figure 83: Belgium Export and Import Value & Volume, 2018-2019 ($)
Figure 84: Spain Carbamate Insecticides Market Value & Volume, 2021-2026 ($)
Figure 85: Spain GDP and Population, 2018-2019 ($)
Figure 86: Spain GDP – Composition of 2018, By Sector of Origin
Figure 87: Spain Export and Import Value & Volume, 2018-2019 ($)
Figure 88: Denmark Carbamate Insecticides Market Value & Volume, 2021-2026 ($)
Figure 89: Denmark GDP and Population, 2018-2019 ($)
Figure 90: Denmark GDP – Composition of 2018, By Sector of Origin
Figure 91: Denmark Export and Import Value & Volume, 2018-2019 ($)
Figure 92: APAC Carbamate Insecticides Market Value & Volume, 2021-2026 ($)
Figure 93: China Carbamate Insecticides Market Value & Volume, 2021-2026
Figure 94: China GDP and Population, 2018-2019 ($)
Figure 95: China GDP – Composition of 2018, By Sector of Origin
Figure 96: China Export and Import Value & Volume, 2018-2019 ($)Carbamate Insecticides Market China Export and Import Value & Volume, 2018-2019 ($)
Figure 97: Australia Carbamate Insecticides Market Value & Volume, 2021-2026 ($)
Figure 98: Australia GDP and Population, 2018-2019 ($)
Figure 99: Australia GDP – Composition of 2018, By Sector of Origin
Figure 100: Australia Export and Import Value & Volume, 2018-2019 ($)
Figure 101: South Korea Carbamate Insecticides Market Value & Volume, 2021-2026 ($)
Figure 102: South Korea GDP and Population, 2018-2019 ($)
Figure 103: South Korea GDP – Composition of 2018, By Sector of Origin
Figure 104: South Korea Export and Import Value & Volume, 2018-2019 ($)
Figure 105: India Carbamate Insecticides Market Value & Volume, 2021-2026 ($)
Figure 106: India GDP and Population, 2018-2019 ($)
Figure 107: India GDP – Composition of 2018, By Sector of Origin
Figure 108: India Export and Import Value & Volume, 2018-2019 ($)
Figure 109: Taiwan Carbamate Insecticides Market Value & Volume, 2021-2026 ($)
Figure 110: Taiwan GDP and Population, 2018-2019 ($)
Figure 111: Taiwan GDP – Composition of 2018, By Sector of Origin
Figure 112: Taiwan Export and Import Value & Volume, 2018-2019 ($)
Figure 113: Malaysia Carbamate Insecticides Market Value & Volume, 2021-2026 ($)
Figure 114: Malaysia GDP and Population, 2018-2019 ($)
Figure 115: Malaysia GDP – Composition of 2018, By Sector of Origin
Figure 116: Malaysia Export and Import Value & Volume, 2018-2019 ($)
Figure 117: Hong Kong Carbamate Insecticides Market Value & Volume, 2021-2026 ($)
Figure 118: Hong Kong GDP and Population, 2018-2019 ($)
Figure 119: Hong Kong GDP – Composition of 2018, By Sector of Origin
Figure 120: Hong Kong Export and Import Value & Volume, 2018-2019 ($)
Figure 121: Middle East & Africa Carbamate Insecticides Market Middle East & Africa 3D Printing Market Value & Volume, 2021-2026 ($)
Figure 122: Russia Carbamate Insecticides Market Value & Volume, 2021-2026 ($)
Figure 123: Russia GDP and Population, 2018-2019 ($)
Figure 124: Russia GDP – Composition of 2018, By Sector of Origin
Figure 125: Russia Export and Import Value & Volume, 2018-2019 ($)
Figure 126: Israel Carbamate Insecticides Market Value & Volume, 2021-2026 ($)
Figure 127: Israel GDP and Population, 2018-2019 ($)
Figure 128: Israel GDP – Composition of 2018, By Sector of Origin
Figure 129: Israel Export and Import Value & Volume, 2018-2019 ($)
Figure 130: Entropy Share, By Strategies, 2018-2019* (%)Carbamate Insecticides Market 
Figure 131: Developments, 2018-2019*Carbamate Insecticides Market 
Figure 132: Company 1 Carbamate Insecticides Market Net Revenue, By Years, 2018-2019* ($)
Figure 133: Company 1 Carbamate Insecticides Market Net Revenue Share, By Business segments, 2018 (%)
Figure 134: Company 1 Carbamate Insecticides Market Net Sales Share, By Geography, 2018 (%)
Figure 135: Company 2 Carbamate Insecticides Market Net Revenue, By Years, 2018-2019* ($)
Figure 136: Company 2 Carbamate Insecticides Market Net Revenue Share, By Business segments, 2018 (%)
Figure 137: Company 2 Carbamate Insecticides Market Net Sales Share, By Geography, 2018 (%)
Figure 138: Company 3Carbamate Insecticides Market Net Revenue, By Years, 2018-2019* ($)
Figure 139: Company 3Carbamate Insecticides Market Net Revenue Share, By Business segments, 2018 (%)
Figure 140: Company 3Carbamate Insecticides Market Net Sales Share, By Geography, 2018 (%)
Figure 141: Company 4 Carbamate Insecticides Market Net Revenue, By Years, 2018-2019* ($)
Figure 142: Company 4 Carbamate Insecticides Market Net Revenue Share, By Business segments, 2018 (%)
Figure 143: Company 4 Carbamate Insecticides Market Net Sales Share, By Geography, 2018 (%)
Figure 144: Company 5 Carbamate Insecticides Market Net Revenue, By Years, 2018-2019* ($)
Figure 145: Company 5 Carbamate Insecticides Market Net Revenue Share, By Business segments, 2018 (%)
Figure 146: Company 5 Carbamate Insecticides Market Net Sales Share, By Geography, 2018 (%)
Figure 147: Company 6 Carbamate Insecticides Market Net Revenue, By Years, 2018-2019* ($)
Figure 148: Company 6 Carbamate Insecticides Market Net Revenue Share, By Business segments, 2018 (%)
Figure 149: Company 6 Carbamate Insecticides Market Net Sales Share, By Geography, 2018 (%)
Figure 150: Company 7 Carbamate Insecticides Market Net Revenue, By Years, 2018-2019* ($)
Figure 151: Company 7 Carbamate Insecticides Market Net Revenue Share, By Business segments, 2018 (%)
Figure 152: Company 7 Carbamate Insecticides Market Net Sales Share, By Geography, 2018 (%)
Figure 153: Company 8 Carbamate Insecticides Market Net Revenue, By Years, 2018-2019* ($)
Figure 154: Company 8 Carbamate Insecticides Market Net Revenue Share, By Business segments, 2018 (%)
Figure 155: Company 8 Carbamate Insecticides Market Net Sales Share, By Geography, 2018 (%)
Figure 156: Company 9 Carbamate Insecticides Market Net Revenue, By Years, 2018-2019* ($)
Figure 157: Company 9 Carbamate Insecticides Market Net Revenue Share, By Business segments, 2018 (%)
Figure 158: Company 9 Carbamate Insecticides Market Net Sales Share, By Geography, 2018 (%)
Figure 159: Company 10 Carbamate Insecticides Market Net Revenue, By Years, 2018-2019* ($)
Figure 160: Company 10 Carbamate Insecticides Market Net Revenue Share, By Business segments, 2018 (%)
Figure 161: Company 10 Carbamate Insecticides Market Net Sales Share, By Geography, 2018 (%)
Figure 162: Company 11 Carbamate Insecticides Market Net Revenue, By Years, 2018-2019* ($)
Figure 163: Company 11 Carbamate Insecticides Market Net Revenue Share, By Business segments, 2018 (%)
Figure 164: Company 11 Carbamate Insecticides Market Net Sales Share, By Geography, 2018 (%)
Figure 165: Company 12 Carbamate Insecticides Market Net Revenue, By Years, 2018-2019* ($)
Figure 166: Company 12 Carbamate Insecticides Market Net Revenue Share, By Business segments, 2018 (%)
Figure 167: Company 12 Carbamate Insecticides Market Net Sales Share, By Geography, 2018 (%)
Figure 168: Company 13Carbamate Insecticides Market Net Revenue, By Years, 2018-2019* ($)
Figure 169: Company 13Carbamate Insecticides Market Net Revenue Share, By Business segments, 2018 (%)
Figure 170: Company 13Carbamate Insecticides Market Net Sales Share, By Geography, 2018 (%)
Figure 171: Company 14 Carbamate Insecticides Market Net Revenue, By Years, 2018-2019* ($)
Figure 172: Company 14 Carbamate Insecticides Market Net Revenue Share, By Business segments, 2018 (%)
Figure 173: Company 14 Carbamate Insecticides Market Net Sales Share, By Geography, 2018 (%)
Figure 174: Company 15 Carbamate Insecticides Market Net Revenue, By Years, 2018-2019* ($)
Figure 175: Company 15 Carbamate Insecticides Market Net Revenue Share, By Business segments, 2018 (%)
Figure 176: Company 15 Carbamate Insecticides Market Net Sales Share, By Geography, 2018 (%)