 Email
Email Print
Print


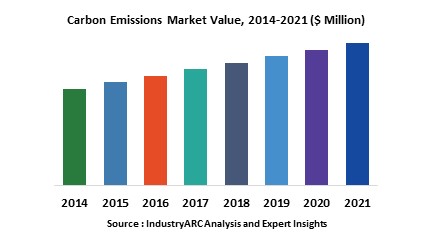
Carbon emission can be defined as the release of carbon into the atmosphere. Carbon emissions from various sources such as automobile, fossil fuel burning, industrial activities, marine & aviation and transportation and logistics plays vital role in changing climate and depleting ozone layer. Constant increasing pollution from various sources has become a vital global problem in recent time. As a result of which various government agencies and global regulatory authorities have laid down various protocols like The Kyoto Protocol, which was adopted in Japan in December 1997 and brought into effect in February 2005 to curb global carbon emission in order to reduce its impacts on climate.
This report identifies the carbon emission market size in for the year 2014-2016, and forecast of the same for year 2021. It also highlights the potential growth opportunities in the coming years, while also reviewing the market drivers, restraints, growth indicators, challenges, market dynamics, competitive landscape, and other key aspects with respect to carbon emission market.
Globally Europe dominated the market for carbon emission in 2015 due to strict regulations laid down by governments and other regulatory authorities in the region along with high awareness about impacts of carbon emission on climatic conditions amongst the European citizens. Europe is expected to continue its domination and was followed by North America and Asia-Pacific as the second and third largest markets respectively in 2015. However Asia-Pacific is expected to be the fastest growing market due to newer regulations, initiatives of the regional governments along with increasing pressure from global agencies to curb carbon emissions in the region.
This report on global carbon emission also covers different sources of carbon emission, and market size in various geographical regions.
This report identifies all the major companies operating in the global carbon emission market. Some of the major companies’ profiles in detail are as follows:
This report identifies the carbon emission market size in for the year 2014-2016, and forecast of the same for year 2021. It also highlights the potential growth opportunities in the coming years, while also reviewing the market drivers, restraints, growth indicators, challenges, market dynamics, competitive landscape, and other key aspects with respect to carbon emission market.
Globally Europe dominated the market for carbon emission in 2015 due to strict regulations laid down by governments and other regulatory authorities in the region along with high awareness about impacts of carbon emission on climatic conditions amongst the European citizens. Europe is expected to continue its domination and was followed by North America and Asia-Pacific as the second and third largest markets respectively in 2015. However Asia-Pacific is expected to be the fastest growing market due to newer regulations, initiatives of the regional governments along with increasing pressure from global agencies to curb carbon emissions in the region.
This report on global carbon emission also covers different sources of carbon emission, and market size in various geographical regions.
- On the basis of sources responsible for carbon emission this report is classified as follows covering all major sources of carbon emission: Automotive, Energy Production, Industrial, Marine & Aviation, Transport & logistics and Others
- This is report has been further segmented into major regions, which includes detailed analysis of each region such as North America, Europe, Asia-Pacific (APAC) and Rest of the World (RoW) covering all the major country level markets for carbon emission in each of the region.
This report identifies all the major companies operating in the global carbon emission market. Some of the major companies’ profiles in detail are as follows:
- Tradition Financial Services
- EcoSecurities Group plc
- Baker & McKenzie
- Sterling Planet Incorporated
- TUV SUD America
1. Carbon Emissions Market - Overview
1.1. Definitions and Scope
2. Carbon Emissions Market - Executive summary
2.1. Market Revenue, Market Size and Key Trends by Company
2.2. Key Trends by type of Application
2.3. Key Trends segmented by Geography
3. Carbon Emissions Market
3.1. Comparative analysis
3.1.1. Product Benchmarking - Top 10 companies
3.1.2. Top 5 Financials Analysis
3.1.3. Market Value split by Top 10 companies
3.1.4. Patent Analysis - Top 10 companies
3.1.5. Pricing Analysis
4. Carbon Emissions Market – Startup companies Scenario Premium
4.1. Top 10 startup company Analysis by
4.1.1. Investment
4.1.2. Revenue
4.1.3. Market Shares
4.1.4. Market Size and Application Analysis
4.1.5. Venture Capital and Funding Scenario
5. Carbon Emissions Market – Industry Market Entry Scenario Premium
5.1. Regulatory Framework Overview
5.2. New Business and Ease of Doing business index
5.3. Case studies of successful ventures
5.4. Customer Analysis – Top 10 companies
6. Carbon Emissions Market Forces
6.1. Drivers
6.2. Constraints
6.3. Challenges
6.4. Porters five force model
6.4.1. Bargaining power of suppliers
6.4.2. Bargaining powers of customers
6.4.3. Threat of new entrants
6.4.4. Rivalry among existing players
6.4.5. Threat of substitutes
7. Carbon Emissions Market - Strategic analysis
7.1. Value chain analysis
7.2. Opportunities analysis
7.3. Product life cycle
7.4. Suppliers and distributors Market Share
8. Carbon Emissions Market – By Source (Market Size -$Million / $Billion)
8.1. Market Size and Market Share Analysis
8.2. Application Revenue and Trend Research
8.3. Product Segment Analysis
8.3.1. Automotive
8.3.2. Energy Production
8.3.3. Industrial
8.3.4. Marine & Aviation
8.3.5. Transport & logistics
8.3.6. Others
9. Carbon Emissions - By Geography (Market Size -$Million / $Billion)
9.1. Carbon Emissions Market - North America Segment Research
9.2. North America Market Research (Million / $Billion)
9.2.1. Segment type Size and Market Size Analysis
9.2.2. Revenue and Trends
9.2.3. Application Revenue and Trends by type of Application
9.2.4. Company Revenue and Product Analysis
9.2.5. North America Product type and Application Market Size
9.2.5.1. U.S.
9.2.5.2. Canada
9.2.5.3. Mexico
9.2.5.4. Rest of North America
9.3. Carbon Emissions - South America Segment Research
9.4. South America Market Research (Market Size -$Million / $Billion)
9.4.1. Segment type Size and Market Size Analysis
9.4.2. Revenue and Trends
9.4.3. Application Revenue and Trends by type of Application
9.4.4. Company Revenue and Product Analysis
9.4.5. South America Product type and Application Market Size
9.4.5.1. Brazil
9.4.5.2. Venezuela
9.4.5.3. Argentina
9.4.5.4. Ecuador
9.4.5.5. Peru
9.4.5.6. Colombia
9.4.5.7. Costa Rica
9.4.5.8. Rest of South America
9.5. Carbon Emissions - Europe Segment Research
9.6. Europe Market Research (Market Size -$Million / $Billion)
9.6.1. Segment type Size and Market Size Analysis
9.6.2. Revenue and Trends
9.6.3. Application Revenue and Trends by type of Application
9.6.4. Company Revenue and Product Analysis
9.6.5. Europe Segment Product type and Application Market Size
9.6.5.1. U.K
9.6.5.2. Germany
9.6.5.3. Italy
9.6.5.4. France
9.6.5.5. Netherlands
9.6.5.6. Belgium
9.6.5.7. Spain
9.6.5.8. Denmark
9.6.5.9. Rest of Europe
9.7. Carbon Emissions – APAC Segment Research
9.8. APAC Market Research (Market Size -$Million / $Billion)
9.8.1. Segment type Size and Market Size Analysis
9.8.2. Revenue and Trends
9.8.3. Application Revenue and Trends by type of Application
9.8.4. Company Revenue and Product Analysis
9.8.5. APAC Segment – Product type and Application Market Size
9.8.5.1. China
9.8.5.2. Australia
9.8.5.3. Japan
9.8.5.4. South Korea
9.8.5.5. India
9.8.5.6. Taiwan
9.8.5.7. Malaysia
12. Carbon Emissions Market - Entropy
12.1. New product launches
12.2. M&A's, collaborations, JVs and partnerships
13. Carbon Emissions Market – Industry / Segment Competition landscape Premium
13.1. Market Share Analysis
13.1.1. Market Share by Country- Top companies
13.1.2. Market Share by Region- Top 10 companies
13.1.3. Market Share by type of Application – Top 10 companies
13.1.4. Market Share by type of Product / Product category- Top 10 companies
13.1.5. Market Share at global level- Top 10 companies
13.1.6. Best Practises for companies
14. Carbon Emissions Market – Key Company List by Country Premium
15. Carbon Emissions Market Company Analysis
15.1. Market Share, Company Revenue, Products, M&A, Developments
15.2. Tradition Financial Services
15.3. EcoSecurities Group plc
15.4. Baker & McKenzie
15.5. Sterling Planet Incorporated
15.6. TUV SUD America
15.7. Company 6
15.8. Company 7
15.9. Company 8
15.10. Company 9
15.11. Company 10 and more
"*Financials would be provided on a best efforts basis for private companies"
16. Carbon Emissions Market - Appendix
16.1. Abbreviations
16.2. Sources
17. Carbon Emissions Market - Methodology
17.1. Research Methodology
17.1.1. Company Expert Interviews
17.1.2. Industry Databases
17.1.3. Associations
17.1.4. Company News
17.1.5. Company Annual Reports
17.1.6. Application Trends
17.1.7. New Products and Product database
17.1.8. Company Transcripts
17.1.9. R&D Trends
17.1.10. Key Opinion Leaders Interviews
17.1.11. Supply and Demand Trends
List of Tables:
Table 1: Carbon Emissions Market Overview 2021-2026
Table 2: Carbon Emissions Market Leader Analysis 2018-2019 (US$)
Table 3: Carbon Emissions Market Product Analysis 2018-2019 (US$)
Table 4: Carbon Emissions Market End User Analysis 2018-2019 (US$)
Table 5: Carbon Emissions Market Patent Analysis 2013-2018* (US$)
Table 6: Carbon Emissions Market Financial Analysis 2018-2019 (US$)
Table 7: Carbon Emissions Market Driver Analysis 2018-2019 (US$)
Table 8: Carbon Emissions Market Challenges Analysis 2018-2019 (US$)
Table 9: Carbon Emissions Market Constraint Analysis 2018-2019 (US$)
Table 10: Carbon Emissions Market Supplier Bargaining Power Analysis 2018-2019 (US$)
Table 11: Carbon Emissions Market Buyer Bargaining Power Analysis 2018-2019 (US$)
Table 12: Carbon Emissions Market Threat of Substitutes Analysis 2018-2019 (US$)
Table 13: Carbon Emissions Market Threat of New Entrants Analysis 2018-2019 (US$)
Table 14: Carbon Emissions Market Degree of Competition Analysis 2018-2019 (US$)
Table 15: Carbon Emissions Market Value Chain Analysis 2018-2019 (US$)
Table 16: Carbon Emissions Market Pricing Analysis 2021-2026 (US$)
Table 17: Carbon Emissions Market Opportunities Analysis 2021-2026 (US$)
Table 18: Carbon Emissions Market Product Life Cycle Analysis 2021-2026 (US$)
Table 19: Carbon Emissions Market Supplier Analysis 2018-2019 (US$)
Table 20: Carbon Emissions Market Distributor Analysis 2018-2019 (US$)
Table 21: Carbon Emissions Market Trend Analysis 2018-2019 (US$)
Table 22: Carbon Emissions Market Size 2018 (US$)
Table 23: Carbon Emissions Market Forecast Analysis 2021-2026 (US$)
Table 24: Carbon Emissions Market Sales Forecast Analysis 2021-2026 (Units)
Table 25: Carbon Emissions Market, Revenue & Volume, By Source, 2021-2026 ($)
Table 26: Carbon Emissions Market By Source, Revenue & Volume, By Automotive, 2021-2026 ($)
Table 27: Carbon Emissions Market By Source, Revenue & Volume, By Energy Production, 2021-2026 ($)
Table 28: Carbon Emissions Market By Source, Revenue & Volume, By Industrial, 2021-2026 ($)
Table 29: Carbon Emissions Market By Source, Revenue & Volume, By Marine & Aviation, 2021-2026 ($)
Table 30: Carbon Emissions Market By Source, Revenue & Volume, By Transport & logistics, 2021-2026 ($)
Table 31: North America Carbon Emissions Market, Revenue & Volume, By Source, 2021-2026 ($)
Table 32: South america Carbon Emissions Market, Revenue & Volume, By Source, 2021-2026 ($)
Table 33: Europe Carbon Emissions Market, Revenue & Volume, By Source, 2021-2026 ($)
Table 34: APAC Carbon Emissions Market, Revenue & Volume, By Source, 2021-2026 ($)
Table 35: Middle East & Africa Carbon Emissions Market, Revenue & Volume, By Source, 2021-2026 ($)
Table 36: Russia Carbon Emissions Market, Revenue & Volume, By Source, 2021-2026 ($)
Table 37: Israel Carbon Emissions Market, Revenue & Volume, By Source, 2021-2026 ($)
Table 38: Top Companies 2018 (US$) Carbon Emissions Market, Revenue & Volume
Table 39: Product Launch 2018-2019 Carbon Emissions Market, Revenue & Volume
Table 40: Mergers & Acquistions 2018-2019 Carbon Emissions Market, Revenue & Volume
List of Figures:
Figure 1: Overview of Carbon Emissions Market 2021-2026
Figure 2: Market Share Analysis for Carbon Emissions Market 2018 (US$)
Figure 3: Product Comparison in Carbon Emissions Market 2018-2019 (US$)
Figure 4: End User Profile for Carbon Emissions Market 2018-2019 (US$)
Figure 5: Patent Application and Grant in Carbon Emissions Market 2013-2018* (US$)
Figure 6: Top 5 Companies Financial Analysis in Carbon Emissions Market 2018-2019 (US$)
Figure 7: Market Entry Strategy in Carbon Emissions Market 2018-2019
Figure 8: Ecosystem Analysis in Carbon Emissions Market 2018
Figure 9: Average Selling Price in Carbon Emissions Market 2021-2026
Figure 10: Top Opportunites in Carbon Emissions Market 2018-2019
Figure 11: Market Life Cycle Analysis in Carbon Emissions Market
Figure 12: GlobalBy Source Carbon Emissions Market Revenue, 2021-2026 ($)
Figure 13: Global Carbon Emissions Market - By Geography
Figure 14: Global Carbon Emissions Market Value & Volume, By Geography, 2021-2026 ($)
Figure 15: Global Carbon Emissions Market CAGR, By Geography, 2021-2026 (%)
Figure 16: North America Carbon Emissions Market Value & Volume, 2021-2026 ($)
Figure 17: US Carbon Emissions Market Value & Volume, 2021-2026 ($)
Figure 18: US GDP and Population, 2018-2019 ($)
Figure 19: US GDP – Composition of 2018, By Sector of Origin
Figure 20: US Export and Import Value & Volume, 2018-2019 ($)
Figure 21: Canada Carbon Emissions Market Value & Volume, 2021-2026 ($)
Figure 22: Canada GDP and Population, 2018-2019 ($)
Figure 23: Canada GDP – Composition of 2018, By Sector of Origin
Figure 24: Canada Export and Import Value & Volume, 2018-2019 ($)
Figure 25: Mexico Carbon Emissions Market Value & Volume, 2021-2026 ($)
Figure 26: Mexico GDP and Population, 2018-2019 ($)
Figure 27: Mexico GDP – Composition of 2018, By Sector of Origin
Figure 28: Mexico Export and Import Value & Volume, 2018-2019 ($)
Figure 29: South America Carbon Emissions Market Value & Volume, 2021-2026 ($)
Figure 30: Brazil Carbon Emissions Market Value & Volume, 2021-2026 ($)
Figure 31: Brazil GDP and Population, 2018-2019 ($)
Figure 32: Brazil GDP – Composition of 2018, By Sector of Origin
Figure 33: Brazil Export and Import Value & Volume, 2018-2019 ($)
Figure 34: Venezuela Carbon Emissions Market Value & Volume, 2021-2026 ($)
Figure 35: Venezuela GDP and Population, 2018-2019 ($)
Figure 36: Venezuela GDP – Composition of 2018, By Sector of Origin
Figure 37: Venezuela Export and Import Value & Volume, 2018-2019 ($)
Figure 38: Argentina Carbon Emissions Market Value & Volume, 2021-2026 ($)
Figure 39: Argentina GDP and Population, 2018-2019 ($)
Figure 40: Argentina GDP – Composition of 2018, By Sector of Origin
Figure 41: Argentina Export and Import Value & Volume, 2018-2019 ($)
Figure 42: Ecuador Carbon Emissions Market Value & Volume, 2021-2026 ($)
Figure 43: Ecuador GDP and Population, 2018-2019 ($)
Figure 44: Ecuador GDP – Composition of 2018, By Sector of Origin
Figure 45: Ecuador Export and Import Value & Volume, 2018-2019 ($)
Figure 46: Peru Carbon Emissions Market Value & Volume, 2021-2026 ($)
Figure 47: Peru GDP and Population, 2018-2019 ($)
Figure 48: Peru GDP – Composition of 2018, By Sector of Origin
Figure 49: Peru Export and Import Value & Volume, 2018-2019 ($)
Figure 50: Colombia Carbon Emissions Market Value & Volume, 2021-2026 ($)
Figure 51: Colombia GDP and Population, 2018-2019 ($)
Figure 52: Colombia GDP – Composition of 2018, By Sector of Origin
Figure 53: Colombia Export and Import Value & Volume, 2018-2019 ($)
Figure 54: Costa Rica Carbon Emissions Market Value & Volume, 2021-2026 ($)
Figure 55: Costa Rica GDP and Population, 2018-2019 ($)
Figure 56: Costa Rica GDP – Composition of 2018, By Sector of Origin
Figure 57: Costa Rica Export and Import Value & Volume, 2018-2019 ($)
Figure 58: Europe Carbon Emissions Market Value & Volume, 2021-2026 ($)
Figure 59: U.K Carbon Emissions Market Value & Volume, 2021-2026 ($)
Figure 60: U.K GDP and Population, 2018-2019 ($)
Figure 61: U.K GDP – Composition of 2018, By Sector of Origin
Figure 62: U.K Export and Import Value & Volume, 2018-2019 ($)
Figure 63: Germany Carbon Emissions Market Value & Volume, 2021-2026 ($)
Figure 64: Germany GDP and Population, 2018-2019 ($)
Figure 65: Germany GDP – Composition of 2018, By Sector of Origin
Figure 66: Germany Export and Import Value & Volume, 2018-2019 ($)
Figure 67: Italy Carbon Emissions Market Value & Volume, 2021-2026 ($)
Figure 68: Italy GDP and Population, 2018-2019 ($)
Figure 69: Italy GDP – Composition of 2018, By Sector of Origin
Figure 70: Italy Export and Import Value & Volume, 2018-2019 ($)
Figure 71: France Carbon Emissions Market Value & Volume, 2021-2026 ($)
Figure 72: France GDP and Population, 2018-2019 ($)
Figure 73: France GDP – Composition of 2018, By Sector of Origin
Figure 74: France Export and Import Value & Volume, 2018-2019 ($)
Figure 75: Netherlands Carbon Emissions Market Value & Volume, 2021-2026 ($)
Figure 76: Netherlands GDP and Population, 2018-2019 ($)
Figure 77: Netherlands GDP – Composition of 2018, By Sector of Origin
Figure 78: Netherlands Export and Import Value & Volume, 2018-2019 ($)
Figure 79: Belgium Carbon Emissions Market Value & Volume, 2021-2026 ($)
Figure 80: Belgium GDP and Population, 2018-2019 ($)
Figure 81: Belgium GDP – Composition of 2018, By Sector of Origin
Figure 82: Belgium Export and Import Value & Volume, 2018-2019 ($)
Figure 83: Spain Carbon Emissions Market Value & Volume, 2021-2026 ($)
Figure 84: Spain GDP and Population, 2018-2019 ($)
Figure 85: Spain GDP – Composition of 2018, By Sector of Origin
Figure 86: Spain Export and Import Value & Volume, 2018-2019 ($)
Figure 87: Denmark Carbon Emissions Market Value & Volume, 2021-2026 ($)
Figure 88: Denmark GDP and Population, 2018-2019 ($)
Figure 89: Denmark GDP – Composition of 2018, By Sector of Origin
Figure 90: Denmark Export and Import Value & Volume, 2018-2019 ($)
Figure 91: APAC Carbon Emissions Market Value & Volume, 2021-2026 ($)
Figure 92: China Carbon Emissions Market Value & Volume, 2021-2026
Figure 93: China GDP and Population, 2018-2019 ($)
Figure 94: China GDP – Composition of 2018, By Sector of Origin
Figure 95: China Export and Import Value & Volume, 2018-2019 ($) Carbon Emissions Market China Export and Import Value & Volume, 2018-2019 ($)
Figure 96: Australia Carbon Emissions Market Value & Volume, 2021-2026 ($)
Figure 97: Australia GDP and Population, 2018-2019 ($)
Figure 98: Australia GDP – Composition of 2018, By Sector of Origin
Figure 99: Australia Export and Import Value & Volume, 2018-2019 ($)
Figure 100: South Korea Carbon Emissions Market Value & Volume, 2021-2026 ($)
Figure 101: South Korea GDP and Population, 2018-2019 ($)
Figure 102: South Korea GDP – Composition of 2018, By Sector of Origin
Figure 103: South Korea Export and Import Value & Volume, 2018-2019 ($)
Figure 104: India Carbon Emissions Market Value & Volume, 2021-2026 ($)
Figure 105: India GDP and Population, 2018-2019 ($)
Figure 106: India GDP – Composition of 2018, By Sector of Origin
Figure 107: India Export and Import Value & Volume, 2018-2019 ($)
Figure 108: Taiwan Carbon Emissions Market Value & Volume, 2021-2026 ($)
Figure 109: Taiwan GDP and Population, 2018-2019 ($)
Figure 110: Taiwan GDP – Composition of 2018, By Sector of Origin
Figure 111: Taiwan Export and Import Value & Volume, 2018-2019 ($)
Figure 112: Malaysia Carbon Emissions Market Value & Volume, 2021-2026 ($)
Figure 113: Malaysia GDP and Population, 2018-2019 ($)
Figure 114: Malaysia GDP – Composition of 2018, By Sector of Origin
Figure 115: Malaysia Export and Import Value & Volume, 2018-2019 ($)
Figure 116: Hong Kong Carbon Emissions Market Value & Volume, 2021-2026 ($)
Figure 117: Hong Kong GDP and Population, 2018-2019 ($)
Figure 118: Hong Kong GDP – Composition of 2018, By Sector of Origin
Figure 119: Hong Kong Export and Import Value & Volume, 2018-2019 ($)
Figure 120: Middle East & Africa Carbon Emissions Market Middle East & Africa 3D Printing Market Value & Volume, 2021-2026 ($)
Figure 121: Russia Carbon Emissions Market Value & Volume, 2021-2026 ($)
Figure 122: Russia GDP and Population, 2018-2019 ($)
Figure 123: Russia GDP – Composition of 2018, By Sector of Origin
Figure 124: Russia Export and Import Value & Volume, 2018-2019 ($)
Figure 125: Israel Carbon Emissions Market Value & Volume, 2021-2026 ($)
Figure 126: Israel GDP and Population, 2018-2019 ($)
Figure 127: Israel GDP – Composition of 2018, By Sector of Origin
Figure 128: Israel Export and Import Value & Volume, 2018-2019 ($)
Figure 129: Entropy Share, By Strategies, 2018-2019* (%) Carbon Emissions Market
Figure 130: Developments, 2018-2019* Carbon Emissions Market
Figure 131: Company 1 Carbon Emissions Market Net Revenue, By Years, 2018-2019* ($)
Figure 132: Company 1 Carbon Emissions Market Net Revenue Share, By Business segments, 2018 (%)
Figure 133: Company 1 Carbon Emissions Market Net Sales Share, By Geography, 2018 (%)
Figure 134: Company 2 Carbon Emissions Market Net Revenue, By Years, 2018-2019* ($)
Figure 135: Company 2 Carbon Emissions Market Net Revenue Share, By Business segments, 2018 (%)
Figure 136: Company 2 Carbon Emissions Market Net Sales Share, By Geography, 2018 (%)
Figure 137: Company 3 Carbon Emissions Market Net Revenue, By Years, 2018-2019* ($)
Figure 138: Company 3 Carbon Emissions Market Net Revenue Share, By Business segments, 2018 (%)
Figure 139: Company 3 Carbon Emissions Market Net Sales Share, By Geography, 2018 (%)
Figure 140: Company 4 Carbon Emissions Market Net Revenue, By Years, 2018-2019* ($)
Figure 141: Company 4 Carbon Emissions Market Net Revenue Share, By Business segments, 2018 (%)
Figure 142: Company 4 Carbon Emissions Market Net Sales Share, By Geography, 2018 (%)
Figure 143: Company 5 Carbon Emissions Market Net Revenue, By Years, 2018-2019* ($)
Figure 144: Company 5 Carbon Emissions Market Net Revenue Share, By Business segments, 2018 (%)
Figure 145: Company 5 Carbon Emissions Market Net Sales Share, By Geography, 2018 (%)
Figure 146: Company 6 Carbon Emissions Market Net Revenue, By Years, 2018-2019* ($)
Figure 147: Company 6 Carbon Emissions Market Net Revenue Share, By Business segments, 2018 (%)
Figure 148: Company 6 Carbon Emissions Market Net Sales Share, By Geography, 2018 (%)
Figure 149: Company 7 Carbon Emissions Market Net Revenue, By Years, 2018-2019* ($)
Figure 150: Company 7 Carbon Emissions Market Net Revenue Share, By Business segments, 2018 (%)
Figure 151: Company 7 Carbon Emissions Market Net Sales Share, By Geography, 2018 (%)
Figure 152: Company 8 Carbon Emissions Market Net Revenue, By Years, 2018-2019* ($)
Figure 153: Company 8 Carbon Emissions Market Net Revenue Share, By Business segments, 2018 (%)
Figure 154: Company 8 Carbon Emissions Market Net Sales Share, By Geography, 2018 (%)
Figure 155: Company 9 Carbon Emissions Market Net Revenue, By Years, 2018-2019* ($)
Figure 156: Company 9 Carbon Emissions Market Net Revenue Share, By Business segments, 2018 (%)
Figure 157: Company 9 Carbon Emissions Market Net Sales Share, By Geography, 2018 (%)
Figure 158: Company 10 Carbon Emissions Market Net Revenue, By Years, 2018-2019* ($)
Figure 159: Company 10 Carbon Emissions Market Net Revenue Share, By Business segments, 2018 (%)
Figure 160: Company 10 Carbon Emissions Market Net Sales Share, By Geography, 2018 (%)
Figure 161: Company 11 Carbon Emissions Market Net Revenue, By Years, 2018-2019* ($)
Figure 162: Company 11 Carbon Emissions Market Net Revenue Share, By Business segments, 2018 (%)
Figure 163: Company 11 Carbon Emissions Market Net Sales Share, By Geography, 2018 (%)
Figure 164: Company 12 Carbon Emissions Market Net Revenue, By Years, 2018-2019* ($)
Figure 165: Company 12 Carbon Emissions Market Net Revenue Share, By Business segments, 2018 (%)
Figure 166: Company 12 Carbon Emissions Market Net Sales Share, By Geography, 2018 (%)
Figure 167: Company 13 Carbon Emissions Market Net Revenue, By Years, 2018-2019* ($)
Figure 168: Company 13 Carbon Emissions Market Net Revenue Share, By Business segments, 2018 (%)
Figure 169: Company 13 Carbon Emissions Market Net Sales Share, By Geography, 2018 (%)
Figure 170: Company 14 Carbon Emissions Market Net Revenue, By Years, 2018-2019* ($)
Figure 171: Company 14 Carbon Emissions Market Net Revenue Share, By Business segments, 2018 (%)
Figure 172: Company 14 Carbon Emissions Market Net Sales Share, By Geography, 2018 (%)
Figure 173: Company 15 Carbon Emissions Market Net Revenue, By Years, 2018-2019* ($)
Figure 174: Company 15 Carbon Emissions Market Net Revenue Share, By Business segments, 2018 (%)
Figure 175: Company 15 Carbon Emissions Market Net Sales Share, By Geography, 2018 (%)