 Email
Email Print
Print


Cell based assay is defined as a technique for analysing the living cell on the basis of different parameters. This technology is basically used to measure virtually of cellular or biochemical functions. Functional cells are used as diagnostic tools in research for new drugs in the cell based assays technique. Cell based assays helps in measuring cell proliferations, motility, toxicity, production of a measurable product and morphology in diagnostics and drug discovery. This technique is used by pharmaceutical companies, academic research institutes, biotechnology companies, government institutions, contract research organizations and others. Cell based assays also facilitate research in the area of stem cells, cancer, immunology and others.
This report identifies the cell based assays market size in for the year 2014-2016, and forecast of the same for year 2021. It also highlights the potential growth opportunities in the coming years, while also reviewing the market drivers, restraints, growth indicators, challenges, market dynamics, competitive landscape, and other key aspects with respect to cell based assays market.
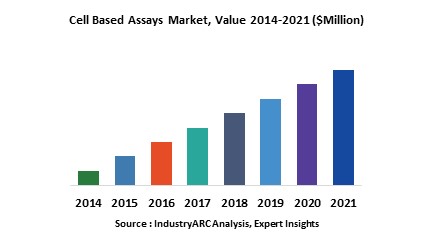
Globally North America dominated the market for cell based assays in 2015 due to higher increasing R&D activities and penetration of the cell based assays in end-use industry. North America is expected to continue its domination and was followed by Europe and Asia-Pacific as the second and third largest markets respectively in 2015. However Asia-Pacific is expected to be the fastest growing market due to technological advancement and increasing R&D activities in life science and drug activities.
This report on global cell based assays also covers different type of cell based assays available, applications of cell based assays, end-user industry and market size in various geographical regions.
Sample Companies Profiled in this Report are:
This report identifies the cell based assays market size in for the year 2014-2016, and forecast of the same for year 2021. It also highlights the potential growth opportunities in the coming years, while also reviewing the market drivers, restraints, growth indicators, challenges, market dynamics, competitive landscape, and other key aspects with respect to cell based assays market.
Globally North America dominated the market for cell based assays in 2015 due to higher increasing R&D activities and penetration of the cell based assays in end-use industry. North America is expected to continue its domination and was followed by Europe and Asia-Pacific as the second and third largest markets respectively in 2015. However Asia-Pacific is expected to be the fastest growing market due to technological advancement and increasing R&D activities in life science and drug activities.
This report on global cell based assays also covers different type of cell based assays available, applications of cell based assays, end-user industry and market size in various geographical regions.
- On the basis of type of cell based assays this report classifies as follows covering all major types of cell based assays available in the market: Consumables (Microplates, Cell Lines, Reagents & Assay Kits and Others), Instruments, Software and Service
- This report cell based assays market is also segmented on the basis of major end-use applications of cell based assays, some of the major applications oology and Other Applications
- This reportf cell based assays are: Drug Discovery, Basic Research, Predictive Toxic cell based assays market is also segmented on the basis of major end-use industry of cell based assays, some of the major end-use industry of cell based assays are: Pharmaceutical & Healthcare, Government Institutions and Others
- This report has been further segmented into major regions, which includes detailed analysis of each region such as North America, Europe, Asia-Pacific (APAC) and Rest of the World (RoW) covering all the major country level markets for cell based assays in each of the region.
Sample Companies Profiled in this Report are:
- Becton, Dickinson and Company
- General Electric Company
- Thermo Fisher Scientific Inc
- Cell Signaling Technology, Inc.
- Danaher Corporation
- 10+
1. Cell Based Assays – Market Overview
2. Executive Summary
3. Cell Based Assays Market Landscape
3.1. Market Share Analysis
3.2. Comparative Analysis
3.2.1. Product Benchmarking
3.2.2. End User Profiling
3.2.3. Top 5 Financials Analysis
4. Cell Based Assays – Market Forces
4.1. Drivers
4.1.1. Increasing government initiatives& funding to support and promote R&D
4.2. Restraints
4.2.1. High Infrastructure Cost
4.3. Opportunities
4.4. Challenges
4.5. Porter’s Five Forces Analysis
4.5.1. Bargaining Power of Suppliers
4.5.2. Bargaining Power of Buyers
4.5.3. Threat of New Entrants
4.5.4. Threat of Substitutes
4.5.5. Degree of Competition
5. Cell Based Assays Market – Strategic Analysis
5.1. Value Chain Analysis
5.2. Pricing Analysis
5.3. Opportunities Analysis
5.4. Product/Market Life Cycle Analysis
5.5. Suppliers and Distributors
6. Global Cell Based Assays Market, By Product Type
6.1. Consumables
6.1.1. Microplates
6.1.2. Cell Lines
6.1.3. Reagents & Assay Kits
6.1.4. Others
6.2. Instruments
6.3. Software
6.4. Service
7. Global Cell Based Assays Market, By Application
7.1. Drug Discovery
7.2. Basic Research
7.3. Predictive Toxicology
7.4. Other Applications
8. Global Cell Based Assays Market, By End-Use Industry
8.1. Pharmaceutical & Healthcare
8.2. Government Institutions
8.3. Others
9. Global Cell Based Assays Market, By Geography
9.1. Europe
9.1.1. Germany
9.1.2. France
9.1.3. Italy
9.1.4. Spain
9.1.5. Russia
9.1.6. U.K.
9.1.7. Rest of Europe
9.2. Asia Pacific
9.2.1. China
9.2.2. India
9.2.3. Japan
9.2.4. South Korea
9.2.5. Rest of Asia-Pacific
9.3. North America
9.3.1. U.S.
9.3.2. Canada
9.3.3. Mexico
9.4. Rest of the World (RoW)
9.4.1. Brazil
9.4.2. Rest of RoW
10. Cell Based Assays – Market Entropy
10.1. Expansion
10.2. Technological Developments
10.3. Merger & Acquisitions, and Joint Ventures
10.4. Supply- Contract
11. Company Profiles
11.1. Becton, Dickinson and Company
11.1.1. Introduction
11.1.2. Financials
11.1.3. Key Insights
11.1.4. Key Strategy
11.1.5. Product Portfolio
11.1.6. SWOT Analysis
11.2. General Electric Company
11.2.1. Introduction
11.2.2. Financials
11.2.3. Key Insights
11.2.4. Key Strategy
11.2.5. Product Portfolio
11.2.6. SWOT Analysis
11.3. Thermo Fisher Scientific Inc
11.3.1. Introduction
11.3.2. Financials
11.3.3. Key Insights
11.3.4. Key Strategy
11.3.5. Product Portfolio
11.3.6. SWOT Analysis
11.4. Cell Signaling Technology, Inc.
11.4.1. Introduction
11.4.2. Financials
11.4.3. Key Insights
11.4.4. Key Strategy
11.4.5. Product Portfolio
11.4.6. SWOT Analysis
11.5. Danaher Corporation
11.5.1. Introduction
11.5.2. Financials
11.5.3. Key Insights
11.5.4. Key Strategy
11.5.5. Product Portfolio
11.5.6. SWOT Analysis
11.6. Cisbio Bioassays
11.6.1. Introduction
11.6.2. Financials
11.6.3. Key Insights
11.6.4. Key Strategy
11.6.5. Product Portfolio
11.6.6. SWOT Analysis
11.7. Danaher Corporation
11.7.1. Introduction
11.7.2. Financials
11.7.3. Key Insights
11.7.4. Key Strategy
11.7.5. Product Portfolio
11.7.6. SWOT Analysis
11.8. Promega Corporation
11.8.1. Introduction
11.8.2. Financials
11.8.3. Key Insights
11.8.4. Key Strategy
11.8.5. Product Portfolio
11.8.6. SWOT Analysis
11.9. Merck & Co., Inc.
11.9.1. Introduction
11.9.2. Financials
11.9.3. Key Insights
11.9.4. Key Strategy
11.9.5. Product Portfolio
11.9.6. SWOT Analysis
11.10. Perkinelmer, Inc.
11.10.1. Introduction
11.10.2. Financials
11.10.3. Key Insights
11.10.4. Key Strategy
11.10.5. Product Portfolio
11.10.6. SWOT Analysis
*More than 10 Companies are profiled in this Research Report, Complete List available on Request*
"*Financials would be provided on a best efforts basis for private companies"
12. Appendix
12.1. Abbreviations
12.2. Sources
12.3. Research Methodology
12.4. Expert Insights
List of Tables:
Table 1: Cell Based Assays Market Overview 2021-2026
Table 2: Cell Based Assays Market Leader Analysis 2018-2019 (US$)
Table 3: Cell Based Assays Market Product Analysis 2018-2019 (US$)
Table 4: Cell Based Assays Market End User Analysis 2018-2019 (US$)
Table 5: Cell Based Assays Market Patent Analysis 2013-2018* (US$)
Table 6: Cell Based Assays Market Financial Analysis 2018-2019 (US$)
Table 7: Cell Based Assays Market Driver Analysis 2018-2019 (US$)
Table 8: Cell Based Assays Market Challenges Analysis 2018-2019 (US$)
Table 9: Cell Based Assays Market Constraint Analysis 2018-2019 (US$)
Table 10: Cell Based Assays Market Supplier Bargaining Power Analysis 2018-2019 (US$)
Table 11: Cell Based Assays Market Buyer Bargaining Power Analysis 2018-2019 (US$)
Table 12: Cell Based Assays Market Threat of Substitutes Analysis 2018-2019 (US$)
Table 13: Cell Based Assays Market Threat of New Entrants Analysis 2018-2019 (US$)
Table 14: Cell Based Assays Market Degree of Competition Analysis 2018-2019 (US$)
Table 15: Cell Based Assays Market Value Chain Analysis 2018-2019 (US$)
Table 16: Cell Based Assays Market Pricing Analysis 2021-2026 (US$)
Table 17: Cell Based Assays Market Opportunities Analysis 2021-2026 (US$)
Table 18: Cell Based Assays Market Product Life Cycle Analysis 2021-2026 (US$)
Table 19: Cell Based Assays Market Supplier Analysis 2018-2019 (US$)
Table 20: Cell Based Assays Market Distributor Analysis 2018-2019 (US$)
Table 21: Cell Based Assays Market Trend Analysis 2018-2019 (US$)
Table 22: Cell Based Assays Market Size 2018 (US$)
Table 23: Cell Based Assays Market Forecast Analysis 2021-2026 (US$)
Table 24: Cell Based Assays Market Sales Forecast Analysis 2021-2026 (Units)
Table 25: Cell Based Assays Market, Revenue & Volume,By Product Type, 2021-2026 ($)
Table 26: Cell Based Assays Market By Product Type, Revenue & Volume,By Consumables , 2021-2026 ($)
Table 27: Cell Based Assays Market By Product Type, Revenue & Volume,By Microplates , 2021-2026 ($)
Table 28: Cell Based Assays Market By Product Type, Revenue & Volume,By Cell Lines , 2021-2026 ($)
Table 29: Cell Based Assays Market By Product Type, Revenue & Volume,By Reagents & Assay Kits, 2021-2026 ($)
Table 30: Cell Based Assays Market By Product Type, Revenue & Volume,By Instruments, 2021-2026 ($)
Table 31: Cell Based Assays Market, Revenue & Volume,By Application, 2021-2026 ($)
Table 32: Cell Based Assays MarketBy Application, Revenue & Volume,By Drug Discovery , 2021-2026 ($)
Table 33: Cell Based Assays MarketBy Application, Revenue & Volume,By Basic Research , 2021-2026 ($)
Table 34: Cell Based Assays MarketBy Application, Revenue & Volume,By Predictive Toxicology , 2021-2026 ($)
Table 35: Cell Based Assays MarketBy Application, Revenue & Volume,By Application 4, 2021-2026 ($)
Table 36: Cell Based Assays MarketBy Application, Revenue & Volume,By Application 5, 2021-2026 ($)
Table 37: Cell Based Assays Market, Revenue & Volume,By End-Use Industry, 2021-2026 ($)
Table 38: Cell Based Assays MarketBy End-Use Industry, Revenue & Volume,By Pharmaceutical & Healthcare, 2021-2026 ($)
Table 39: Cell Based Assays MarketBy End-Use Industry, Revenue & Volume,By Government Institutions, 2021-2026 ($)
Table 40: Cell Based Assays MarketBy End-Use Industry, Revenue & Volume,By End Use 3, 2021-2026 ($)
Table 41: Cell Based Assays MarketBy End-Use Industry, Revenue & Volume,By End Use 4, 2021-2026 ($)
Table 42: Cell Based Assays MarketBy End-Use Industry, Revenue & Volume,By End Use 5, 2021-2026 ($)
Table 43: North America Cell Based Assays Market, Revenue & Volume,By Product Type, 2021-2026 ($)
Table 44: North America Cell Based Assays Market, Revenue & Volume,By Product, 2021-2026 ($)
Table 46: North America Cell Based Assays Market, Revenue & Volume,By Application, 2021-2026 ($)
Table 47: North America Cell Based Assays Market, Revenue & Volume,By End-Use Industry, 2021-2026 ($)
Table 48: South america Cell Based Assays Market, Revenue & Volume,By Product Type, 2021-2026 ($)
Table 49: South america Cell Based Assays Market, Revenue & Volume,By Product, 2021-2026 ($)
Table 51: South america Cell Based Assays Market, Revenue & Volume,By Application, 2021-2026 ($)
Table 52: South america Cell Based Assays Market, Revenue & Volume,By End-Use Industry, 2021-2026 ($)
Table 53: Europe Cell Based Assays Market, Revenue & Volume,By Product Type, 2021-2026 ($)
Table 54: Europe Cell Based Assays Market, Revenue & Volume,By Product, 2021-2026 ($)
Table 56: Europe Cell Based Assays Market, Revenue & Volume,By Application, 2021-2026 ($)
Table 57: Europe Cell Based Assays Market, Revenue & Volume,By End-Use Industry, 2021-2026 ($)
Table 58: APAC Cell Based Assays Market, Revenue & Volume,By Product Type, 2021-2026 ($)
Table 59: APAC Cell Based Assays Market, Revenue & Volume,By Product, 2021-2026 ($)
Table 61: APAC Cell Based Assays Market, Revenue & Volume,By Application, 2021-2026 ($)
Table 62: APAC Cell Based Assays Market, Revenue & Volume,By End-Use Industry, 2021-2026 ($)
Table 63: Middle East & Africa Cell Based Assays Market, Revenue & Volume,By Product Type, 2021-2026 ($)
Table 64: Middle East & Africa Cell Based Assays Market, Revenue & Volume,By Product, 2021-2026 ($)
Table 66: Middle East & Africa Cell Based Assays Market, Revenue & Volume,By Application, 2021-2026 ($)
Table 67: Middle East & Africa Cell Based Assays Market, Revenue & Volume,By End-Use Industry, 2021-2026 ($)
Table 68: Russia Cell Based Assays Market, Revenue & Volume,By Product Type, 2021-2026 ($)
Table 69: Russia Cell Based Assays Market, Revenue & Volume,By Product, 2021-2026 ($)
Table 71: Russia Cell Based Assays Market, Revenue & Volume,By Application, 2021-2026 ($)
Table 72: Russia Cell Based Assays Market, Revenue & Volume,By End-Use Industry, 2021-2026 ($)
Table 73: Israel Cell Based Assays Market, Revenue & Volume,By Product Type, 2021-2026 ($)
Table 74: Israel Cell Based Assays Market, Revenue & Volume,By Product, 2021-2026 ($)
Table 76: Israel Cell Based Assays Market, Revenue & Volume,By Application, 2021-2026 ($)
Table 77: Israel Cell Based Assays Market, Revenue & Volume,By End-Use Industry, 2021-2026 ($)
Table 78: Top Companies 2018 (US$) Cell Based Assays Market, Revenue & Volume
Table 79: Product Launch 2018-2019 Cell Based Assays Market, Revenue & Volume
Table 80: Mergers & Acquistions 2018-2019 Cell Based Assays Market, Revenue & Volume
List of Figures:
Figure 1: Overview of Cell Based Assays Market 2021-2026
Figure 2: Market Share Analysis for Cell Based Assays Market 2018 (US$)
Figure 3: Product Comparison in Cell Based Assays Market 2018-2019 (US$)
Figure 4: End User Profile for Cell Based Assays Market 2018-2019 (US$)
Figure 5: Patent Application and Grant in Cell Based Assays Market 2013-2018* (US$)
Figure 6: Top 5 Companies Financial Analysis in Cell Based Assays Market 2018-2019 (US$)
Figure 7: Market Entry Strategy in Cell Based Assays Market 2018-2019
Figure 8: Ecosystem Analysis in Cell Based Assays Market 2018
Figure 9: Average Selling Price in Cell Based Assays Market 2021-2026
Figure 10: Top Opportunities in Cell Based Assays Market 2018-2019
Figure 11: Market Life Cycle Analysis in Cell Based Assays Market
Figure 12: Global By Product Type Cell Based Assays Market Revenue, 2021-2026 ($)
Figure 13: Global By Product Cell Based Assays Market Revenue, 2021-2026 ($)
Figure 14: Global By Application Cell Based Assays Market Revenue, 2021-2026 ($)
Figure 15: Global By End-Use Industry Cell Based Assays Market Revenue, 2021-2026 ($)
Figure 16: Global Cell Based Assays Market - By Geography
Figure 17: Global Cell Based Assays Market Value & Volume, By Geography, 2021-2026 ($)
Figure 18: Global Cell Based Assays Market CAGR, By Geography, 2021-2026 (%)
Figure 19: North America Cell Based Assays Market Value & Volume, 2021-2026 ($)
Figure 20: US Cell Based Assays Market Value & Volume, 2021-2026 ($)
Figure 21: US GDP and Population, 2018-2019 ($)
Figure 22: US GDP – Composition of 2018, By Sector of Origin
Figure 23: US Export and Import Value & Volume, 2018-2019 ($)
Figure 24: Canada Cell Based Assays Market Value & Volume, 2021-2026 ($)
Figure 25: Canada GDP and Population, 2018-2019 ($)
Figure 26: Canada GDP – Composition of 2018, By Sector of Origin
Figure 27: Canada Export and Import Value & Volume, 2018-2019 ($)
Figure 28: Mexico Cell Based Assays Market Value & Volume, 2021-2026 ($)
Figure 29: Mexico GDP and Population, 2018-2019 ($)
Figure 30: Mexico GDP – Composition of 2018, By Sector of Origin
Figure 31: Mexico Export and Import Value & Volume, 2018-2019 ($)
Figure 32: South America Cell Based Assays Market South America 3D Printing Market Value & Volume, 2021-2026 ($)
Figure 33: Brazil Cell Based Assays Market Value & Volume, 2021-2026 ($)
Figure 34: Brazil GDP and Population, 2018-2019 ($)
Figure 35: Brazil GDP – Composition of 2018, By Sector of Origin
Figure 36: Brazil Export and Import Value & Volume, 2018-2019 ($)
Figure 37: Venezuela Cell Based Assays Market Value & Volume, 2021-2026 ($)
Figure 38: Venezuela GDP and Population, 2018-2019 ($)
Figure 39: Venezuela GDP – Composition of 2018, By Sector of Origin
Figure 40: Venezuela Export and Import Value & Volume, 2018-2019 ($)
Figure 41: Argentina Cell Based Assays Market Value & Volume, 2021-2026 ($)
Figure 42: Argentina GDP and Population, 2018-2019 ($)
Figure 43: Argentina GDP – Composition of 2018, By Sector of Origin
Figure 44: Argentina Export and Import Value & Volume, 2018-2019 ($)
Figure 45: Ecuador Cell Based Assays Market Value & Volume, 2021-2026 ($)
Figure 46: Ecuador GDP and Population, 2018-2019 ($)
Figure 47: Ecuador GDP – Composition of 2018, By Sector of Origin
Figure 48: Ecuador Export and Import Value & Volume, 2018-2019 ($)
Figure 49: Peru Cell Based Assays Market Value & Volume, 2021-2026 ($)
Figure 50: Peru GDP and Population, 2018-2019 ($)
Figure 51: Peru GDP – Composition of 2018, By Sector of Origin
Figure 52: Peru Export and Import Value & Volume, 2018-2019 ($)
Figure 53: Colombia Cell Based Assays Market Value & Volume, 2021-2026 ($)
Figure 54: Colombia GDP and Population, 2018-2019 ($)
Figure 55: Colombia GDP – Composition of 2018, By Sector of Origin
Figure 56: Colombia Export and Import Value & Volume, 2018-2019 ($)
Figure 57: Costa Rica Cell Based Assays MarketCosta Rica 3D Printing Market Value & Volume, 2021-2026 ($)
Figure 58: Costa Rica GDP and Population, 2018-2019 ($)
Figure 59: Costa Rica GDP – Composition of 2018, By Sector of Origin
Figure 60: Costa Rica Export and Import Value & Volume, 2018-2019 ($)
Figure 61: Europe Cell Based Assays Market Value & Volume, 2021-2026 ($)
Figure 62: U.K Cell Based Assays Market Value & Volume, 2021-2026 ($)
Figure 63: U.K GDP and Population, 2018-2019 ($)
Figure 64: U.K GDP – Composition of 2018, By Sector of Origin
Figure 65: U.K Export and Import Value & Volume, 2018-2019 ($)
Figure 66: Germany Cell Based Assays Market Value & Volume, 2021-2026 ($)
Figure 67: Germany GDP and Population, 2018-2019 ($)
Figure 68: Germany GDP – Composition of 2018, By Sector of Origin
Figure 69: Germany Export and Import Value & Volume, 2018-2019 ($)
Figure 70: Italy Cell Based Assays Market Value & Volume, 2021-2026 ($)
Figure 71: Italy GDP and Population, 2018-2019 ($)
Figure 72: Italy GDP – Composition of 2018, By Sector of Origin
Figure 73: Italy Export and Import Value & Volume, 2018-2019 ($)
Figure 74: France Cell Based Assays Market Value & Volume, 2021-2026 ($)
Figure 75: France GDP and Population, 2018-2019 ($)
Figure 76: France GDP – Composition of 2018, By Sector of Origin
Figure 77: France Export and Import Value & Volume, 2018-2019 ($)
Figure 78: Netherlands Cell Based Assays Market Value & Volume, 2021-2026 ($)
Figure 79: Netherlands GDP and Population, 2018-2019 ($)
Figure 80: Netherlands GDP – Composition of 2018, By Sector of Origin
Figure 81: Netherlands Export and Import Value & Volume, 2018-2019 ($)
Figure 82: Belgium Cell Based Assays Market Value & Volume, 2021-2026 ($)
Figure 83: Belgium GDP and Population, 2018-2019 ($)
Figure 84: Belgium GDP – Composition of 2018, By Sector of Origin
Figure 85: Belgium Export and Import Value & Volume, 2018-2019 ($)
Figure 86: Spain Cell Based Assays Market Value & Volume, 2021-2026 ($)
Figure 87: Spain GDP and Population, 2018-2019 ($)
Figure 88: Spain GDP – Composition of 2018, By Sector of Origin
Figure 89: Spain Export and Import Value & Volume, 2018-2019 ($)
Figure 90: Denmark Cell Based Assays Market Value & Volume, 2021-2026 ($)
Figure 91: Denmark GDP and Population, 2018-2019 ($)
Figure 92: Denmark GDP – Composition of 2018, By Sector of Origin
Figure 93: Denmark Export and Import Value & Volume, 2018-2019 ($)
Figure 94: APAC Cell Based Assays Market Value & Volume, 2021-2026 ($)
Figure 95: China Cell Based Assays MarketValue & Volume, 2021-2026
Figure 96: China GDP and Population, 2018-2019 ($)
Figure 97: China GDP – Composition of 2018, By Sector of Origin
Figure 98: China Export and Import Value & Volume, 2018-2019 ($)Cell Based Assays MarketChina Export and Import Value & Volume, 2018-2019 ($)
Figure 99: Australia Cell Based Assays Market Value & Volume, 2021-2026 ($)
Figure 100: Australia GDP and Population, 2018-2019 ($)
Figure 101: Australia GDP – Composition of 2018, By Sector of Origin
Figure 102: Australia Export and Import Value & Volume, 2018-2019 ($)
Figure 103: South Korea Cell Based Assays Market Value & Volume, 2021-2026 ($)
Figure 104: South Korea GDP and Population, 2018-2019 ($)
Figure 105: South Korea GDP – Composition of 2018, By Sector of Origin
Figure 106: South Korea Export and Import Value & Volume, 2018-2019 ($)
Figure 107: India Cell Based Assays Market Value & Volume, 2021-2026 ($)
Figure 108: India GDP and Population, 2018-2019 ($)
Figure 109: India GDP – Composition of 2018, By Sector of Origin
Figure 110: India Export and Import Value & Volume, 2018-2019 ($)
Figure 111: Taiwan Cell Based Assays MarketTaiwan 3D Printing Market Value & Volume, 2021-2026 ($)
Figure 112: Taiwan GDP and Population, 2018-2019 ($)
Figure 113: Taiwan GDP – Composition of 2018, By Sector of Origin
Figure 114: Taiwan Export and Import Value & Volume, 2018-2019 ($)
Figure 115: Malaysia Cell Based Assays MarketMalaysia 3D Printing Market Value & Volume, 2021-2026 ($)
Figure 116: Malaysia GDP and Population, 2018-2019 ($)
Figure 117: Malaysia GDP – Composition of 2018, By Sector of Origin
Figure 118: Malaysia Export and Import Value & Volume, 2018-2019 ($)
Figure 119: Hong Kong Cell Based Assays MarketHong Kong 3D Printing Market Value & Volume, 2021-2026 ($)
Figure 120: Hong Kong GDP and Population, 2018-2019 ($)
Figure 121: Hong Kong GDP – Composition of 2018, By Sector of Origin
Figure 122: Hong Kong Export and Import Value & Volume, 2018-2019 ($)
Figure 123: Middle East & Africa Cell Based Assays MarketMiddle East & Africa 3D Printing Market Value & Volume, 2021-2026 ($)
Figure 124: Russia Cell Based Assays MarketRussia 3D Printing Market Value & Volume, 2021-2026 ($)
Figure 125: Russia GDP and Population, 2018-2019 ($)
Figure 126: Russia GDP – Composition of 2018, By Sector of Origin
Figure 127: Russia Export and Import Value & Volume, 2018-2019 ($)
Figure 128: Israel Cell Based Assays Market Value & Volume, 2021-2026 ($)
Figure 129: Israel GDP and Population, 2018-2019 ($)
Figure 130: Israel GDP – Composition of 2018, By Sector of Origin
Figure 131: Israel Export and Import Value & Volume, 2018-2019 ($)
Figure 132: Entropy Share, By Strategies, 2018-2019* (%)Cell Based Assays Market
Figure 133: Developments, 2018-2019*Cell Based Assays Market
Figure 134: Company 1 Cell Based Assays Market Net Revenue, By Years, 2018-2019* ($)
Figure 135: Company 1 Cell Based Assays Market Net Revenue Share, By Business segments, 2018 (%)
Figure 136: Company 1 Cell Based Assays Market Net Sales Share, By Geography, 2018 (%)
Figure 137: Company 2 Cell Based Assays Market Net Revenue, By Years, 2018-2019* ($)
Figure 138: Company 2 Cell Based Assays Market Net Revenue Share, By Business segments, 2018 (%)
Figure 139: Company 2 Cell Based Assays Market Net Sales Share, By Geography, 2018 (%)
Figure 140: Company 3Cell Based Assays Market Net Revenue, By Years, 2018-2019* ($)
Figure 141: Company 3Cell Based Assays Market Net Revenue Share, By Business segments, 2018 (%)
Figure 142: Company 3Cell Based Assays Market Net Sales Share, By Geography, 2018 (%)
Figure 143: Company 4 Cell Based Assays Market Net Revenue, By Years, 2018-2019* ($)
Figure 144: Company 4 Cell Based Assays Market Net Revenue Share, By Business segments, 2018 (%)
Figure 145: Company 4 Cell Based Assays Market Net Sales Share, By Geography, 2018 (%)
Figure 146: Company 5 Cell Based Assays Market Net Revenue, By Years, 2018-2019* ($)
Figure 147: Company 5 Cell Based Assays Market Net Revenue Share, By Business segments, 2018 (%)
Figure 148: Company 5 Cell Based Assays Market Net Sales Share, By Geography, 2018 (%)
Figure 149: Company 6 Cell Based Assays Market Net Revenue, By Years, 2018-2019* ($)
Figure 150: Company 6 Cell Based Assays Market Net Revenue Share, By Business segments, 2018 (%)
Figure 151: Company 6 Cell Based Assays Market Net Sales Share, By Geography, 2018 (%)
Figure 152: Company 7 Cell Based Assays Market Net Revenue, By Years, 2018-2019* ($)
Figure 153: Company 7 Cell Based Assays Market Net Revenue Share, By Business segments, 2018 (%)
Figure 154: Company 7 Cell Based Assays Market Net Sales Share, By Geography, 2018 (%)
Figure 155: Company 8 Cell Based Assays Market Net Revenue, By Years, 2018-2019* ($)
Figure 156: Company 8 Cell Based Assays Market Net Revenue Share, By Business segments, 2018 (%)
Figure 157: Company 8 Cell Based Assays Market Net Sales Share, By Geography, 2018 (%)
Figure 158: Company 9 Cell Based Assays Market Net Revenue, By Years, 2018-2019* ($)
Figure 159: Company 9 Cell Based Assays Market Net Revenue Share, By Business segments, 2018 (%)
Figure 160: Company 9 Cell Based Assays Market Net Sales Share, By Geography, 2018 (%)
Figure 161: Company 10 Cell Based Assays Market Net Revenue, By Years, 2018-2019* ($)
Figure 162: Company 10 Cell Based Assays Market Net Revenue Share, By Business segments, 2018 (%)
Figure 163: Company 10 Cell Based Assays Market Net Sales Share, By Geography, 2018 (%)
Figure 164: Company 11 Cell Based Assays Market Net Revenue, By Years, 2018-2019* ($)
Figure 165: Company 11 Cell Based Assays Market Net Revenue Share, By Business segments, 2018 (%)
Figure 166: Company 11 Cell Based Assays Market Net Sales Share, By Geography, 2018 (%)
Figure 167: Company 12 Cell Based Assays Market Net Revenue, By Years, 2018-2019* ($)
Figure 168: Company 12 Cell Based Assays Market Net Revenue Share, By Business segments, 2018 (%)
Figure 169: Company 12 Cell Based Assays Market Net Sales Share, By Geography, 2018 (%)
Figure 170: Company 13Cell Based Assays Market Net Revenue, By Years, 2018-2019* ($)
Figure 171: Company 13Cell Based Assays Market Net Revenue Share, By Business segments, 2018 (%)
Figure 172: Company 13Cell Based Assays Market Net Sales Share, By Geography, 2018 (%)
Figure 173: Company 14 Cell Based Assays Market Net Revenue, By Years, 2018-2019* ($)
Figure 174: Company 14 Cell Based Assays Market Net Revenue Share, By Business segments, 2018 (%)
Figure 175: Company 14 Cell Based Assays Market Net Sales Share, By Geography, 2018 (%)
Figure 176: Company 15 Cell Based Assays Market Net Revenue, By Years, 2018-2019* ($)
Figure 177: Company 15 Cell Based Assays Market Net Revenue Share, By Business segments, 2018 (%)
Figure 178: Company 15 Cell Based Assays Market Net Sales Share, By Geography, 2018 (%)