 Email
Email Print
Print


Rain Sensor Market Overview
The Rain Sensor Market size is estimated at USD 1.23 billion in 2024, and is expected to reach USD 1.9 billion by 2030, growing at a CAGR of 7.20% during the forecast period (2024-2030). The integration of rain sensors into smart home systems represents a significant advancement in home automation technology. By seamlessly incorporating rain detection capabilities into smart home ecosystems, homeowners can enjoy a range of benefits that enhance convenience, efficiency, and sustainability. Imagine a scenario where, upon detecting rainfall, the smart home system automatically triggers actions such as closing windows to prevent water ingress, activating irrigation systems to pause watering schedules, and adjusting outdoor lighting to conserve energy. This level of automation not only simplifies daily tasks for homeowners but also contributes to water conservation efforts by ensuring that resources are used more efficiently. Overall, the integration of rain sensors into smart home systems exemplifies the potential of technology to enhance both the functionality and environmental responsibility of modern households. The trend towards adopting advanced sensing technologies in rain sensors marks a significant evolution in the field, promising heightened accuracy and versatility in rain detection systems. These advancements encompass a spectrum of innovations, ranging from enhanced detection algorithms to bolstered measurement capabilities, all aimed at refining the performance of rain sensors. Furthermore, the integration of supplementary environmental sensors, such as temperature and humidity sensors, enriches the data collected, enabling a more holistic understanding of weather conditions. This comprehensive approach not only enhances the reliability and precision of rain sensors but also extends their utility across diverse applications. From automotive rain-sensing wipers that adjust wiping frequency based on real-time rainfall intensity to weather monitoring systems that provide detailed meteorological insights, and agricultural automation systems that optimize irrigation schedules in response to precipitation patterns, advanced sensing technologies empower a new era of efficiency and effectiveness in rain detection and management.
The report: – Automotive Rain Sensor Market Forecast (2024-2030)”, by IndustryARC, covers an in-depth analysis of the following segments of the Lithium Polymer Battery.
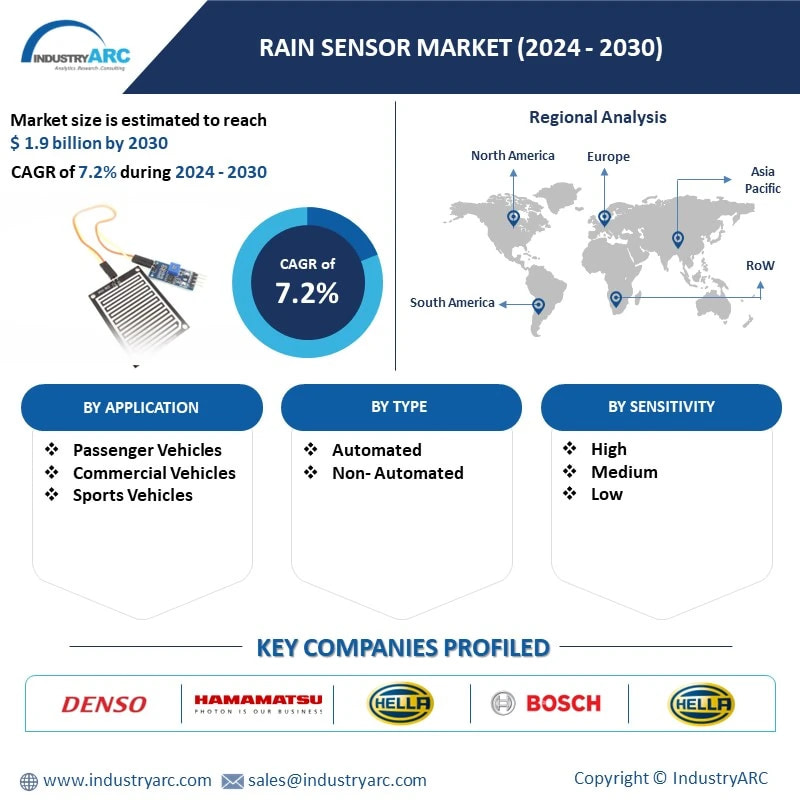
By Application: Passenger Vehicles, Commercial Vehicles, Sports Vehicles
By Type: Automated, Non- Automated
By Sensitivity: High, Medium, LOW
By Geography - North America (U.S, Canada, Mexico), Europe (Germany, UK, France, Italy, Spain, Russia and Others), APAC (China, Japan India, SK, Aus and Others), South America (Brazil, Argentina and others), and RoW (Middle East and Africa).
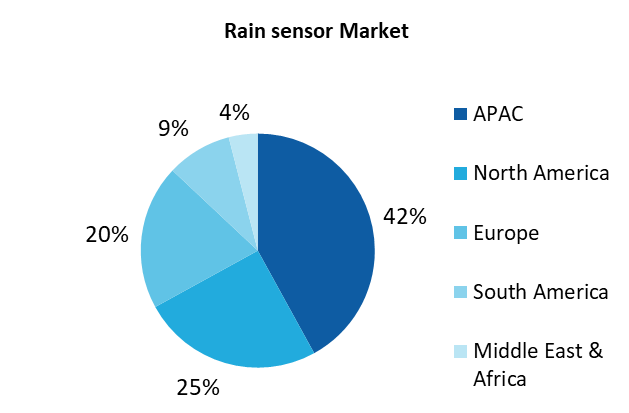
Rain sensor Market Segment Analysis - By Geography
During the projected period, the Asia-Pacific region is anticipated to maintain its leadership position, exhibiting the highest Compound Annual Growth Rate (CAGR). This dominance is attributed to the robust economic expansion observed in emerging nations such as China and India, which is anticipated to drive future demand for passenger vehicles. Consequently, global automotive manufacturers are likely to channel significant investments into advanced technologies and modern mass production systems, thereby stimulating the market demand for automotive rain-sensing wiper systems. Additionally, escalating investments in infrastructure development and industrialization are anticipated to further bolster demand for commercial vehicles in the region. According to findings from a comprehensive market study report, Asia-Pacific is poised to remain the dominant force in the rain-sensing windshield wipers market throughout the forecast period. Notably, major contributions to this market are expected from countries including China, India, Indonesia, Japan, and South Korea.
Rain sensor Market Share (%) By Region, 2023
For More Details on This Report - Request for Sample
Rain sensor Market Drivers
Increasing Awareness Regarding Safety and Comfort Anticipated to Stimulate Demand
The rain sensor functions as a driver assistance system, relieving drivers of the burden by automatically activating the windshield wiper system in rainy conditions, thereby notably enhancing both in-vehicle safety and comfort. The growing interest among consumers in autonomous cars and connected vehicles is expected to lead to broader acceptance over the forecast period. Advanced driver assistance systems (ADAS) featured in these vehicles are projected to narrow the penetration gap between traditional cars and future vehicles. While some governments are mandating specific ADAS features for vehicles operating within their jurisdictions, others are concentrating on formulating and implementing standards for ADAS features and their associated specifications to enhance vehicle performance.
Rain sensor Market Challenges
Overcoming Weather Variability
Rain sensors must operate effectively and reliably across a wide range of weather conditions, including heavy rain, light drizzle, snow, and fog. Developing sensors that can accurately detect precipitation in diverse environments poses a challenge, as different weather patterns and geographic locations may require varying sensor designs and algorithms. Ensuring consistent performance under adverse weather conditions is crucial for maintaining driver safety and satisfaction. Additionally, false positives or false negatives can lead to inconvenience or safety hazards, emphasizing the need for robust and reliable rain sensing technology. Addressing these challenges requires extensive testing and validation procedures to optimize sensor performance across different climates and weather scenarios. Moreover, advancements in sensor technology, such as the integration of AI algorithms and machine learning, may help improve the accuracy and reliability of rain sensors in various weather conditions.
Rain sensor Market Landscape
Product launches, acquisitions, and R&D activities are key strategies adopted by players in the Rain sensor Market.
- Denso Corporation
- Hamamatsu Photonics K.K.,
- Hella KGAA Hueck & Co
- obert Bosch GmbH
- The Kostal Group
- HELLA GmbH & Co. KGaA
- ams-OSRAM International GmbH
- ZF Friedrichshafen AG
- STMicroelectronics
- Analog Devices Inc
Recent Developments
• In March 2022, StradVision and ZF announced a partnership to expand their automated driving perception software portfolio. StradVision's SVNet software could enable vehicles to detect and identify objects even in adverse weather or low-light conditions, environmental sensor fusion for shuttles, and commercial and light vehicles that could be optimized for centralized electrical architectures.
• In July 2021, After the partnership with LiDAR expert AEye, Continental could integrate the long-range LiDAR technology into its full sensor stack solution to create the first full-stack automotive-grade system for Level 2+ up to Level 4 automated and autonomous driving applications. The solution based on AEye's LiDAR technology is a substantial part of the sensor setup for high-level automation systems
For more Automation and Instrumentation Market reports, please click here
1. Rain sensor Market - Overview
1.1. Definitions and Scope
2. Rain sensor Market - Executive Summary
3. Rain sensor Market - Comparative Analysis
3.1. Company Benchmarking - Key Companies
3.2. Global Financial Analysis - Key Companies
3.3. Market Share Analysis - Key Companies
3.4. Patent Analysis
3.5. Pricing Analysis
4. Rain sensor Market - Start-up Companies Scenario Premium
4.1. Key Start-up Company Analysis by
4.1.1. Investment
4.1.2. Revenue
4.1.3. Venture Capital and Funding Scenario
5. Rain sensor Market – Market Entry Scenario Premium Premium
5.1. Regulatory Framework Overview
5.2. New Business and Ease of Doing Business Index
5.3. Case Studies of Successful Ventures
6. Rain sensor Market - Forces
6.1. Market Drivers
6.2. Market Constraints
6.3. Market Challenges
6.4. Porter's Five Force Model
6.4.1. Bargaining Power of Suppliers
6.4.2. Bargaining Powers of Customers
6.4.3. Threat of New Entrants
6.4.4. Rivalry Among Existing Players
6.4.5. Threat of Substitutes
7. Rain sensor Market – Strategic Analysis
7.1.Value Chain Analysis
7.2.Opportunities Analysis
7.3.Market Life Cycle
7.4.Suppliers and distributors Analysis
8. Rain sensor Market – By Application (Market Size -$Million/Billion)
8.1 Passenger Vehicles
8.2 Commercial Vehicles
8.3 Sports Vehicles
9. Rain sensor Market – By Type (Market Size -$Million/Billion)
9.1 Automated
9.2 Non-Automated
10. Rain sensor Market – By Sensitivity (Market Size -$Million/Billion)
10.1 High
10.2 Medium
10.3LOW
11. Rain sensor Market - By Geography (Market Size -$Million/Billion)
11.1 North America
11.1.1 U.S.
11.1.2 Canada
11.1.3 Mexico
11.2 South America
11.2.1 Brazil
11.2.2 Argentina
11.2.3 Chile
11.2.4 Colombia
11.2.5 Rest of Americas
11.3 Europe
11.3.1 U.K.
11.3.2 Germany
11.3.3 France
11.3.4 Italy
11.3.5 Spain
11.3.6 Russia
11.3.7 Netherlands
11.3.8 Rest of Europe
11.4 Asia-Pacific (APAC)
11.4.1 China
11.4.2 Japan
11.4.3 India
11.4.4 South Korea
11.4.5 Australia & New Zealand
11.4.6 Singapore
11.4.7 Malaysia
11.4.8 Taiwan
11.4.9 Indonesia
11.4.10 Rest of APAC
11.5 Rest of World (RoW)
11.5.1 Middle East
11.5.2 Africa
12 Rain sensor Market – Entropy
12.1 New product launches
12.2 M&A’s, collaborations, JVs and partnerships
13 Rain sensor Market – Industry/Segment Competition Landscape Premium
13.1 Market Share Analysis
13.1.1 Market Share by Product Type – Key Companies
13.1.2 Market Share by Region – Key Companies
13.1.3 Market Share by Country – Key Companies
13.2 Competition Matrix
13.3 Best Practices for Companies
14 Rain sensor Market – Key Company List by Country Premium Premium
15 Rain sensor Market - Company Analysis
15.1 Denso Corporation
15.2 Hamamatsu Photonics K.K.
15.3 Hella KGAA Hueck & Co
15.4 Robert Bosch GmbH
15.5 The Kostal Group
15.6 HELLA GmbH & Co. KGaA
15.7 ams-OSRAM International GmbH
15.8 ZF Friedrichshafen AG
15.9 STMicroelectronics
15.10 Analog Devices Inc
Ford Motor Company"Financials to the Private Companies would be provided on best-effort basis."
Connect with our experts to get customized reports that best suit your requirements. Our
reports include global-level data, niche markets and competitive landscape.
List of Tables:
Table 1: Rain sensor Market Overview 2021-2026
Table 2: Rain sensor Market Leader Analysis 2018-2019 (US$)
Table 3: Rain sensor Market Product Analysis 2018-2019 (US$)
Table 4: Rain sensor Market End User Analysis 2018-2019 (US$)
Table 5: Rain sensor Market Patent Analysis 2013-2018* (US$)
Table 6: Rain sensor Market Financial Analysis 2018-2019 (US$)
Table 7: Rain sensor Market Driver Analysis 2018-2019 (US$)
Table 8: Rain sensor Market Challenges Analysis 2018-2019 (US$)
Table 9: Rain sensor Market Constraint Analysis 2018-2019 (US$)
Table 10: Rain sensor Market Supplier Bargaining Power Analysis 2018-2019 (US$)
Table 11: Rain sensor Market Buyer Bargaining Power Analysis 2018-2019 (US$)
Table 12: Rain sensor Market Threat of Substitutes Analysis 2018-2019 (US$)
Table 13: Rain sensor Market Threat of New Entrants Analysis 2018-2019 (US$)
Table 14: Rain sensor Market Degree of Competition Analysis 2018-2019 (US$)
Table 15: Rain sensor Market Value Chain Analysis 2018-2019 (US$)
Table 16: Rain sensor Market Pricing Analysis 2021-2026 (US$)
Table 17: Rain sensor Market Opportunities Analysis 2021-2026 (US$)
Table 18: Rain sensor Market Product Life Cycle Analysis 2021-2026 (US$)
Table 19: Rain sensor Market Supplier Analysis 2018-2019 (US$)
Table 20: Rain sensor Market Distributor Analysis 2018-2019 (US$)
Table 21: Rain sensor Market Trend Analysis 2018-2019 (US$)
Table 22: Rain sensor Market Size 2018 (US$)
Table 23: Rain sensor Market Forecast Analysis 2021-2026 (US$)
Table 24: Rain sensor Market Sales Forecast Analysis 2021-2026 (Units)
Table 25: Rain sensor Market, Revenue & Volume, By Type, 2021-2026 ($)
Table 26: Rain sensor Market By Type, Revenue & Volume, By Automated, 2021-2026 ($)
Table 27: Rain sensor Market By Type, Revenue & Volume, By Non-automated, 2021-2026 ($)
Table 28: Rain sensor Market, Revenue & Volume, By Sensitivity, 2021-2026 ($)
Table 29: Rain sensor Market By Sensitivity, Revenue & Volume, By High, 2021-2026 ($)
Table 30: Rain sensor Market By Sensitivity, Revenue & Volume, By Medium, 2021-2026 ($)
Table 31: Rain sensor Market By Sensitivity, Revenue & Volume, By Low, 2021-2026 ($)
Table 32: Rain sensor Market, Revenue & Volume, By Application, 2021-2026 ($)
Table 33: Rain sensor Market By Application, Revenue & Volume, By Passenger Vehicles, 2021-2026 ($)
Table 34: Rain sensor Market By Application, Revenue & Volume, By Commercial Vehicles, 2021-2026 ($)
Table 35: Rain sensor Market By Application, Revenue & Volume, By Sports Vehicles, 2021-2026 ($)
Table 36: North America Rain sensor Market, Revenue & Volume, By Type, 2021-2026 ($)
Table 37: North America Rain sensor Market, Revenue & Volume, By Sensitivity, 2021-2026 ($)
Table 38: North America Rain sensor Market, Revenue & Volume, By Application, 2021-2026 ($)
Table 39: South america Rain sensor Market, Revenue & Volume, By Type, 2021-2026 ($)
Table 40: South america Rain sensor Market, Revenue & Volume, By Sensitivity, 2021-2026 ($)
Table 41: South america Rain sensor Market, Revenue & Volume, By Application, 2021-2026 ($)
Table 42: Europe Rain sensor Market, Revenue & Volume, By Type, 2021-2026 ($)
Table 43: Europe Rain sensor Market, Revenue & Volume, By Sensitivity, 2021-2026 ($)
Table 44: Europe Rain sensor Market, Revenue & Volume, By Application, 2021-2026 ($)
Table 45: APAC Rain sensor Market, Revenue & Volume, By Type, 2021-2026 ($)
Table 46: APAC Rain sensor Market, Revenue & Volume, By Sensitivity, 2021-2026 ($)
Table 47: APAC Rain sensor Market, Revenue & Volume, By Application, 2021-2026 ($)
Table 48: Middle East & Africa Rain sensor Market, Revenue & Volume, By Type, 2021-2026 ($)
Table 49: Middle East & Africa Rain sensor Market, Revenue & Volume, By Sensitivity, 2021-2026 ($)
Table 50: Middle East & Africa Rain sensor Market, Revenue & Volume, By Application, 2021-2026 ($)
Table 51: Russia Rain sensor Market, Revenue & Volume, By Type, 2021-2026 ($)
Table 52: Russia Rain sensor Market, Revenue & Volume, By Sensitivity, 2021-2026 ($)
Table 53: Russia Rain sensor Market, Revenue & Volume, By Application, 2021-2026 ($)
Table 54: Israel Rain sensor Market, Revenue & Volume, By Type, 2021-2026 ($)
Table 55: Israel Rain sensor Market, Revenue & Volume, By Sensitivity, 2021-2026 ($)
Table 56: Israel Rain sensor Market, Revenue & Volume, By Application, 2021-2026 ($)
Table 57: Top Companies 2018 (US$) Rain sensor Market, Revenue & Volume
Table 58: Product Launch 2018-2019 Rain sensor Market, Revenue & Volume
Table 59: Mergers & Acquistions 2018-2019 Rain sensor Market, Revenue & Volume
List of Figures:
Figure 1: Overview of Rain sensor Market 2021-2026
Figure 2: Market Share Analysis for Rain sensor Market 2018 (US$)
Figure 3: Product Comparison in Rain sensor Market 2018-2019 (US$)
Figure 4: End User Profile for Rain sensor Market 2018-2019 (US$)
Figure 5: Patent Application and Grant in Rain sensor Market 2013-2018* (US$)
Figure 6: Top 5 Companies Financial Analysis in Rain sensor Market 2018-2019 (US$)
Figure 7: Market Entry Strategy in Rain sensor Market 2018-2019
Figure 8: Ecosystem Analysis in Rain sensor Market 2018
Figure 9: Average Selling Price in Rain sensor Market 2021-2026
Figure 10: Top Opportunites in Rain sensor Market 2018-2019
Figure 11: Market Life Cycle Analysis in Rain sensor Market
Figure 12: GlobalBy Type Rain sensor Market Revenue, 2021-2026 ($)
Figure 13: GlobalBy Sensitivity Rain sensor Market Revenue, 2021-2026 ($)
Figure 14: GlobalBy Application Rain sensor Market Revenue, 2021-2026 ($)
Figure 15: Global Rain sensor Market - By Geography
Figure 16: Global Rain sensor Market Value & Volume, By Geography, 2021-2026 ($)
Figure 17: Global Rain sensor Market CAGR, By Geography, 2021-2026 (%)
Figure 18: North America Rain sensor Market Value & Volume, 2021-2026 ($)
Figure 19: US Rain sensor Market Value & Volume, 2021-2026 ($)
Figure 20: US GDP and Population, 2018-2019 ($)
Figure 21: US GDP – Composition of 2018, By Sector of Origin
Figure 22: US Export and Import Value & Volume, 2018-2019 ($)
Figure 23: Canada Rain sensor Market Value & Volume, 2021-2026 ($)
Figure 24: Canada GDP and Population, 2018-2019 ($)
Figure 25: Canada GDP – Composition of 2018, By Sector of Origin
Figure 26: Canada Export and Import Value & Volume, 2018-2019 ($)
Figure 27: Mexico Rain sensor Market Value & Volume, 2021-2026 ($)
Figure 28: Mexico GDP and Population, 2018-2019 ($)
Figure 29: Mexico GDP – Composition of 2018, By Sector of Origin
Figure 30: Mexico Export and Import Value & Volume, 2018-2019 ($)
Figure 31: South America Rain sensor Market Value & Volume, 2021-2026 ($)
Figure 32: Brazil Rain sensor Market Value & Volume, 2021-2026 ($)
Figure 33: Brazil GDP and Population, 2018-2019 ($)
Figure 34: Brazil GDP – Composition of 2018, By Sector of Origin
Figure 35: Brazil Export and Import Value & Volume, 2018-2019 ($)
Figure 36: Venezuela Rain sensor Market Value & Volume, 2021-2026 ($)
Figure 37: Venezuela GDP and Population, 2018-2019 ($)
Figure 38: Venezuela GDP – Composition of 2018, By Sector of Origin
Figure 39: Venezuela Export and Import Value & Volume, 2018-2019 ($)
Figure 40: Argentina Rain sensor Market Value & Volume, 2021-2026 ($)
Figure 41: Argentina GDP and Population, 2018-2019 ($)
Figure 42: Argentina GDP – Composition of 2018, By Sector of Origin
Figure 43: Argentina Export and Import Value & Volume, 2018-2019 ($)
Figure 44: Ecuador Rain sensor Market Value & Volume, 2021-2026 ($)
Figure 45: Ecuador GDP and Population, 2018-2019 ($)
Figure 46: Ecuador GDP – Composition of 2018, By Sector of Origin
Figure 47: Ecuador Export and Import Value & Volume, 2018-2019 ($)
Figure 48: Peru Rain sensor Market Value & Volume, 2021-2026 ($)
Figure 49: Peru GDP and Population, 2018-2019 ($)
Figure 50: Peru GDP – Composition of 2018, By Sector of Origin
Figure 51: Peru Export and Import Value & Volume, 2018-2019 ($)
Figure 52: Colombia Rain sensor Market Value & Volume, 2021-2026 ($)
Figure 53: Colombia GDP and Population, 2018-2019 ($)
Figure 54: Colombia GDP – Composition of 2018, By Sector of Origin
Figure 55: Colombia Export and Import Value & Volume, 2018-2019 ($)
Figure 56: Costa Rica Rain sensor Market Value & Volume, 2021-2026 ($)
Figure 57: Costa Rica GDP and Population, 2018-2019 ($)
Figure 58: Costa Rica GDP – Composition of 2018, By Sector of Origin
Figure 59: Costa Rica Export and Import Value & Volume, 2018-2019 ($)
Figure 60: Europe Rain sensor Market Value & Volume, 2021-2026 ($)
Figure 61: U.K Rain sensor Market Value & Volume, 2021-2026 ($)
Figure 62: U.K GDP and Population, 2018-2019 ($)
Figure 63: U.K GDP – Composition of 2018, By Sector of Origin
Figure 64: U.K Export and Import Value & Volume, 2018-2019 ($)
Figure 65: Germany Rain sensor Market Value & Volume, 2021-2026 ($)
Figure 66: Germany GDP and Population, 2018-2019 ($)
Figure 67: Germany GDP – Composition of 2018, By Sector of Origin
Figure 68: Germany Export and Import Value & Volume, 2018-2019 ($)
Figure 69: Italy Rain sensor Market Value & Volume, 2021-2026 ($)
Figure 70: Italy GDP and Population, 2018-2019 ($)
Figure 71: Italy GDP – Composition of 2018, By Sector of Origin
Figure 72: Italy Export and Import Value & Volume, 2018-2019 ($)
Figure 73: France Rain sensor Market Value & Volume, 2021-2026 ($)
Figure 74: France GDP and Population, 2018-2019 ($)
Figure 75: France GDP – Composition of 2018, By Sector of Origin
Figure 76: France Export and Import Value & Volume, 2018-2019 ($)
Figure 77: Netherlands Rain sensor Market Value & Volume, 2021-2026 ($)
Figure 78: Netherlands GDP and Population, 2018-2019 ($)
Figure 79: Netherlands GDP – Composition of 2018, By Sector of Origin
Figure 80: Netherlands Export and Import Value & Volume, 2018-2019 ($)
Figure 81: Belgium Rain sensor Market Value & Volume, 2021-2026 ($)
Figure 82: Belgium GDP and Population, 2018-2019 ($)
Figure 83: Belgium GDP – Composition of 2018, By Sector of Origin
Figure 84: Belgium Export and Import Value & Volume, 2018-2019 ($)
Figure 85: Spain Rain sensor Market Value & Volume, 2021-2026 ($)
Figure 86: Spain GDP and Population, 2018-2019 ($)
Figure 87: Spain GDP – Composition of 2018, By Sector of Origin
Figure 88: Spain Export and Import Value & Volume, 2018-2019 ($)
Figure 89: Denmark Rain sensor Market Value & Volume, 2021-2026 ($)
Figure 90: Denmark GDP and Population, 2018-2019 ($)
Figure 91: Denmark GDP – Composition of 2018, By Sector of Origin
Figure 92: Denmark Export and Import Value & Volume, 2018-2019 ($)
Figure 93: APAC Rain sensor Market Value & Volume, 2021-2026 ($)
Figure 94: China Rain sensor Market Value & Volume, 2021-2026
Figure 95: China GDP and Population, 2018-2019 ($)
Figure 96: China GDP – Composition of 2018, By Sector of Origin
Figure 97: China Export and Import Value & Volume, 2018-2019 ($) Rain sensor Market China Export and Import Value & Volume, 2018-2019 ($)
Figure 98: Australia Rain sensor Market Value & Volume, 2021-2026 ($)
Figure 99: Australia GDP and Population, 2018-2019 ($)
Figure 100: Australia GDP – Composition of 2018, By Sector of Origin
Figure 101: Australia Export and Import Value & Volume, 2018-2019 ($)
Figure 102: South Korea Rain sensor Market Value & Volume, 2021-2026 ($)
Figure 103: South Korea GDP and Population, 2018-2019 ($)
Figure 104: South Korea GDP – Composition of 2018, By Sector of Origin
Figure 105: South Korea Export and Import Value & Volume, 2018-2019 ($)
Figure 106: India Rain sensor Market Value & Volume, 2021-2026 ($)
Figure 107: India GDP and Population, 2018-2019 ($)
Figure 108: India GDP – Composition of 2018, By Sector of Origin
Figure 109: India Export and Import Value & Volume, 2018-2019 ($)
Figure 110: Taiwan Rain sensor Market Value & Volume, 2021-2026 ($)
Figure 111: Taiwan GDP and Population, 2018-2019 ($)
Figure 112: Taiwan GDP – Composition of 2018, By Sector of Origin
Figure 113: Taiwan Export and Import Value & Volume, 2018-2019 ($)
Figure 114: Malaysia Rain sensor Market Value & Volume, 2021-2026 ($)
Figure 115: Malaysia GDP and Population, 2018-2019 ($)
Figure 116: Malaysia GDP – Composition of 2018, By Sector of Origin
Figure 117: Malaysia Export and Import Value & Volume, 2018-2019 ($)
Figure 118: Hong Kong Rain sensor Market Value & Volume, 2021-2026 ($)
Figure 119: Hong Kong GDP and Population, 2018-2019 ($)
Figure 120: Hong Kong GDP – Composition of 2018, By Sector of Origin
Figure 121: Hong Kong Export and Import Value & Volume, 2018-2019 ($)
Figure 122: Middle East & Africa Rain sensor Market Middle East & Africa 3D Printing Market Value & Volume, 2021-2026 ($)
Figure 123: Russia Rain sensor Market Value & Volume, 2021-2026 ($)
Figure 124: Russia GDP and Population, 2018-2019 ($)
Figure 125: Russia GDP – Composition of 2018, By Sector of Origin
Figure 126: Russia Export and Import Value & Volume, 2018-2019 ($)
Figure 127: Israel Rain sensor Market Value & Volume, 2021-2026 ($)
Figure 128: Israel GDP and Population, 2018-2019 ($)
Figure 129: Israel GDP – Composition of 2018, By Sector of Origin
Figure 130: Israel Export and Import Value & Volume, 2018-2019 ($)
Figure 131: Entropy Share, By Strategies, 2018-2019* (%) Rain sensor Market
Figure 132: Developments, 2018-2019* Rain sensor Market
Figure 133: Company 1 Rain sensor Market Net Revenue, By Years, 2018-2019* ($)
Figure 134: Company 1 Rain sensor Market Net Revenue Share, By Business segments, 2018 (%)
Figure 135: Company 1 Rain sensor Market Net Sales Share, By Geography, 2018 (%)
Figure 136: Company 2 Rain sensor Market Net Revenue, By Years, 2018-2019* ($)
Figure 137: Company 2 Rain sensor Market Net Revenue Share, By Business segments, 2018 (%)
Figure 138: Company 2 Rain sensor Market Net Sales Share, By Geography, 2018 (%)
Figure 139: Company 3 Rain sensor Market Net Revenue, By Years, 2018-2019* ($)
Figure 140: Company 3 Rain sensor Market Net Revenue Share, By Business segments, 2018 (%)
Figure 141: Company 3 Rain sensor Market Net Sales Share, By Geography, 2018 (%)
Figure 142: Company 4 Rain sensor Market Net Revenue, By Years, 2018-2019* ($)
Figure 143: Company 4 Rain sensor Market Net Revenue Share, By Business segments, 2018 (%)
Figure 144: Company 4 Rain sensor Market Net Sales Share, By Geography, 2018 (%)
Figure 145: Company 5 Rain sensor Market Net Revenue, By Years, 2018-2019* ($)
Figure 146: Company 5 Rain sensor Market Net Revenue Share, By Business segments, 2018 (%)
Figure 147: Company 5 Rain sensor Market Net Sales Share, By Geography, 2018 (%)
Figure 148: Company 6 Rain sensor Market Net Revenue, By Years, 2018-2019* ($)
Figure 149: Company 6 Rain sensor Market Net Revenue Share, By Business segments, 2018 (%)
Figure 150: Company 6 Rain sensor Market Net Sales Share, By Geography, 2018 (%)
Figure 151: Company 7 Rain sensor Market Net Revenue, By Years, 2018-2019* ($)
Figure 152: Company 7 Rain sensor Market Net Revenue Share, By Business segments, 2018 (%)
Figure 153: Company 7 Rain sensor Market Net Sales Share, By Geography, 2018 (%)
Figure 154: Company 8 Rain sensor Market Net Revenue, By Years, 2018-2019* ($)
Figure 155: Company 8 Rain sensor Market Net Revenue Share, By Business segments, 2018 (%)
Figure 156: Company 8 Rain sensor Market Net Sales Share, By Geography, 2018 (%)
Figure 157: Company 9 Rain sensor Market Net Revenue, By Years, 2018-2019* ($)
Figure 158: Company 9 Rain sensor Market Net Revenue Share, By Business segments, 2018 (%)
Figure 159: Company 9 Rain sensor Market Net Sales Share, By Geography, 2018 (%)
Figure 160: Company 10 Rain sensor Market Net Revenue, By Years, 2018-2019* ($)
Figure 161: Company 10 Rain sensor Market Net Revenue Share, By Business segments, 2018 (%)
Figure 162: Company 10 Rain sensor Market Net Sales Share, By Geography, 2018 (%)
Figure 163: Company 11 Rain sensor Market Net Revenue, By Years, 2018-2019* ($)
Figure 164: Company 11 Rain sensor Market Net Revenue Share, By Business segments, 2018 (%)
Figure 165: Company 11 Rain sensor Market Net Sales Share, By Geography, 2018 (%)
Figure 166: Company 12 Rain sensor Market Net Revenue, By Years, 2018-2019* ($)
Figure 167: Company 12 Rain sensor Market Net Revenue Share, By Business segments, 2018 (%)
Figure 168: Company 12 Rain sensor Market Net Sales Share, By Geography, 2018 (%)
Figure 169: Company 13 Rain sensor Market Net Revenue, By Years, 2018-2019* ($)
Figure 170: Company 13 Rain sensor Market Net Revenue Share, By Business segments, 2018 (%)
Figure 171: Company 13 Rain sensor Market Net Sales Share, By Geography, 2018 (%)
Figure 172: Company 14 Rain sensor Market Net Revenue, By Years, 2018-2019* ($)
Figure 173: Company 14 Rain sensor Market Net Revenue Share, By Business segments, 2018 (%)
Figure 174: Company 14 Rain sensor Market Net Sales Share, By Geography, 2018 (%)
Figure 175: Company 15 Rain sensor Market Net Revenue, By Years, 2018-2019* ($)
Figure 176: Company 15 Rain sensor Market Net Revenue Share, By Business segments, 2018 (%)
Figure 177: Company 15 Rain sensor Market Net Sales Share, By Geography, 2018 (%)