 Email
Email Print
Print


Flocculants Market Overview
The Flocculants Market size is estimated to reach US$1.4 billion by 2027
after growing at a CAGR of 7.9% during the forecast period 2022-2027. Flocculants
are chemicals that are used to precipitate insoluble compounds and enhance the
aggregation of suspended particles. Due to the ability of flocculating agents
to remove suspended solids by aggregating contaminants, they have high
applicability in major sectors such as wastewater treatment, oil & gas,
food & beverage and mining. This is influencing the growth of the Flocculants Market. The mineral mining output has increased significantly over
the years due to high consumption at the industrial level. According to Statistics
Canada, in 2021, Canada’s mineral mining production surged 20% as compared to the previous year. In addition to the mining sector, rapid growth in wastewater
treatment and oil & gas sectors are driving the growth of the flocculants
industry. However, the availability of alternative water treatment technologies
that don’t require the usage of chemicals is anticipated to pose a challenge in
the market growth of flocculants, thereby negatively impacting the Flocculants Market size during the forecast period. The market revenue of the Flocculants
industry saw a drop in 2020 resulting from the decrease in its demand from
major end users due to lockdown restrictions, which negatively impacted the
Flocculants industry outlook.
Flocculants Market Report Coverage
The “Flocculants Market Report – Forecast (2022–2027)” by IndustryARC, covers an in-depth analysis of the following
segments in the Flocculants Industry.
By Type: Natural
(Chitosan, Cellulose, Gum and Mucilage and Starch Derivative), Synthetic (Polyacrylamide,
Polyethylene Oxide and Polyethylene Amine) and Inorganic (Activated Silica,
Metallic Hydroxide and Colloidal Clays).
By Application: Water
Processing, Mineral Dressing, Fermentation and Others.
By End-use Industry: Oil
& Gas Industry (On-shore and Off-shore), Food & Beverage (Dairy, Soft
Drinks, Alcohol Drinks and Others), Wastewater Treatment (Industrial and
Municipal), Mining Industry, Paper & Pulp, Power Generation (Hydro, Wind,
Nuclear and Others) and Others.
By Geography: North
America (the USA, Canada and Mexico), Europe (the UK, Germany, France, Italy, the Netherlands, Spain, Belgium and the Rest of Europe), Asia-Pacific (China,
India, Japan, South Korea, Australia, New Zealand, Indonesia, Taiwan, Malaysia
and the Rest of APAC), South America (Brazil, Argentina, Colombia, Chile and the Rest
of South America) and the Rest of the World (the Middle East and Africa).
Key Takeaways
- Asia-Pacific dominates the Flocculants Market owing to the rapid development in the wastewater treatment sector which is significantly influencing the demand for Flocculating agents in the region for removing suspended solids.
- Growing production of crude oil resulting from high petroleum demand has accelerated the demand and usage of Flocculating agents for wastewater treatment in the oil & gas sector, which has positively impacted the Flocculants industry outlook.
- Rapid growth in mineral mining production due to high demand for minerals in manufacturing products such as plastics, paints and ceramics has accelerated the demand and usage of Flocculants in the mining industry for the removal of suspended solids during mineral extraction.
- The establishment of effective and eco-friendly alternative water treatment technologies would hamper the usage of chemicals in such applications. It would decrease the market growth of Flocculants, thereby negatively impacting the Flocculants Market size.
Flocculants Market Segment Analysis – by Type
Natural type held the largest share in the Flocculants Market share in 2021 and is estimated to grow at a CAGR of 8.1% during the forecast period 2022-2027. Natural flocculants consisting of chitosan, cellulose and starch derivatives are more effective in large dosages, have high shear stability and provide high material safety in comparison to synthetic and inorganic flocculants. Due to such high-performance features, the natural flocculants have high applicability in water processing applications in wastewater treatment, mining and oil & gas sectors. An increase in productivity of mining and oil & gas sectors coupled with the growing capacity of wastewater treatment has resulted in more usage of Flocculants for water processing applications in these sectors which are contributing to the segment growth during the forecast period.
Flocculants Market Segment Analysis – by End-use Industry
Wastewater treatment held the largest share in the Flocculants Market share in 2021 and is projected to grow at a CAGR of 8.4% during the forecast period 2022-2027. Flocculants have high applicability in wastewater treatment plants where they are used for removing suspended solids from wastewater. They aggregate such particles forming a cluster that can be easily removed. The high demand for drinking water coupled with the investment growth and launching of projects related to the construction of water treatment facilities has boosted developments in the wastewater treatment sector. In Q4 of 2021, the US government announced the construction of a wastewater treatment plant in Sonora, California and Florida for upgrading the wastewater treatment facilities. Also, the European Bank for Reconstruction and Development and the European Investment bank jointly invested US$20 million in the construction of a new wastewater treatment plant in Kosovo in 2021. Such project announcements and growing investments in water treatment facilities have accelerated the demand and usage of Flocculants for water processing applications, thereby propelling the market growth during the forecast period.
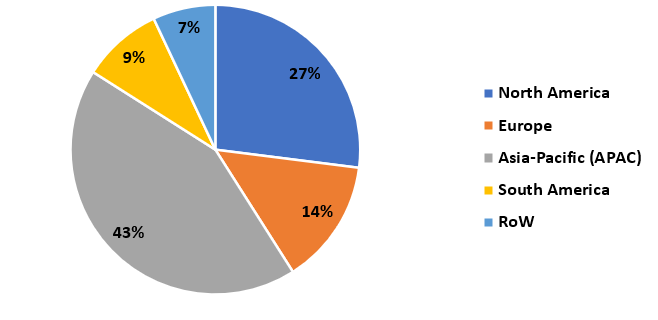
Flocculants Market Segment Analysis – by Geography
Asia-Pacific held the largest Flocculants Market share of up to 43% in 2021. The demand for flocculants in the wastewater treatment sector is significantly influencing its market growth in the Asia-Pacific region. The establishment of new wastewater treatment facilities in major Asia-Pacific countries to increase access to drinking water has resulted in the rapid growth of the wastewater treatment sector in the region. According to the National Bureau of Statistics, in 2020, China installed 39,000 new wastewater treatment facilities. China also invested US$81.6 billion in its municipal wastewater system, new treatment facilities and sludge mitigation, showing a massive increase in investment in water treatment. Also, in 2021, the government of Delhi announced the construction of India’s largest sewage water treatment plant, having a capacity of treating 564 million liters of wastewater per day. Furthermore, in September 2020, the Western Australian Government opened a new US$15 million water treatment plant to improve the water supply in Greater Bunbury. With such establishments of wastewater treatment plants in the major Asia-Pacific countries, the demand for Flocculants for water processing applications has also increased in the region. This is positively impacting the growth of the Flocculants industry.
Flocculants Market Drivers
Increase in Mineral Mining Output:
Flocculants
have high applicability in the mining sector where they are used to treat water
used in mineral extraction and floatation process. Demand for minerals has
increased over the years. This is resulting from their growing usage in major sectors
such as transportation and building infrastructures which has increased the
scale of mineral mining. According to the Indian Bureau of Mines,
in May 2022, India’s mineral mining production stood increased by 10.6% in
comparison to 2021 for the same month. Furthermore, according to the US
National Minerals Information Centre, in 2021, US mines produced US$90.4
billion of minerals commodities, showing a US$9.7 billion increase over the
2020 production volume. Such an increase in mineral mining production has
accelerated the demand and usage of Flocculants for water treatment, thereby
positively impacting the Flocculants industry growth during the forecast
period.
Bolstering Growth in Oil Production:
Flocculants
- both natural and synthetic - are highly demanded in the oil & gas sector
as they are used for the treatment of large volumes of wastewater that is
produced in oil during oil production. The growing industrial demand for crude
oil has increased its production volume. According to the US
Energy Information Administration, the US crude oil production showed an increase
of 4.7% in the first five months of 2022. Also, according to the National
Bureau of Statistics, China’s crude oil production increased by 2.4% in
comparison to 2020 production. Furthermore, according to the Organization of
the Petroleum Exporting Countries, in January 2022, Saudi Arabia’s crude oil
production stood at 10,145 barrels per day, showing an 11.4% increase in comparison
to 2021 production for the same month. With such an increase in crude oil
production, the demand and usage of flocculants for the treatment of
wastewater have also accelerated. It is positively impacting the Flocculants
industry growth during the forecast period.
Flocculants Market Challenge
Introduction of Alternative Technologies:
Synthetic Flocculants though have high usage in water treatment. However, the growing concern regarding chemical usage in water treatment has resulted in the development of various alternative technologies for water treatment. For instance, in 2021, Typhon, a UK-based UV LED water treatment system, developed the world’s first municipal-scale UV LED disinfection system suitable for full-scale water treatment applications. Furthermore, researchers at Hefei Institutes of Physical Science developed a novel water treatment technology using a pseudo-capacitive electrode with high efficiency in 2021. The introduction of such alternative technologies for water treatment would limit the usage of flocculant chemicals in such applications, thereby posing a challenge to the Flocculants Market growth and negatively impacting the Flocculants Market size during the forecast period.
Flocculants Industry Outlook
Technology launches, acquisitions and R&D
activities are key strategies adopted by players in the Flocculants Market. The
top 10 companies in the Flocculants Market are:
- BASF SE
- SNF Floerger
- Ecolab Inc.
- Kemira
- Solenis LLC
- Buckman Laboratories
- Feralco AB
- Suez S.A.
- Ixom Operations Pty Ltd.
- Kurita Water Industries
Recent Developments
- In May 2022, Kemira launched Superfloc BioMb. It is a new line of biomass-balanced Flocculants that are environment-friendly and offer reliable performance in water treatment.
- In October 2020, Mitsubishi Chemicals Holdings Group concluded an agreement to transfer its polymer Flocculants production business to MT Aquapolymer and Hymo Corporation.
- In April 2020, polyacrylamide manufacturing company SNF announced its plans to open a new factory in Gujarat, which would increase the presence of its polyacrylamide Flocculants products in India.
Relevant Reports
Report Code – CMR 0709
Report Code – CMR 24751
Report Code – CMR 0050
For more Chemicals and Materials Market reports, please click here
Table1: Flocculants Market Overview 2021-2026
Table2: Flocculants Market Leader Analysis 2018-2019 (US$)
Table3: Flocculants Market Product Analysis 2018-2019 (US$)
Table4: Flocculants Market End User Analysis 2018-2019 (US$)
Table5: Flocculants Market Patent Analysis 2013-2018* (US$)
Table6: Flocculants Market Financial Analysis 2018-2019 (US$)
Table7: Flocculants Market Driver Analysis 2018-2019 (US$)
Table8: Flocculants Market Challenges Analysis 2018-2019 (US$)
Table9: Flocculants Market Constraint Analysis 2018-2019 (US$)
Table10: Flocculants Market Supplier Bargaining Power Analysis 2018-2019 (US$)
Table11: Flocculants Market Buyer Bargaining Power Analysis 2018-2019 (US$)
Table12: Flocculants Market Threat of Substitutes Analysis 2018-2019 (US$)
Table13: Flocculants Market Threat of New Entrants Analysis 2018-2019 (US$)
Table14: Flocculants Market Degree of Competition Analysis 2018-2019 (US$)
Table15: Flocculants Market Value Chain Analysis 2018-2019 (US$)
Table16: Flocculants Market Pricing Analysis 2021-2026 (US$)
Table17: Flocculants Market Opportunities Analysis 2021-2026 (US$)
Table18: Flocculants Market Product Life Cycle Analysis 2021-2026 (US$)
Table19: Flocculants Market Supplier Analysis 2018-2019 (US$)
Table20: Flocculants Market Distributor Analysis 2018-2019 (US$)
Table21: Flocculants Market Trend Analysis 2018-2019 (US$)
Table22: Flocculants Market Size 2018 (US$)
Table23: Flocculants Market Forecast Analysis 2021-2026 (US$)
Table24: Flocculants Market Sales Forecast Analysis 2021-2026 (Units)
Table25: Flocculants Market, Revenue & Volume, By Type, 2021-2026 ($)
Table26: Flocculants Market By Type, Revenue & Volume, By Synthetic flocculants, 2021-2026 ($)
Table27: Flocculants Market By Type, Revenue & Volume, By Natural flocculants, 2021-2026 ($)
Table28: Flocculants Market By Type, Revenue & Volume, By Mineral flocculants, 2021-2026 ($)
Table29: Flocculants Market, Revenue & Volume, By End-Use Industry, 2021-2026 ($)
Table30: Flocculants Market By End-Use Industry, Revenue & Volume, By Chemical Processing, 2021-2026 ($)
Table31: Flocculants Market By End-Use Industry, Revenue & Volume, By Food & Beverage, 2021-2026 ($)
Table32: Flocculants Market By End-Use Industry, Revenue & Volume, By Oil & Gas, 2021-2026 ($)
Table33: North America Flocculants Market, Revenue & Volume, By Type, 2021-2026 ($)
Table34: North America Flocculants Market, Revenue & Volume, By End-Use Industry, 2021-2026 ($)
Table35: South america Flocculants Market, Revenue & Volume, By Type, 2021-2026 ($)
Table36: South america Flocculants Market, Revenue & Volume, By End-Use Industry, 2021-2026 ($)
Table37: Europe Flocculants Market, Revenue & Volume, By Type, 2021-2026 ($)
Table38: Europe Flocculants Market, Revenue & Volume, By End-Use Industry, 2021-2026 ($)
Table39: APAC Flocculants Market, Revenue & Volume, By Type, 2021-2026 ($)
Table40: APAC Flocculants Market, Revenue & Volume, By End-Use Industry, 2021-2026 ($)
Table41: Middle East & Africa Flocculants Market, Revenue & Volume, By Type, 2021-2026 ($)
Table42: Middle East & Africa Flocculants Market, Revenue & Volume, By End-Use Industry, 2021-2026 ($)
Table43: Russia Flocculants Market, Revenue & Volume, By Type, 2021-2026 ($)
Table44: Russia Flocculants Market, Revenue & Volume, By End-Use Industry, 2021-2026 ($)
Table45: Israel Flocculants Market, Revenue & Volume, By Type, 2021-2026 ($)
Table46: Israel Flocculants Market, Revenue & Volume, By End-Use Industry, 2021-2026 ($)
Table47: Top Companies 2018 (US$)Flocculants Market, Revenue & Volume
Table48: Product Launch 2018-2019Flocculants Market, Revenue & Volume
Table49: Mergers & Acquistions 2018-2019Flocculants Market, Revenue & Volume
List of Figures:
Figure 1: Overview of Flocculants Market 2021-2026
Figure 2: Market Share Analysis for Flocculants Market 2018 (US$)
Figure 3: Product Comparison in Flocculants Market 2018-2019 (US$)
Figure 4: End User Profile for Flocculants Market 2018-2019 (US$)
Figure 5: Patent Application and Grant in Flocculants Market 2013-2018* (US$)
Figure 6: Top 5 Companies Financial Analysis in Flocculants Market 2018-2019 (US$)
Figure 7: Market Entry Strategy in Flocculants Market 2018-2019
Figure 8: Ecosystem Analysis in Flocculants Market 2018
Figure 9: Average Selling Price in Flocculants Market 2021-2026
Figure 10: Top Opportunites in Flocculants Market 2018-2019
Figure 11: Market Life Cycle Analysis in Flocculants Market
Figure 12: GlobalBy TypeFlocculants Market Revenue, 2021-2026 ($)
Figure 13: GlobalBy End-Use IndustryFlocculants Market Revenue, 2021-2026 ($)
Figure 14: Global Flocculants Market - By Geography
Figure 15: Global Flocculants Market Value & Volume, By Geography, 2021-2026 ($)
Figure 16: Global Flocculants Market CAGR, By Geography, 2021-2026 (%)
Figure 17: North America Flocculants Market Value & Volume, 2021-2026 ($)
Figure 18: US Flocculants Market Value & Volume, 2021-2026 ($)
Figure 19: US GDP and Population, 2018-2019 ($)
Figure 20: US GDP – Composition of 2018, By Sector of Origin
Figure 21: US Export and Import Value & Volume, 2018-2019 ($)
Figure 22: Canada Flocculants Market Value & Volume, 2021-2026 ($)
Figure 23: Canada GDP and Population, 2018-2019 ($)
Figure 24: Canada GDP – Composition of 2018, By Sector of Origin
Figure 25: Canada Export and Import Value & Volume, 2018-2019 ($)
Figure 26: Mexico Flocculants Market Value & Volume, 2021-2026 ($)
Figure 27: Mexico GDP and Population, 2018-2019 ($)
Figure 28: Mexico GDP – Composition of 2018, By Sector of Origin
Figure 29: Mexico Export and Import Value & Volume, 2018-2019 ($)
Figure 30: South America Flocculants Market Value & Volume, 2021-2026 ($)
Figure 31: Brazil Flocculants Market Value & Volume, 2021-2026 ($)
Figure 32: Brazil GDP and Population, 2018-2019 ($)
Figure 33: Brazil GDP – Composition of 2018, By Sector of Origin
Figure 34: Brazil Export and Import Value & Volume, 2018-2019 ($)
Figure 35: Venezuela Flocculants Market Value & Volume, 2021-2026 ($)
Figure 36: Venezuela GDP and Population, 2018-2019 ($)
Figure 37: Venezuela GDP – Composition of 2018, By Sector of Origin
Figure 38: Venezuela Export and Import Value & Volume, 2018-2019 ($)
Figure 39: Argentina Flocculants Market Value & Volume, 2021-2026 ($)
Figure 40: Argentina GDP and Population, 2018-2019 ($)
Figure 41: Argentina GDP – Composition of 2018, By Sector of Origin
Figure 42: Argentina Export and Import Value & Volume, 2018-2019 ($)
Figure 43: Ecuador Flocculants Market Value & Volume, 2021-2026 ($)
Figure 44: Ecuador GDP and Population, 2018-2019 ($)
Figure 45: Ecuador GDP – Composition of 2018, By Sector of Origin
Figure 46: Ecuador Export and Import Value & Volume, 2018-2019 ($)
Figure 47: Peru Flocculants Market Value & Volume, 2021-2026 ($)
Figure 48: Peru GDP and Population, 2018-2019 ($)
Figure 49: Peru GDP – Composition of 2018, By Sector of Origin
Figure 50: Peru Export and Import Value & Volume, 2018-2019 ($)
Figure 51: Colombia Flocculants Market Value & Volume, 2021-2026 ($)
Figure 52: Colombia GDP and Population, 2018-2019 ($)
Figure 53: Colombia GDP – Composition of 2018, By Sector of Origin
Figure 54: Colombia Export and Import Value & Volume, 2018-2019 ($)
Figure 55: Costa Rica Flocculants Market Value & Volume, 2021-2026 ($)
Figure 56: Costa Rica GDP and Population, 2018-2019 ($)
Figure 57: Costa Rica GDP – Composition of 2018, By Sector of Origin
Figure 58: Costa Rica Export and Import Value & Volume, 2018-2019 ($)
Figure 59: Europe Flocculants Market Value & Volume, 2021-2026 ($)
Figure 60: U.K Flocculants Market Value & Volume, 2021-2026 ($)
Figure 61: U.K GDP and Population, 2018-2019 ($)
Figure 62: U.K GDP – Composition of 2018, By Sector of Origin
Figure 63: U.K Export and Import Value & Volume, 2018-2019 ($)
Figure 64: Germany Flocculants Market Value & Volume, 2021-2026 ($)
Figure 65: Germany GDP and Population, 2018-2019 ($)
Figure 66: Germany GDP – Composition of 2018, By Sector of Origin
Figure 67: Germany Export and Import Value & Volume, 2018-2019 ($)
Figure 68: Italy Flocculants Market Value & Volume, 2021-2026 ($)
Figure 69: Italy GDP and Population, 2018-2019 ($)
Figure 70: Italy GDP – Composition of 2018, By Sector of Origin
Figure 71: Italy Export and Import Value & Volume, 2018-2019 ($)
Figure 72: France Flocculants Market Value & Volume, 2021-2026 ($)
Figure 73: France GDP and Population, 2018-2019 ($)
Figure 74: France GDP – Composition of 2018, By Sector of Origin
Figure 75: France Export and Import Value & Volume, 2018-2019 ($)
Figure 76: Netherlands Flocculants Market Value & Volume, 2021-2026 ($)
Figure 77: Netherlands GDP and Population, 2018-2019 ($)
Figure 78: Netherlands GDP – Composition of 2018, By Sector of Origin
Figure 79: Netherlands Export and Import Value & Volume, 2018-2019 ($)
Figure 80: Belgium Flocculants Market Value & Volume, 2021-2026 ($)
Figure 81: Belgium GDP and Population, 2018-2019 ($)
Figure 82: Belgium GDP – Composition of 2018, By Sector of Origin
Figure 83: Belgium Export and Import Value & Volume, 2018-2019 ($)
Figure 84: Spain Flocculants Market Value & Volume, 2021-2026 ($)
Figure 85: Spain GDP and Population, 2018-2019 ($)
Figure 86: Spain GDP – Composition of 2018, By Sector of Origin
Figure 87: Spain Export and Import Value & Volume, 2018-2019 ($)
Figure 88: Denmark Flocculants Market Value & Volume, 2021-2026 ($)
Figure 89: Denmark GDP and Population, 2018-2019 ($)
Figure 90: Denmark GDP – Composition of 2018, By Sector of Origin
Figure 91: Denmark Export and Import Value & Volume, 2018-2019 ($)
Figure 92: APAC Flocculants Market Value & Volume, 2021-2026 ($)
Figure 93: China Flocculants Market Value & Volume, 2021-2026
Figure 94: China GDP and Population, 2018-2019 ($)
Figure 95: China GDP – Composition of 2018, By Sector of Origin
Figure 96: China Export and Import Value & Volume, 2018-2019 ($)Flocculants Market China Export and Import Value & Volume, 2018-2019 ($)
Figure 97: Australia Flocculants Market Value & Volume, 2021-2026 ($)
Figure 98: Australia GDP and Population, 2018-2019 ($)
Figure 99: Australia GDP – Composition of 2018, By Sector of Origin
Figure 100: Australia Export and Import Value & Volume, 2018-2019 ($)
Figure 101: South Korea Flocculants Market Value & Volume, 2021-2026 ($)
Figure 102: South Korea GDP and Population, 2018-2019 ($)
Figure 103: South Korea GDP – Composition of 2018, By Sector of Origin
Figure 104: South Korea Export and Import Value & Volume, 2018-2019 ($)
Figure 105: India Flocculants Market Value & Volume, 2021-2026 ($)
Figure 106: India GDP and Population, 2018-2019 ($)
Figure 107: India GDP – Composition of 2018, By Sector of Origin
Figure 108: India Export and Import Value & Volume, 2018-2019 ($)
Figure 109: Taiwan Flocculants Market Value & Volume, 2021-2026 ($)
Figure 110: Taiwan GDP and Population, 2018-2019 ($)
Figure 111: Taiwan GDP – Composition of 2018, By Sector of Origin
Figure 112: Taiwan Export and Import Value & Volume, 2018-2019 ($)
Figure 113: Malaysia Flocculants Market Value & Volume, 2021-2026 ($)
Figure 114: Malaysia GDP and Population, 2018-2019 ($)
Figure 115: Malaysia GDP – Composition of 2018, By Sector of Origin
Figure 116: Malaysia Export and Import Value & Volume, 2018-2019 ($)
Figure 117: Hong Kong Flocculants Market Value & Volume, 2021-2026 ($)
Figure 118: Hong Kong GDP and Population, 2018-2019 ($)
Figure 119: Hong Kong GDP – Composition of 2018, By Sector of Origin
Figure 120: Hong Kong Export and Import Value & Volume, 2018-2019 ($)
Figure 121: Middle East & Africa Flocculants Market Middle East & Africa 3D Printing Market Value & Volume, 2021-2026 ($)
Figure 122: Russia Flocculants Market Value & Volume, 2021-2026 ($)
Figure 123: Russia GDP and Population, 2018-2019 ($)
Figure 124: Russia GDP – Composition of 2018, By Sector of Origin
Figure 125: Russia Export and Import Value & Volume, 2018-2019 ($)
Figure 126: Israel Flocculants Market Value & Volume, 2021-2026 ($)
Figure 127: Israel GDP and Population, 2018-2019 ($)
Figure 128: Israel GDP – Composition of 2018, By Sector of Origin
Figure 129: Israel Export and Import Value & Volume, 2018-2019 ($)
Figure 130: Entropy Share, By Strategies, 2018-2019* (%)Flocculants Market
Figure 131: Developments, 2018-2019*Flocculants Market
Figure 132: Company 1 Flocculants Market Net Revenue, By Years, 2018-2019* ($)
Figure 133: Company 1 Flocculants Market Net Revenue Share, By Business segments, 2018 (%)
Figure 134: Company 1 Flocculants Market Net Sales Share, By Geography, 2018 (%)
Figure 135: Company 2 Flocculants Market Net Revenue, By Years, 2018-2019* ($)
Figure 136: Company 2 Flocculants Market Net Revenue Share, By Business segments, 2018 (%)
Figure 137: Company 2 Flocculants Market Net Sales Share, By Geography, 2018 (%)
Figure 138: Company 3 Flocculants Market Net Revenue, By Years, 2018-2019* ($)
Figure 139: Company 3 Flocculants Market Net Revenue Share, By Business segments, 2018 (%)
Figure 140: Company 3 Flocculants Market Net Sales Share, By Geography, 2018 (%)
Figure 141: Company 4 Flocculants Market Net Revenue, By Years, 2018-2019* ($)
Figure 142: Company 4 Flocculants Market Net Revenue Share, By Business segments, 2018 (%)
Figure 143: Company 4 Flocculants Market Net Sales Share, By Geography, 2018 (%)
Figure 144: Company 5 Flocculants Market Net Revenue, By Years, 2018-2019* ($)
Figure 145: Company 5 Flocculants Market Net Revenue Share, By Business segments, 2018 (%)
Figure 146: Company 5 Flocculants Market Net Sales Share, By Geography, 2018 (%)
Figure 147: Company 6 Flocculants Market Net Revenue, By Years, 2018-2019* ($)
Figure 148: Company 6 Flocculants Market Net Revenue Share, By Business segments, 2018 (%)
Figure 149: Company 6 Flocculants Market Net Sales Share, By Geography, 2018 (%)
Figure 150: Company 7 Flocculants Market Net Revenue, By Years, 2018-2019* ($)
Figure 151: Company 7 Flocculants Market Net Revenue Share, By Business segments, 2018 (%)
Figure 152: Company 7 Flocculants Market Net Sales Share, By Geography, 2018 (%)
Figure 153: Company 8 Flocculants Market Net Revenue, By Years, 2018-2019* ($)
Figure 154: Company 8 Flocculants Market Net Revenue Share, By Business segments, 2018 (%)
Figure 155: Company 8 Flocculants Market Net Sales Share, By Geography, 2018 (%)
Figure 156: Company 9 Flocculants Market Net Revenue, By Years, 2018-2019* ($)
Figure 157: Company 9 Flocculants Market Net Revenue Share, By Business segments, 2018 (%)
Figure 158: Company 9 Flocculants Market Net Sales Share, By Geography, 2018 (%)
Figure 159: Company 10 Flocculants Market Net Revenue, By Years, 2018-2019* ($)
Figure 160: Company 10 Flocculants Market Net Revenue Share, By Business segments, 2018 (%)
Figure 161: Company 10 Flocculants Market Net Sales Share, By Geography, 2018 (%)
Figure 162: Company 11 Flocculants Market Net Revenue, By Years, 2018-2019* ($)
Figure 163: Company 11 Flocculants Market Net Revenue Share, By Business segments, 2018 (%)
Figure 164: Company 11 Flocculants Market Net Sales Share, By Geography, 2018 (%)
Figure 165: Company 12 Flocculants Market Net Revenue, By Years, 2018-2019* ($)
Figure 166: Company 12 Flocculants Market Net Revenue Share, By Business segments, 2018 (%)
Figure 167: Company 12 Flocculants Market Net Sales Share, By Geography, 2018 (%)
Figure 168: Company 13 Flocculants Market Net Revenue, By Years, 2018-2019* ($)
Figure 169: Company 13 Flocculants Market Net Revenue Share, By Business segments, 2018 (%)
Figure 170: Company 13 Flocculants Market Net Sales Share, By Geography, 2018 (%)
Figure 171: Company 14 Flocculants Market Net Revenue, By Years, 2018-2019* ($)
Figure 172: Company 14 Flocculants Market Net Revenue Share, By Business segments, 2018 (%)
Figure 173: Company 14 Flocculants Market Net Sales Share, By Geography, 2018 (%)
Figure 174: Company 15 Flocculants Market Net Revenue, By Years, 2018-2019* ($)
Figure 175: Company 15 Flocculants Market Net Revenue Share, By Business segments, 2018 (%)
Figure 176: Company 15 Flocculants Market Net Sales Share, By Geography, 2018 (%)