 Email
Email Print
Print


Fuel Ethanol Market Overview
The Fuel Ethanol Market size is estimated to reach
US$121.9 billion by 2027, after growing at a CAGR of 5.7% during the forecast
period 2022-2027. Ethanol fuel is ethyl alcohol - a renewable fuel prepared from both natural
and synthetic sources. It is produced using renewable or biobased raw material feedstock, which is starch-based, sugar-based
and cellulosic. The growing demand for ethanol fuel in the automotive
transportation sector for reducing carbon emissions acts as a driving factor
in the ethanol fuel market. In addition, the surging trend for reducing GHG emissions
and emphasis on the biofuel production sector is bolstering the growth scope in
the fuel ethanol industry. The major disruption caused by the covid-19 outbreak
impacted the growth of the Fuel Ethanol Market due to disturbance in automotive
manufacturing, supply chain disruption and other lockdown restrictions.
However, significant recovery in the major end-use sector is boosting the
demand for fuel ethanol for a wide range of applicability and utilization in the
automotive sector. Thus, the Fuel Ethanol industry is anticipated to grow
rapidly and contribute to the Fuel Ethanol Market size during the forecast
period.
Fuel Ethanol Market Report Coverage
The “Fuel
Ethanol Market Report – Forecast (2022-2027)” by IndustryARC, covers an in-depth
analysis of the following segments in the Fuel Ethanol Industry.
By Source: Natural (Corn, Sugarcane, Cassava and Others) and Synthetic (Coal,
Natural Gas and Others).
By Feedstock Type: Starch-Based, Sugar-based and Cellulosic.
By Application: Bio-fuel Preservative, Internal Combustion Engines,
Flexible Fuel Vehicles and Others.
By
End-use Industry: Automotive (Passenger Vehicles (PVs),
Light Commercial Vehicles (LCVs) and Heavy Commercial Vehicles (HCVs), Oil
& Gas (Onshore and Offshore) and Others.
By
Geography: North America (the USA, Canada and Mexico),
Europe (the UK, Germany, France, Italy, the Netherlands, Spain, Belgium and the Rest of
Europe), Asia-Pacific (China, Japan, India, South Korea, Australia and New
Zealand, Indonesia, Taiwan, Malaysia and the Rest of APAC), South America (Brazil,
Argentina, Colombia, Chile and the Rest of South America) and the Rest of the World [the Middle-East (Saudi Arabia, the UAE, Israel and the Rest of the Middle-East) and Africa (South Africa, Nigeria and the Rest of Africa)].
Key Takeaways
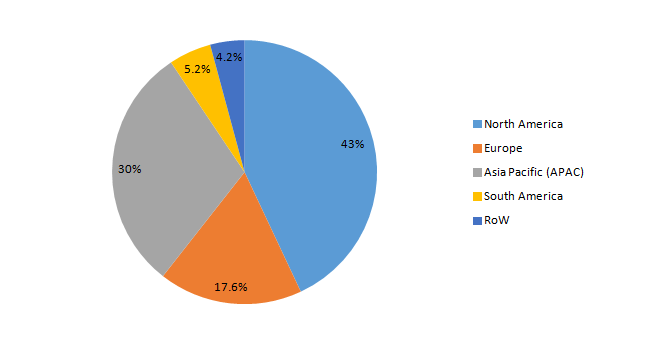
- North America dominates the Fuel Ethanol Market, owing to growth factors such as the flourished base for automotive production and rising awareness of carbon emissions, thereby boosting growth in this region.
- The flourishing demand for flexible fuel vehicles (FFVs) across the world is propelling the demand for Fuel Ethanol for major utilization as motor fuel in fuel cells, internal combustion engines and others. This influences the growth in the Fuel Ethanol Market size.
- The demand for ethanol fuel is rising in flexible fuel vehicles for reducing carbon emissions, thereby boosting the growth scope for biofuels.
- However, the rising burden on natural or agricultural feedstock such as corn, sugarcane and others acts as a challenging factor in the Fuel Ethanol industry.
Fuel Ethanol Market Segment Analysis – by Source
The natural segment held a significant Fuel
Ethanol Market share in 2021 and is estimated to grow at a CAGR of 5.8% during
the forecast period 2022-2027. The growth scope for natural sources of fuel
ethanol is high compared to synthetic sources, thereby reducing carbon emissions.
Natural sources including corn, sugarcane, potatoes and others have high starch
content, which helps in reducing greenhouse gas emissions. In addition, the
rising biofuel consumption and stringent regulations for checking controlled carbon emissions and depleting fossil fuel sources are influencing the
utilization of natural sources of ethanol. Thus, the natural source segment
is anticipated to grow rapidly in the Fuel Ethanol Market during the forecast
period.
Fuel Ethanol Market Segment Analysis – by End-use Industry
The automotive segment held a significant Fuel
Ethanol Market share in 2021 and is projected to grow at a CAGR of 6.3% during the forecast period 2022-2027. Fuel ethanol has
a wide range of applications in the automotive sector for flexible fuel
vehicles and conventional vehicles. The lucrative growth of the automotive sector
is influenced by growth factors such as an established vehicle production base,
rising vehicle electrification and rapid industrialization. According to the International Organization of Motor Vehicles Manufacturers
(OICA), the global production of passenger cars increased from 55,834,456 units
in 2020 to 57,054,295 units in 2021. According to the European Automobile Manufacturer
Association, South America car production grew by 11% while US car production
grew by 3.1% in 2021. With the increase
in growth scope and productivity in the automotive sector, the applicability of
fuel ethanol for fuel cells, internal engine combustion and others are projected
to rise. This, in turn, is expected to boost the growth of the automotive industry
in the Fuel Ethanol Market during the forecast period.
Fuel Ethanol Market Segment Analysis – by Geography
North America held the largest Fuel Ethanol Market share of up to 43% in 2021. The lucrative growth scope for fuel ethanol in this region is influenced by the established base for flexible fuel vehicles in the automotive sector, flourishing manufacturing base and rapid urbanization. The automotive industry is significantly growing in APAC owing to factors such as rising public transportation, demand for fuel-efficient vehicles and strict regulations for particulate emissions. According to the International Organization of Motor Vehicles Manufacturers (OICA), automotive production in the USA rose by 4% in 2021 compared to 2020. According to Statistics Canada, around 1.6 million new vehicles were registered in Canada in 2021, marking an increase of 6.5% over 2020. In addition, 93.4% of new zero-emissions were registered in the three largest provinces of Canada. With the flourishing production of automobiles, the utilization of fuel ethanol for engines of both flexible fuel vehicles, conventional vehicles, fuel cells and others is growing. This, in turn, is projected to boost the growth prospects of Fuel Ethanol in the North America region during the forecast period.
Fuel Ethanol Market Drivers
Rising Initiative towards Reduction of GHG Emissions:
Ethanol Fuel is a renewable fuel that
is increasingly used as a motor fuel and has a high concentration in most
gasoline as it is environment-friendly and reduces air pollution. The lucrative
growth prospect for fuel ethanol is due to factors such as initiatives towards
emission control and regulations for GHG control. The Canadian
government signed the Paris Agreement in 2016 to announce its target for
minimizing emissions nearly by 30% by the end of the year 2030. According to a
report by NITI Aayog, the Indian government emphasized on 20% ethanol blending
by 2025, which would boost the growth for E20, E85 and others. With the strict
regulations to control and limit the carbon emissions from petroleum-based
fuels and depleting fossil fuel reserves, the demand for Fuel Ethanol such as
E85, E20 and others is increasing, which, in turn, is driving the Fuel
Ethanol industry.
Flourishing Growth of the Flexible Fuel Vehicles:
Fuel Ethanol has growing utilization in
flexible fuel vehicles for fuel cells, engines and others. The lucrative growth
in the flexible fuel vehicles sector is influenced by factors such as vehicle
norms, stringent environmental regulations and emphasis on controlling the depletion
of fossil fuels. In June 2020, General Motors Company introduced
the Chevrolet Silverado HD and GMC Sierra HD, which are equipped with Flex-fuel
capable engines that run on both gasoline and ethanol E85. According to the
Renewable Fuel Association (RFA), 11 models are available as flexible fuel
vehicles (FFVs) in 2021-22. Furthermore, according to NITI Ayog, the FFVs hold a
dominant position in the Brazil ethanol and biomass fuel market, representing
over 80% of the total vehicles sold in 2019. With the increasing growth scope for
FFVs, the applicability of ethanol as a motor fuel is rising, thereby driving
the global Fuel Ethanol Market.
Fuel Ethanol Market Challenges
Burden on Agricultural Feedstock:
Fuel Ethanol is produced through natural
and synthetic sources. Natural sources such as sugarcane, corn, cassava and
other biomasses face a burden due to increasing utilization in ethanol fuel
production. This creates a burden on arable land and agricultural
production. In addition, a spike in food
prices for corn, sugarcane and others creates a challenge for ethanol fuel
production through natural sources. Moreover, the production of ethanol from
corn consumes more energy compared to what it offers as a biofuel. Thus, all
these factors hinder and limit the growth scope. Thus, the Fuel Ethanol
industry faces a major slowdown.
Fuel Ethanol Industry Outlook
Technology launches, acquisitions and R&D
activities are key strategies adopted by players in the Fuel Ethanol Market. The
10 companies in the Fuel Ethanol Market are:
- DowDuPont
- Petrobras
- Alcogroup
- BlueFire Renewables Inc
- BP PLC
- Cristal Union
- Cropenergies AG
- Pacific Ethanol, Inc
- Archer Daniels Midland Company
- Valero Energy Corporation
Recent Developments
- In March 2022, Ganesh Benzoplast Limited along with Golden Agri International Enterprise and other investors ventured into the manufacturing of ethanol along with Extra Natural Alcohol.
- In February 2022, KN Group planned to raise the ethanol production capacity at a newly acquired plant, intending to fulfill the rising biofuel demand and ethanol-blending trends.
- In June 2021, POET acquired the ethanol business of Flint Hills Resources to boost the ethanol production capacity by 40% to 3 billion gallons per year.
Relevant Reports
Report Code: CMR 22472
Report Code: CMR 0121
Report Code: CMR 1462
For more Chemicals and Materials Market reports, please click here
Table 1: Fuel Ethanol Market Overview 2021-2026
Table 2: Fuel Ethanol Market Leader Analysis 2018-2019 (US$)
Table 3: Fuel Ethanol Market Product Analysis 2018-2019 (US$)
Table 4: Fuel Ethanol Market End User Analysis 2018-2019 (US$)
Table 5: Fuel Ethanol Market Patent Analysis 2013-2018* (US$)
Table 6: Fuel Ethanol Market Financial Analysis 2018-2019 (US$)
Table 7: Fuel Ethanol Market Driver Analysis 2018-2019 (US$)
Table 8: Fuel Ethanol Market Challenges Analysis 2018-2019 (US$)
Table 9: Fuel Ethanol Market Constraint Analysis 2018-2019 (US$)
Table 10: Fuel Ethanol Market Supplier Bargaining Power Analysis 2018-2019 (US$)
Table 11: Fuel Ethanol Market Buyer Bargaining Power Analysis 2018-2019 (US$)
Table 12: Fuel Ethanol Market Threat of Substitutes Analysis 2018-2019 (US$)
Table 13: Fuel Ethanol Market Threat of New Entrants Analysis 2018-2019 (US$)
Table 14: Fuel Ethanol Market Degree of Competition Analysis 2018-2019 (US$)
Table 15: Fuel Ethanol Market Value Chain Analysis 2018-2019 (US$)
Table 16: Fuel Ethanol Market Pricing Analysis 2021-2026 (US$)
Table 17: Fuel Ethanol Market Opportunities Analysis 2021-2026 (US$)
Table 18: Fuel Ethanol Market Product Life Cycle Analysis 2021-2026 (US$)
Table 19: Fuel Ethanol Market Supplier Analysis 2018-2019 (US$)
Table 20: Fuel Ethanol Market Distributor Analysis 2018-2019 (US$)
Table 21: Fuel Ethanol Market Trend Analysis 2018-2019 (US$)
Table 22: Fuel Ethanol Market Size 2018 (US$)
Table 23: Fuel Ethanol Market Forecast Analysis 2021-2026 (US$)
Table 24: Fuel Ethanol Market Sales Forecast Analysis 2021-2026 (Units)
Table 25: Fuel Ethanol Market, Revenue & Volume, By Vehicle type, 2021-2026 ($)
Table 26: Fuel Ethanol Market By Vehicle type, Revenue & Volume, By Passenger Car, 2021-2026 ($)
Table 27: Fuel Ethanol Market By Vehicle type, Revenue & Volume, By Light Commercial Vehicle, 2021-2026 ($)
Table 28: Fuel Ethanol Market By Vehicle type, Revenue & Volume, By Heavy Commercial Vehicle, 2021-2026 ($)
Table 29: Fuel Ethanol Market, Revenue & Volume, By End-Use Industry, 2021-2026 ($)
Table 30: Fuel Ethanol Market By End-Use Industry, Revenue & Volume, By Automotive, 2021-2026 ($)
Table 31: Fuel Ethanol Market By End-Use Industry, Revenue & Volume, By Pharmaceuticals, 2021-2026 ($)
Table 32: Fuel Ethanol Market By End-Use Industry, Revenue & Volume, By Chemical, 2021-2026 ($)
Table 33: North America Fuel Ethanol Market, Revenue & Volume, By Vehicle type, 2021-2026 ($)
Table 34: North America Fuel Ethanol Market, Revenue & Volume, By End-Use Industry, 2021-2026 ($)
Table 35: South america Fuel Ethanol Market, Revenue & Volume, By Vehicle type, 2021-2026 ($)
Table 36: South america Fuel Ethanol Market, Revenue & Volume, By End-Use Industry, 2021-2026 ($)
Table 37: Europe Fuel Ethanol Market, Revenue & Volume, By Vehicle type, 2021-2026 ($)
Table 38: Europe Fuel Ethanol Market, Revenue & Volume, By End-Use Industry, 2021-2026 ($)
Table 39: APAC Fuel Ethanol Market, Revenue & Volume, By Vehicle type, 2021-2026 ($)
Table 40: APAC Fuel Ethanol Market, Revenue & Volume, By End-Use Industry, 2021-2026 ($)
Table 41: Middle East & Africa Fuel Ethanol Market, Revenue & Volume, By Vehicle type, 2021-2026 ($)
Table 42: Middle East & Africa Fuel Ethanol Market, Revenue & Volume, By End-Use Industry, 2021-2026 ($)
Table 43: Russia Fuel Ethanol Market, Revenue & Volume, By Vehicle type, 2021-2026 ($)
Table 44: Russia Fuel Ethanol Market, Revenue & Volume, By End-Use Industry, 2021-2026 ($)
Table 45: Israel Fuel Ethanol Market, Revenue & Volume, By Vehicle type, 2021-2026 ($)
Table 46: Israel Fuel Ethanol Market, Revenue & Volume, By End-Use Industry, 2021-2026 ($)
Table 47: Top Companies 2018 (US$)Fuel Ethanol Market, Revenue & Volume
Table 48: Product Launch 2018-2019Fuel Ethanol Market, Revenue & Volume
Table 49: Mergers & Acquistions 2018-2019Fuel Ethanol Market, Revenue & Volume
List of Figures:
Figure 1: Overview of Fuel Ethanol Market 2021-2026
Figure 2: Market Share Analysis for Fuel Ethanol Market 2018 (US$)
Figure 3: Product Comparison in Fuel Ethanol Market 2018-2019 (US$)
Figure 4: End User Profile for Fuel Ethanol Market 2018-2019 (US$)
Figure 5: Patent Application and Grant in Fuel Ethanol Market 2013-2018* (US$)
Figure 6: Top 5 Companies Financial Analysis in Fuel Ethanol Market 2018-2019 (US$)
Figure 7: Market Entry Strategy in Fuel Ethanol Market 2018-2019
Figure 8: Ecosystem Analysis in Fuel Ethanol Market 2018
Figure 9: Average Selling Price in Fuel Ethanol Market 2021-2026
Figure 10: Top Opportunites in Fuel Ethanol Market 2018-2019
Figure 11: Market Life Cycle Analysis in Fuel Ethanol Market
Figure 12: GlobalBy Vehicle typeFuel Ethanol Market Revenue, 2021-2026 ($)
Figure 13: GlobalBy End-Use IndustryFuel Ethanol Market Revenue, 2021-2026 ($)
Figure 14: Global Fuel Ethanol Market - By Geography
Figure 15: Global Fuel Ethanol Market Value & Volume, By Geography, 2021-2026 ($)
Figure 16: Global Fuel Ethanol Market CAGR, By Geography, 2021-2026 (%)
Figure 17: North America Fuel Ethanol Market Value & Volume, 2021-2026 ($)
Figure 18: US Fuel Ethanol Market Value & Volume, 2021-2026 ($)
Figure 19: US GDP and Population, 2018-2019 ($)
Figure 20: US GDP – Composition of 2018, By Sector of Origin
Figure 21: US Export and Import Value & Volume, 2018-2019 ($)
Figure 22: Canada Fuel Ethanol Market Value & Volume, 2021-2026 ($)
Figure 23: Canada GDP and Population, 2018-2019 ($)
Figure 24: Canada GDP – Composition of 2018, By Sector of Origin
Figure 25: Canada Export and Import Value & Volume, 2018-2019 ($)
Figure 26: Mexico Fuel Ethanol Market Value & Volume, 2021-2026 ($)
Figure 27: Mexico GDP and Population, 2018-2019 ($)
Figure 28: Mexico GDP – Composition of 2018, By Sector of Origin
Figure 29: Mexico Export and Import Value & Volume, 2018-2019 ($)
Figure 30: South America Fuel Ethanol Market Value & Volume, 2021-2026 ($)
Figure 31: Brazil Fuel Ethanol Market Value & Volume, 2021-2026 ($)
Figure 32: Brazil GDP and Population, 2018-2019 ($)
Figure 33: Brazil GDP – Composition of 2018, By Sector of Origin
Figure 34: Brazil Export and Import Value & Volume, 2018-2019 ($)
Figure 35: Venezuela Fuel Ethanol Market Value & Volume, 2021-2026 ($)
Figure 36: Venezuela GDP and Population, 2018-2019 ($)
Figure 37: Venezuela GDP – Composition of 2018, By Sector of Origin
Figure 38: Venezuela Export and Import Value & Volume, 2018-2019 ($)
Figure 39: Argentina Fuel Ethanol Market Value & Volume, 2021-2026 ($)
Figure 40: Argentina GDP and Population, 2018-2019 ($)
Figure 41: Argentina GDP – Composition of 2018, By Sector of Origin
Figure 42: Argentina Export and Import Value & Volume, 2018-2019 ($)
Figure 43: Ecuador Fuel Ethanol Market Value & Volume, 2021-2026 ($)
Figure 44: Ecuador GDP and Population, 2018-2019 ($)
Figure 45: Ecuador GDP – Composition of 2018, By Sector of Origin
Figure 46: Ecuador Export and Import Value & Volume, 2018-2019 ($)
Figure 47: Peru Fuel Ethanol Market Value & Volume, 2021-2026 ($)
Figure 48: Peru GDP and Population, 2018-2019 ($)
Figure 49: Peru GDP – Composition of 2018, By Sector of Origin
Figure 50: Peru Export and Import Value & Volume, 2018-2019 ($)
Figure 51: Colombia Fuel Ethanol Market Value & Volume, 2021-2026 ($)
Figure 52: Colombia GDP and Population, 2018-2019 ($)
Figure 53: Colombia GDP – Composition of 2018, By Sector of Origin
Figure 54: Colombia Export and Import Value & Volume, 2018-2019 ($)
Figure 55: Costa Rica Fuel Ethanol Market Value & Volume, 2021-2026 ($)
Figure 56: Costa Rica GDP and Population, 2018-2019 ($)
Figure 57: Costa Rica GDP – Composition of 2018, By Sector of Origin
Figure 58: Costa Rica Export and Import Value & Volume, 2018-2019 ($)
Figure 59: Europe Fuel Ethanol Market Value & Volume, 2021-2026 ($)
Figure 60: U.K Fuel Ethanol Market Value & Volume, 2021-2026 ($)
Figure 61: U.K GDP and Population, 2018-2019 ($)
Figure 62: U.K GDP – Composition of 2018, By Sector of Origin
Figure 63: U.K Export and Import Value & Volume, 2018-2019 ($)
Figure 64: Germany Fuel Ethanol Market Value & Volume, 2021-2026 ($)
Figure 65: Germany GDP and Population, 2018-2019 ($)
Figure 66: Germany GDP – Composition of 2018, By Sector of Origin
Figure 67: Germany Export and Import Value & Volume, 2018-2019 ($)
Figure 68: Italy Fuel Ethanol Market Value & Volume, 2021-2026 ($)
Figure 69: Italy GDP and Population, 2018-2019 ($)
Figure 70: Italy GDP – Composition of 2018, By Sector of Origin
Figure 71: Italy Export and Import Value & Volume, 2018-2019 ($)
Figure 72: France Fuel Ethanol Market Value & Volume, 2021-2026 ($)
Figure 73: France GDP and Population, 2018-2019 ($)
Figure 74: France GDP – Composition of 2018, By Sector of Origin
Figure 75: France Export and Import Value & Volume, 2018-2019 ($)
Figure 76: Netherlands Fuel Ethanol Market Value & Volume, 2021-2026 ($)
Figure 77: Netherlands GDP and Population, 2018-2019 ($)
Figure 78: Netherlands GDP – Composition of 2018, By Sector of Origin
Figure 79: Netherlands Export and Import Value & Volume, 2018-2019 ($)
Figure 80: Belgium Fuel Ethanol Market Value & Volume, 2021-2026 ($)
Figure 81: Belgium GDP and Population, 2018-2019 ($)
Figure 82: Belgium GDP – Composition of 2018, By Sector of Origin
Figure 83: Belgium Export and Import Value & Volume, 2018-2019 ($)
Figure 84: Spain Fuel Ethanol Market Value & Volume, 2021-2026 ($)
Figure 85: Spain GDP and Population, 2018-2019 ($)
Figure 86: Spain GDP – Composition of 2018, By Sector of Origin
Figure 87: Spain Export and Import Value & Volume, 2018-2019 ($)
Figure 88: Denmark Fuel Ethanol Market Value & Volume, 2021-2026 ($)
Figure 89: Denmark GDP and Population, 2018-2019 ($)
Figure 90: Denmark GDP – Composition of 2018, By Sector of Origin
Figure 91: Denmark Export and Import Value & Volume, 2018-2019 ($)
Figure 92: APAC Fuel Ethanol Market Value & Volume, 2021-2026 ($)
Figure 93: China Fuel Ethanol Market Value & Volume, 2021-2026
Figure 94: China GDP and Population, 2018-2019 ($)
Figure 95: China GDP – Composition of 2018, By Sector of Origin
Figure 96: China Export and Import Value & Volume, 2018-2019 ($)Fuel Ethanol Market China Export and Import Value & Volume, 2018-2019 ($)
Figure 97: Australia Fuel Ethanol Market Value & Volume, 2021-2026 ($)
Figure 98: Australia GDP and Population, 2018-2019 ($)
Figure 99: Australia GDP – Composition of 2018, By Sector of Origin
Figure 100: Australia Export and Import Value & Volume, 2018-2019 ($)
Figure 101: South Korea Fuel Ethanol Market Value & Volume, 2021-2026 ($)
Figure 102: South Korea GDP and Population, 2018-2019 ($)
Figure 103: South Korea GDP – Composition of 2018, By Sector of Origin
Figure 104: South Korea Export and Import Value & Volume, 2018-2019 ($)
Figure 105: India Fuel Ethanol Market Value & Volume, 2021-2026 ($)
Figure 106: India GDP and Population, 2018-2019 ($)
Figure 107: India GDP – Composition of 2018, By Sector of Origin
Figure 108: India Export and Import Value & Volume, 2018-2019 ($)
Figure 109: Taiwan Fuel Ethanol Market Value & Volume, 2021-2026 ($)
Figure 110: Taiwan GDP and Population, 2018-2019 ($)
Figure 111: Taiwan GDP – Composition of 2018, By Sector of Origin
Figure 112: Taiwan Export and Import Value & Volume, 2018-2019 ($)
Figure 113: Malaysia Fuel Ethanol Market Value & Volume, 2021-2026 ($)
Figure 114: Malaysia GDP and Population, 2018-2019 ($)
Figure 115: Malaysia GDP – Composition of 2018, By Sector of Origin
Figure 116: Malaysia Export and Import Value & Volume, 2018-2019 ($)
Figure 117: Hong Kong Fuel Ethanol Market Value & Volume, 2021-2026 ($)
Figure 118: Hong Kong GDP and Population, 2018-2019 ($)
Figure 119: Hong Kong GDP – Composition of 2018, By Sector of Origin
Figure 120: Hong Kong Export and Import Value & Volume, 2018-2019 ($)
Figure 121: Middle East & Africa Fuel Ethanol Market Middle East & Africa 3D Printing Market Value & Volume, 2021-2026 ($)
Figure 122: Russia Fuel Ethanol Market Value & Volume, 2021-2026 ($)
Figure 123: Russia GDP and Population, 2018-2019 ($)
Figure 124: Russia GDP – Composition of 2018, By Sector of Origin
Figure 125: Russia Export and Import Value & Volume, 2018-2019 ($)
Figure 126: Israel Fuel Ethanol Market Value & Volume, 2021-2026 ($)
Figure 127: Israel GDP and Population, 2018-2019 ($)
Figure 128: Israel GDP – Composition of 2018, By Sector of Origin
Figure 129: Israel Export and Import Value & Volume, 2018-2019 ($)
Figure 130: Entropy Share, By Strategies, 2018-2019* (%)Fuel Ethanol Market
Figure 131: Developments, 2018-2019*Fuel Ethanol Market
Figure 132: Company 1 Fuel Ethanol Market Net Revenue, By Years, 2018-2019* ($)
Figure 133: Company 1 Fuel Ethanol Market Net Revenue Share, By Business segments, 2018 (%)
Figure 134: Company 1 Fuel Ethanol Market Net Sales Share, By Geography, 2018 (%)
Figure 135: Company 2 Fuel Ethanol Market Net Revenue, By Years, 2018-2019* ($)
Figure 136: Company 2 Fuel Ethanol Market Net Revenue Share, By Business segments, 2018 (%)
Figure 137: Company 2 Fuel Ethanol Market Net Sales Share, By Geography, 2018 (%)
Figure 138: Company 3 Fuel Ethanol Market Net Revenue, By Years, 2018-2019* ($)
Figure 139: Company 3 Fuel Ethanol Market Net Revenue Share, By Business segments, 2018 (%)
Figure 140: Company 3 Fuel Ethanol Market Net Sales Share, By Geography, 2018 (%)
Figure 141: Company 4 Fuel Ethanol Market Net Revenue, By Years, 2018-2019* ($)
Figure 142: Company 4 Fuel Ethanol Market Net Revenue Share, By Business segments, 2018 (%)
Figure 143: Company 4 Fuel Ethanol Market Net Sales Share, By Geography, 2018 (%)
Figure 144: Company 5 Fuel Ethanol Market Net Revenue, By Years, 2018-2019* ($)
Figure 145: Company 5 Fuel Ethanol Market Net Revenue Share, By Business segments, 2018 (%)
Figure 146: Company 5 Fuel Ethanol Market Net Sales Share, By Geography, 2018 (%)
Figure 147: Company 6 Fuel Ethanol Market Net Revenue, By Years, 2018-2019* ($)
Figure 148: Company 6 Fuel Ethanol Market Net Revenue Share, By Business segments, 2018 (%)
Figure 149: Company 6 Fuel Ethanol Market Net Sales Share, By Geography, 2018 (%)
Figure 150: Company 7 Fuel Ethanol Market Net Revenue, By Years, 2018-2019* ($)
Figure 151: Company 7 Fuel Ethanol Market Net Revenue Share, By Business segments, 2018 (%)
Figure 152: Company 7 Fuel Ethanol Market Net Sales Share, By Geography, 2018 (%)
Figure 153: Company 8 Fuel Ethanol Market Net Revenue, By Years, 2018-2019* ($)
Figure 154: Company 8 Fuel Ethanol Market Net Revenue Share, By Business segments, 2018 (%)
Figure 155: Company 8 Fuel Ethanol Market Net Sales Share, By Geography, 2018 (%)
Figure 156: Company 9 Fuel Ethanol Market Net Revenue, By Years, 2018-2019* ($)
Figure 157: Company 9 Fuel Ethanol Market Net Revenue Share, By Business segments, 2018 (%)
Figure 158: Company 9 Fuel Ethanol Market Net Sales Share, By Geography, 2018 (%)
Figure 159: Company 10 Fuel Ethanol Market Net Revenue, By Years, 2018-2019* ($)
Figure 160: Company 10 Fuel Ethanol Market Net Revenue Share, By Business segments, 2018 (%)
Figure 161: Company 10 Fuel Ethanol Market Net Sales Share, By Geography, 2018 (%)
Figure 162: Company 11 Fuel Ethanol Market Net Revenue, By Years, 2018-2019* ($)
Figure 163: Company 11 Fuel Ethanol Market Net Revenue Share, By Business segments, 2018 (%)
Figure 164: Company 11 Fuel Ethanol Market Net Sales Share, By Geography, 2018 (%)
Figure 165: Company 12 Fuel Ethanol Market Net Revenue, By Years, 2018-2019* ($)
Figure 166: Company 12 Fuel Ethanol Market Net Revenue Share, By Business segments, 2018 (%)
Figure 167: Company 12 Fuel Ethanol Market Net Sales Share, By Geography, 2018 (%)
Figure 168: Company 13 Fuel Ethanol Market Net Revenue, By Years, 2018-2019* ($)
Figure 169: Company 13 Fuel Ethanol Market Net Revenue Share, By Business segments, 2018 (%)
Figure 170: Company 13 Fuel Ethanol Market Net Sales Share, By Geography, 2018 (%)
Figure 171: Company 14 Fuel Ethanol Market Net Revenue, By Years, 2018-2019* ($)
Figure 172: Company 14 Fuel Ethanol Market Net Revenue Share, By Business segments, 2018 (%)
Figure 173: Company 14 Fuel Ethanol Market Net Sales Share, By Geography, 2018 (%)
Figure 174: Company 15 Fuel Ethanol Market Net Revenue, By Years, 2018-2019* ($)
Figure 175: Company 15 Fuel Ethanol Market Net Revenue Share, By Business segments, 2018 (%)
Figure 176: Company 15 Fuel Ethanol Market Net Sales Share, By Geography, 2018 (%)