 Email
Email Print
Print


Branded generics drugs are similar to the innovator products but are marketed and sold under different brand names. The color, size and shape of the brands of the same medicine may vary depending on the manufacturing company. Branded generics cover a broad range of treatments including antibiotics, antifungal medications and diabetic therapies among many others. Global market for branded generics is witnessing a significant growth in near future as numerous pharmaceutical products are going to be of patent in the coming years. Branded generics find the new ways to formulate drugs that have lost patent protection. Branded generics in emerging markets offer big pharmaceutical plays a viable growth. It assures consumers that the medicines are proven to be safe and effective. Generic drugs are less expensive and time consuming for their development. Branded generic drugs are used to treat hypertension, diabetes, back pain, arthritis, and thyroid disfunctioniong and others.
This report segments the branded generics market by type, by application and by distribution. Branded generics are of two major types; value added branded generics and trade named branded generics. By application, the market is classified into cardiovascular drugs, anti-cancer drugs, CNS drugs, and anti-infective drugs. By distribution, the market for branded generics includes retail pharmacies, hospital pharmacies and clinics.
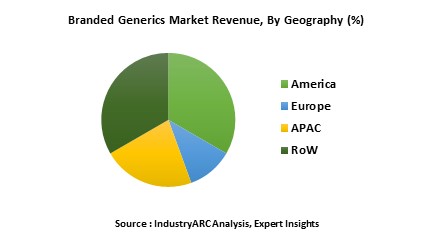
The overall branded generics market is also studied for different region and their major countries. North America is the largest market due to its increasing demand for cost effective medicines followed by Europe, APAC and RoW. Branded generics market is poised to reach $XXm at a CAGR of XX% in the forecast period.
This report segments the branded generics market by type, by application and by distribution. Branded generics are of two major types; value added branded generics and trade named branded generics. By application, the market is classified into cardiovascular drugs, anti-cancer drugs, CNS drugs, and anti-infective drugs. By distribution, the market for branded generics includes retail pharmacies, hospital pharmacies and clinics.
The overall branded generics market is also studied for different region and their major countries. North America is the largest market due to its increasing demand for cost effective medicines followed by Europe, APAC and RoW. Branded generics market is poised to reach $XXm at a CAGR of XX% in the forecast period.
Sample Companies Profiled in this Report are:
- Teva Pharmaceutical Industries Ltd.
- Mylan N.V.
- Sanofi
- Astra Zeneca
- Pupin Pharmaceuticals
- Hospira Inc.
- 10+
1. Branded Generics Market - Overview
1.1. Definitions and Scope
2. Branded Generics Market - Executive summary
2.1. Market Revenue, Market Size and Key Trends by Company
2.2. Key Trends by type of Application
2.3. Key Trends segmented by Geography
3. Branded Generics Market
3.1. Comparative analysis
3.1.1. Product Benchmarking - Top 10 companies
3.1.2. Top 5 Financials Analysis
3.1.3. Market Value split by Top 10 companies
3.1.4. Patent Analysis - Top 10 companies
3.1.5. Pricing Analysis
4. Branded Generics Market – Startup companies Scenario Premium
4.1. Top 10 startup company Analysis by
4.1.1. Investment
4.1.2. Revenue
4.1.3. Market Shares
4.1.4. Market Size and Application Analysis
4.1.5. Venture Capital and Funding Scenario
5. Branded Generics Market – Industry Market Entry Scenario Premium
5.1. Regulatory Framework Overview
5.2. New Business and Ease of Doing business index
5.3. Case studies of successful ventures
5.4. Customer Analysis – Top 10 companies
6. Branded Generics Market Forces
6.1. Drivers
6.2. Constraints
6.3. Challenges
6.4. Porters five force model
6.4.1. Bargaining power of suppliers
6.4.2. Bargaining powers of customers
6.4.3. Threat of new entrants
6.4.4. Rivalry among existing players
6.4.5. Threat of substitutes
7. Branded Generics Market -Strategic analysis
7.1. Value chain analysis
7.2. Opportunities analysis
7.3. Product life cycle
7.4. Suppliers and distributors Market Share
8. Branded Generics Market – By Type (Market Size -$Million / $Billion)
8.1. Market Size and Market Share Analysis
8.2. Application Revenue and Trend Research
8.3. Product Segment Analysis
8.3.1. Value Added Branded Generics
8.3.2. Trade Named Branded Generics
9. Branded Generics Market – Trade Named Branded Generics (Market Size -$Million / $Billion)
9.1. Cardiovascular Drugs
9.2. Anti-Cancer Drugs
9.3. CNS Drugs
9.4. Anti-Infective Drugs
9.5. Others
10. Branded Generics Market – By Distribution (Market Size -$Million / $Billion)
10.1. Retail Pharmacy & Drug Stores
10.2. Clinics
10.3. Hospital Pharmacies
11. Branded Generics - By Geography (Market Size -$Million / $Billion)
11.1. Branded Generics Market - North America Segment Research
11.2. North America Market Research (Million / $Billion)
11.2.1. Segment type Size and Market Size Analysis
11.2.2. Revenue and Trends
11.2.3. Application Revenue and Trends by type of Application
11.2.4. Company Revenue and Product Analysis
11.2.5. North America Product type and Application Market Size
11.2.5.1. U.S.
11.2.5.2. Canada
11.2.5.3. Mexico
11.2.5.4. Rest of North America
11.3. Branded Generics - South America Segment Research
11.4. South America Market Research (Market Size -$Million / $Billion)
11.4.1. Segment type Size and Market Size Analysis
11.4.2. Revenue and Trends
11.4.3. Application Revenue and Trends by type of Application
11.4.4. Company Revenue and Product Analysis
11.4.5. South America Product type and Application Market Size
11.4.5.1. Brazil
11.4.5.2. Venezuela
11.4.5.3. Argentina
11.4.5.4. Ecuador
11.4.5.5. Peru
11.4.5.6. Colombia
11.4.5.7. Costa Rica
11.4.5.8. Rest of South America
11.5. Branded Generics - Europe Segment Research
11.6. Europe Market Research (Market Size -$Million / $Billion)
11.6.1. Segment type Size and Market Size Analysis
11.6.2. Revenue and Trends
11.6.3. Application Revenue and Trends by type of Application
11.6.4. Company Revenue and Product Analysis
11.6.5. Europe Segment Product type and Application Market Size
11.6.5.1. U.K
11.6.5.2. Germany
11.6.5.3. Italy
11.6.5.4. France
11.6.5.5. Netherlands
11.6.5.6. Belgium
11.6.5.7. Spain
11.6.5.8. Denmark
11.6.5.9. Rest of Europe
11.7. Branded Generics – APAC Segment Research
11.8. APAC Market Research (Market Size -$Million / $Billion)
11.8.1. Segment type Size and Market Size Analysis
11.8.2. Revenue and Trends
11.8.3. Application Revenue and Trends by type of Application
11.8.4. Company Revenue and Product Analysis
11.8.5. APAC Segment – Product type and Application Market Size
11.8.5.1. China
11.8.5.2. Australia
11.8.5.3. Japan
11.8.5.4. South Korea
11.8.5.5. India
11.8.5.6. Taiwan
11.8.5.7. Malaysia
12. Branded Generics Market - Entropy
12.1. New product launches
12.2. M&A's, collaborations, JVs and partnerships
13. Branded Generics Market – Industry / Segment Competition landscape Premium
13.1. Market Share Analysis
13.1.1. Market Share by Country- Top companies
13.1.2. Market Share by Region- Top 10 companies
13.1.3. Market Share by type of Application – Top 10 companies
13.1.4. Market Share by type of Product / Product category- Top 10 companies
13.1.5. Market Share at global level- Top 10 companies
13.1.6. Best Practises for companies
14. Branded Generics Market – Key Company List by Country Premium
15. Branded Generics Market Company Analysis
15.1. Market Share, Company Revenue, Products, M&A, Developments
15.2. Teva Pharmaceuticals Industries Ltd. (Israel)
15.3. Mylan N.V. (U.S.)
15.4. Hospira Inc. (U.S.)
15.5. Astra Zeneca (U.K.)
15.6. Sanofi SA (France)
15.7. Lupin Pharmaceuticals (India)
15.8. Zydus Cadila (India)
15.9. Valeant Pharmaceuticals (Canada)
15.10. GlaxoSmithKline Pharmaceuticals Limited (India
15.11. Apotex Inc. (Canada)
15.12. Dr. Reddys Laboratories Ltd. (India)
15.13. Company 10
15.14. Company 10
15.15. Company 10
"*Financials would be provided on a best efforts basis for private companies"
16. Branded Generics Market -Appendix
16.1. Abbreviations
16.2. Sources
17. Branded Generics Market -Methodology Premium
17.1. Research Methodology
17.1.1. Company Expert Interviews
17.1.2. Industry Databases
17.1.3. Associations
17.1.4. Company News
17.1.5. Company Annual Reports
17.1.6. Application Trends
17.1.7. New Products and Product database
17.1.8. Company Transcripts
17.1.9. R&D Trends
17.1.10. Key Opinion Leaders Interviews
17.1.11. Supply and Demand Trends
List of Tables
Table 1: Branded Generics Market Overview 2021-2026
Table 2: Branded Generics Market Leader Analysis 2018-2019 (US$)
Table 3: Branded Generics Market Product Analysis 2018-2019 (US$)
Table 4: Branded Generics Market End User Analysis 2018-2019 (US$)
Table 5: Branded Generics Market Patent Analysis 2013-2018* (US$)
Table 6: Branded Generics Market Financial Analysis 2018-2019 (US$)
Table 7: Branded Generics Market Driver Analysis 2018-2019 (US$)
Table 8: Branded Generics Market Challenges Analysis 2018-2019 (US$)
Table 9: Branded Generics Market Constraint Analysis 2018-2019 (US$)
Table 10: Branded Generics Market Supplier Bargaining Power Analysis 2018-2019 (US$)
Table 11: Branded Generics Market Buyer Bargaining Power Analysis 2018-2019 (US$)
Table 12: Branded Generics Market Threat of Substitutes Analysis 2018-2019 (US$)
Table 13: Branded Generics Market Threat of New Entrants Analysis 2018-2019 (US$)
Table 14: Branded Generics Market Degree of Competition Analysis 2018-2019 (US$)
Table 15: Branded Generics Market Value Chain Analysis 2018-2019 (US$)
Table 16: Branded Generics Market Pricing Analysis 2021-2026 (US$)
Table 17: Branded Generics Market Opportunities Analysis 2021-2026 (US$)
Table 18: Branded Generics Market Product Life Cycle Analysis 2021-2026 (US$)
Table 19: Branded Generics Market Supplier Analysis 2018-2019 (US$)
Table 20: Branded Generics Market Distributor Analysis 2018-2019 (US$)
Table 21: Branded Generics Market Trend Analysis 2018-2019 (US$)
Table 22: Branded Generics Market Size 2018 (US$)
Table 23: Branded Generics Market Forecast Analysis 2021-2026 (US$)
Table 24: Branded Generics Market Sales Forecast Analysis 2021-2026 (Units)
Table 25: Branded Generics Market , Revenue & Volume, By Type, 2021-2026 ($)
Table 26: Branded Generics Market By Type, Revenue & Volume, By Value Added Branded Generics, 2021-2026 ($)
Table 27: Branded Generics Market By Type, Revenue & Volume, By Trade Named Branded Generics, 2021-2026 ($)
Table 28: Branded Generics Market , Revenue & Volume, By Distribution, 2021-2026 ($)
Table 29: Branded Generics Market By Distribution, Revenue & Volume, By Retail Pharmacy & Drug Stores, 2021-2026 ($)
Table 30: Branded Generics Market By Distribution, Revenue & Volume, By Clinics, 2021-2026 ($)
Table 31: Branded Generics Market By Distribution, Revenue & Volume, By Hospital Pharmacies, 2021-2026 ($)
Table 32: Branded Generics Market , Revenue & Volume, By Application, 2021-2026 ($)
Table 33: Branded Generics Market By Application, Revenue & Volume, By Cardiovascular Drugs, 2021-2026 ($)
Table 34: Branded Generics Market By Application, Revenue & Volume, By Anti-Cancer Drugs, 2021-2026 ($)
Table 35: Branded Generics Market By Application, Revenue & Volume, By CNS Drugs, 2021-2026 ($)
Table 36: Branded Generics Market By Application, Revenue & Volume, By Anti-Infective Drugs, 2021-2026 ($)
Table 37: North America Branded Generics Market , Revenue & Volume, By Type, 2021-2026 ($)
Table 38: North America Branded Generics Market , Revenue & Volume, By Distribution, 2021-2026 ($)
Table 39: North America Branded Generics Market , Revenue & Volume, By Application, 2021-2026 ($)
Table 40: South america Branded Generics Market , Revenue & Volume, By Type, 2021-2026 ($)
Table 41: South america Branded Generics Market , Revenue & Volume, By Distribution, 2021-2026 ($)
Table 42: South america Branded Generics Market , Revenue & Volume, By Application, 2021-2026 ($)
Table 43: Europe Branded Generics Market , Revenue & Volume, By Type, 2021-2026 ($)
Table 44: Europe Branded Generics Market , Revenue & Volume, By Distribution, 2021-2026 ($)
Table 45: Europe Branded Generics Market , Revenue & Volume, By Application, 2021-2026 ($)
Table 46: APAC Branded Generics Market , Revenue & Volume, By Type, 2021-2026 ($)
Table 47: APAC Branded Generics Market , Revenue & Volume, By Distribution, 2021-2026 ($)
Table 48: APAC Branded Generics Market , Revenue & Volume, By Application, 2021-2026 ($)
Table 49: Middle East & Africa Branded Generics Market , Revenue & Volume, By Type, 2021-2026 ($)
Table 50: Middle East & Africa Branded Generics Market , Revenue & Volume, By Distribution, 2021-2026 ($)
Table 51: Middle East & Africa Branded Generics Market , Revenue & Volume, By Application, 2021-2026 ($)
Table 52: Russia Branded Generics Market , Revenue & Volume, By Type, 2021-2026 ($)
Table 53: Russia Branded Generics Market , Revenue & Volume, By Distribution, 2021-2026 ($)
Table 54: Russia Branded Generics Market , Revenue & Volume, By Application, 2021-2026 ($)
Table 55: Israel Branded Generics Market , Revenue & Volume, By Type, 2021-2026 ($)
Table 56: Israel Branded Generics Market , Revenue & Volume, By Distribution, 2021-2026 ($)
Table 57: Israel Branded Generics Market , Revenue & Volume, By Application, 2021-2026 ($)
Table 58: Top Companies 2018 (US$)Branded Generics Market , Revenue & Volume
Table 59: Product Launch 2018-2019Branded Generics Market , Revenue & Volume
Table 60: Mergers & Acquistions 2018-2019Branded Generics Market , Revenue & Volume
List of Figures:
Figure 1 Overview of Branded Generics Market 2021-2026
Figure 2 Market Share Analysis for Branded Generics Market 2018 (US$)
Figure 3 Product Comparison in Branded Generics Market 2018-2019 (US$)
Figure 4 End User Profile for Branded Generics Market 2018-2019 (US$)
Figure 5 Patent Application and Grant in Branded Generics Market 2013-2018* (US$)
Figure 6 Top 5 Companies Financial Analysis in Branded Generics Market 2018-2019 (US$)
Figure 7 Market Entry Strategy in Branded Generics Market 2018-2019
Figure 8 Ecosystem Analysis in Branded Generics Market 2018
Figure 9 Average Selling Price in Branded Generics Market 2021-2026
Figure 10 Top Opportunites in Branded Generics Market 2018-2019
Figure 11 Market Life Cycle Analysis in Branded Generics Market
Figure 12 GlobalBy TypeBranded Generics Market Revenue, 2021-2026 ($)
Figure 13 GlobalBy DistributionBranded Generics Market Revenue, 2021-2026 ($)
Figure 14 GlobalBy ApplicationBranded Generics Market Revenue, 2021-2026 ($)
Figure 15 Global Branded Generics Market - By Geography
Figure 16 Global Branded Generics Market Value & Volume, By Geography, 2021-2026 ($)
Figure 17 Global Branded Generics Market CAGR, By Geography, 2021-2026 (%)
Figure 18 North America Branded Generics Market Value & Volume, 2021-2026 ($)
Figure 19 US Branded Generics Market Value & Volume, 2021-2026 ($)
Figure 20 US GDP and Population, 2018-2019 ($)
Figure 21 US GDP – Composition of 2018, By Sector of Origin
Figure 22 US Export and Import Value & Volume, 2018-2019 ($)
Figure 23 Canada Branded Generics Market Value & Volume, 2021-2026 ($)
Figure 24 Canada GDP and Population, 2018-2019 ($)
Figure 25 Canada GDP – Composition of 2018, By Sector of Origin
Figure 26 Canada Export and Import Value & Volume, 2018-2019 ($)
Figure 27 Mexico Branded Generics Market Value & Volume, 2021-2026 ($)
Figure 28 Mexico GDP and Population, 2018-2019 ($)
Figure 29 Mexico GDP – Composition of 2018, By Sector of Origin
Figure 30 Mexico Export and Import Value & Volume, 2018-2019 ($)
Figure 31 South America Branded Generics Market Value & Volume, 2021-2026 ($)
Figure 32 Brazil Branded Generics Market Value & Volume, 2021-2026 ($)
Figure 33 Brazil GDP and Population, 2018-2019 ($)
Figure 34 Brazil GDP – Composition of 2018, By Sector of Origin
Figure 35 Brazil Export and Import Value & Volume, 2018-2019 ($)
Figure 36 Venezuela Branded Generics Market Value & Volume, 2021-2026 ($)
Figure 37 Venezuela GDP and Population, 2018-2019 ($)
Figure 38 Venezuela GDP – Composition of 2018, By Sector of Origin
Figure 39 Venezuela Export and Import Value & Volume, 2018-2019 ($)
Figure 40 Argentina Branded Generics Market Value & Volume, 2021-2026 ($)
Figure 41 Argentina GDP and Population, 2018-2019 ($)
Figure 42 Argentina GDP – Composition of 2018, By Sector of Origin
Figure 43 Argentina Export and Import Value & Volume, 2018-2019 ($)
Figure 44 Ecuador Branded Generics Market Value & Volume, 2021-2026 ($)
Figure 45 Ecuador GDP and Population, 2018-2019 ($)
Figure 46 Ecuador GDP – Composition of 2018, By Sector of Origin
Figure 47 Ecuador Export and Import Value & Volume, 2018-2019 ($)
Figure 48 Peru Branded Generics Market Value & Volume, 2021-2026 ($)
Figure 49 Peru GDP and Population, 2018-2019 ($)
Figure 50 Peru GDP – Composition of 2018, By Sector of Origin
Figure 51 Peru Export and Import Value & Volume, 2018-2019 ($)
Figure 52 Colombia Branded Generics Market Value & Volume, 2021-2026 ($)
Figure 53 Colombia GDP and Population, 2018-2019 ($)
Figure 54 Colombia GDP – Composition of 2018, By Sector of Origin
Figure 55 Colombia Export and Import Value & Volume, 2018-2019 ($)
Figure 56 Costa Rica Branded Generics Market Value & Volume, 2021-2026 ($)
Figure 57 Costa Rica GDP and Population, 2018-2019 ($)
Figure 58 Costa Rica GDP – Composition of 2018, By Sector of Origin
Figure 59 Costa Rica Export and Import Value & Volume, 2018-2019 ($)
Figure 60 Europe Branded Generics Market Value & Volume, 2021-2026 ($)
Figure 61 U.K Branded Generics Market Value & Volume, 2021-2026 ($)
Figure 62 U.K GDP and Population, 2018-2019 ($)
Figure 63 U.K GDP – Composition of 2018, By Sector of Origin
Figure 64 U.K Export and Import Value & Volume, 2018-2019 ($)
Figure 65 Germany Branded Generics Market Value & Volume, 2021-2026 ($)
Figure 66 Germany GDP and Population, 2018-2019 ($)
Figure 67 Germany GDP – Composition of 2018, By Sector of Origin
Figure 68 Germany Export and Import Value & Volume, 2018-2019 ($)
Figure 69 Italy Branded Generics Market Value & Volume, 2021-2026 ($)
Figure 70 Italy GDP and Population, 2018-2019 ($)
Figure 71 Italy GDP – Composition of 2018, By Sector of Origin
Figure 72 Italy Export and Import Value & Volume, 2018-2019 ($)
Figure 73 France Branded Generics Market Value & Volume, 2021-2026 ($)
Figure 74 France GDP and Population, 2018-2019 ($)
Figure 75 France GDP – Composition of 2018, By Sector of Origin
Figure 76 France Export and Import Value & Volume, 2018-2019 ($)
Figure 77 Netherlands Branded Generics Market Value & Volume, 2021-2026 ($)
Figure 78 Netherlands GDP and Population, 2018-2019 ($)
Figure 79 Netherlands GDP – Composition of 2018, By Sector of Origin
Figure 80 Netherlands Export and Import Value & Volume, 2018-2019 ($)
Figure 81 Belgium Branded Generics Market Value & Volume, 2021-2026 ($)
Figure 82 Belgium GDP and Population, 2018-2019 ($)
Figure 83 Belgium GDP – Composition of 2018, By Sector of Origin
Figure 84 Belgium Export and Import Value & Volume, 2018-2019 ($)
Figure 85 Spain Branded Generics Market Value & Volume, 2021-2026 ($)
Figure 86 Spain GDP and Population, 2018-2019 ($)
Figure 87 Spain GDP – Composition of 2018, By Sector of Origin
Figure 88 Spain Export and Import Value & Volume, 2018-2019 ($)
Figure 89 Denmark Branded Generics Market Value & Volume, 2021-2026 ($)
Figure 90 Denmark GDP and Population, 2018-2019 ($)
Figure 91 Denmark GDP – Composition of 2018, By Sector of Origin
Figure 92 Denmark Export and Import Value & Volume, 2018-2019 ($)
Figure 93 APAC Branded Generics Market Value & Volume, 2021-2026 ($)
Figure 94 China Branded Generics Market Value & Volume, 2021-2026
Figure 95 China GDP and Population, 2018-2019 ($)
Figure 96 China GDP – Composition of 2018, By Sector of Origin
Figure 97 China Export and Import Value & Volume, 2018-2019 ($)Branded Generics Market China Export and Import Value & Volume, 2018-2019 ($)
Figure 98 Australia Branded Generics Market Value & Volume, 2021-2026 ($)
Figure 99 Australia GDP and Population, 2018-2019 ($)
Figure 100 Australia GDP – Composition of 2018, By Sector of Origin
Figure 101 Australia Export and Import Value & Volume, 2018-2019 ($)
Figure 102 South Korea Branded Generics Market Value & Volume, 2021-2026 ($)
Figure 103 South Korea GDP and Population, 2018-2019 ($)
Figure 104 South Korea GDP – Composition of 2018, By Sector of Origin
Figure 105 South Korea Export and Import Value & Volume, 2018-2019 ($)
Figure 106 India Branded Generics Market Value & Volume, 2021-2026 ($)
Figure 107 India GDP and Population, 2018-2019 ($)
Figure 108 India GDP – Composition of 2018, By Sector of Origin
Figure 109 India Export and Import Value & Volume, 2018-2019 ($)
Figure 110 Taiwan Branded Generics Market Value & Volume, 2021-2026 ($)
Figure 111 Taiwan GDP and Population, 2018-2019 ($)
Figure 112 Taiwan GDP – Composition of 2018, By Sector of Origin
Figure 113 Taiwan Export and Import Value & Volume, 2018-2019 ($)
Figure 114 Malaysia Branded Generics Market Value & Volume, 2021-2026 ($)
Figure 115 Malaysia GDP and Population, 2018-2019 ($)
Figure 116 Malaysia GDP – Composition of 2018, By Sector of Origin
Figure 117 Malaysia Export and Import Value & Volume, 2018-2019 ($)
Figure 118 Hong Kong Branded Generics Market Value & Volume, 2021-2026 ($)
Figure 119 Hong Kong GDP and Population, 2018-2019 ($)
Figure 120 Hong Kong GDP – Composition of 2018, By Sector of Origin
Figure 121 Hong Kong Export and Import Value & Volume, 2018-2019 ($)
Figure 122 Middle East & Africa Branded Generics Market Middle East & Africa 3D Printing Market Value & Volume, 2021-2026 ($)
Figure 123 Russia Branded Generics Market Value & Volume, 2021-2026 ($)
Figure 124 Russia GDP and Population, 2018-2019 ($)
Figure 125 Russia GDP – Composition of 2018, By Sector of Origin
Figure 126 Russia Export and Import Value & Volume, 2018-2019 ($)
Figure 127 Israel Branded Generics Market Value & Volume, 2021-2026 ($)
Figure 128 Israel GDP and Population, 2018-2019 ($)
Figure 129 Israel GDP – Composition of 2018, By Sector of Origin
Figure 130 Israel Export and Import Value & Volume, 2018-2019 ($)
Figure 131 Entropy Share, By Strategies, 2018-2019* (%)Branded Generics Market
Figure 132 Developments, 2018-2019*Branded Generics Market
Figure 133 Company 1 Branded Generics Market Net Revenue, By Years, 2018-2019* ($)
Figure 134 Company 1 Branded Generics Market Net Revenue Share, By Business segments, 2018 (%)
Figure 135 Company 1 Branded Generics Market Net Sales Share, By Geography, 2018 (%)
Figure 136 Company 2 Branded Generics Market Net Revenue, By Years, 2018-2019* ($)
Figure 137 Company 2 Branded Generics Market Net Revenue Share, By Business segments, 2018 (%)
Figure 138 Company 2 Branded Generics Market Net Sales Share, By Geography, 2018 (%)
Figure 139 Company 3 Branded Generics Market Net Revenue, By Years, 2018-2019* ($)
Figure 140 Company 3 Branded Generics Market Net Revenue Share, By Business segments, 2018 (%)
Figure 141 Company 3 Branded Generics Market Net Sales Share, By Geography, 2018 (%)
Figure 142 Company 4 Branded Generics Market Net Revenue, By Years, 2018-2019* ($)
Figure 143 Company 4 Branded Generics Market Net Revenue Share, By Business segments, 2018 (%)
Figure 144 Company 4 Branded Generics Market Net Sales Share, By Geography, 2018 (%)
Figure 145 Company 5 Branded Generics Market Net Revenue, By Years, 2018-2019* ($)
Figure 146 Company 5 Branded Generics Market Net Revenue Share, By Business segments, 2018 (%)
Figure 147 Company 5 Branded Generics Market Net Sales Share, By Geography, 2018 (%)
Figure 148 Company 6 Branded Generics Market Net Revenue, By Years, 2018-2019* ($)
Figure 149 Company 6 Branded Generics Market Net Revenue Share, By Business segments, 2018 (%)
Figure 150 Company 6 Branded Generics Market Net Sales Share, By Geography, 2018 (%)
Figure 151 Company 7 Branded Generics Market Net Revenue, By Years, 2018-2019* ($)
Figure 152 Company 7 Branded Generics Market Net Revenue Share, By Business segments, 2018 (%)
Figure 153 Company 7 Branded Generics Market Net Sales Share, By Geography, 2018 (%)
Figure 154 Company 8 Branded Generics Market Net Revenue, By Years, 2018-2019* ($)
Figure 155 Company 8 Branded Generics Market Net Revenue Share, By Business segments, 2018 (%)
Figure 156 Company 8 Branded Generics Market Net Sales Share, By Geography, 2018 (%)
Figure 157 Company 9 Branded Generics Market Net Revenue, By Years, 2018-2019* ($)
Figure 158 Company 9 Branded Generics Market Net Revenue Share, By Business segments, 2018 (%)
Figure 159 Company 9 Branded Generics Market Net Sales Share, By Geography, 2018 (%)
Figure 160 Company 10 Branded Generics Market Net Revenue, By Years, 2018-2019* ($)
Figure 161 Company 10 Branded Generics Market Net Revenue Share, By Business segments, 2018 (%)
Figure 162 Company 10 Branded Generics Market Net Sales Share, By Geography, 2018 (%)
Figure 163 Company 11 Branded Generics Market Net Revenue, By Years, 2018-2019* ($)
Figure 164 Company 11 Branded Generics Market Net Revenue Share, By Business segments, 2018 (%)
Figure 165 Company 11 Branded Generics Market Net Sales Share, By Geography, 2018 (%)
Figure 166 Company 12 Branded Generics Market Net Revenue, By Years, 2018-2019* ($)
Figure 167 Company 12 Branded Generics Market Net Revenue Share, By Business segments, 2018 (%)
Figure 168 Company 12 Branded Generics Market Net Sales Share, By Geography, 2018 (%)
Figure 169 Company 13 Branded Generics Market Net Revenue, By Years, 2018-2019* ($)
Figure 170 Company 13 Branded Generics Market Net Revenue Share, By Business segments, 2018 (%)
Figure 171 Company 13 Branded Generics Market Net Sales Share, By Geography, 2018 (%)
Figure 172 Company 14 Branded Generics Market Net Revenue, By Years, 2018-2019* ($)
Figure 173 Company 14 Branded Generics Market Net Revenue Share, By Business segments, 2018 (%)
Figure 174 Company 14 Branded Generics Market Net Sales Share, By Geography, 2018 (%)
Figure 175 Company 15 Branded Generics Market Net Revenue, By Years, 2018-2019* ($)
Figure 176 Company 15 Branded Generics Market Net Revenue Share, By Business segments, 2018 (%)
Figure 177 Company 15 Branded Generics Market Net Sales Share, By Geography, 2018 (%)