 Email
Email Print
Print


Preimplantation Genetic Diagnosis Market - Forecast(2024 - 2030)
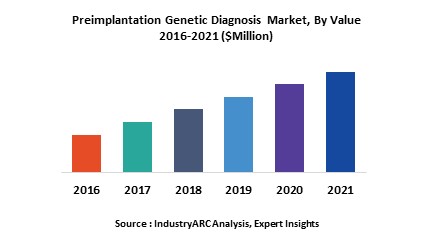
Preimplantation genetic diagnosis (PGD) can be defined as a medical procedure generally used prior to implantation in order to identify genetic defects within embryos created through in vitro fertilization and prevent certain diseases or disorders from being passed on to the child. Preimplantation genetic diagnosis is a newer treatment procedure and is gaining popularity due to increasing awareness amongst people across the world apart from growing popularity growing popularity developing healthcare infrastructure and growing medical tourism in the developing economies is expected to be the key growth drivers during the period of study. However, higher cost of treatment is expected to be the key challenge in developing countries.
This report identifies the preimplantation genetic diagnosis market size in for the year 2014-2016, and forecast of the same for year 2021. It also highlights the potential growth opportunities in the coming years, while also reviewing the market drivers, restraints, growth indicators, challenges, market dynamics, competitive landscape, and other key aspects with respect to preimplantation genetic diagnosis market.
Geographically, North America dominated the preimplantation genetic diagnosis market due to advanced and well developed healthcare infrastructure and higher awareness about such treatments amongst population and practitioners. North America was followed by Europe and Asia-Pacific as the second and third largest markets. Asia Pacific is projected to have the fastest growth, owing to rapidly increasing population, rise in medical expenditure in developing nations such as China, and India in this region.
This report segments preimplantation genetic diagnosis market on the basis of technology, product, end user, application and regional market as follows:
- Preimplantation Genetic Diagnosis Market, By Product Type: Instrument and Reagent
- Preimplantation Genetic Diagnosis Market, By Technology: Polymerase Chain Reaction (PCR), Next Generation Sequencing (NGS), Fluorescence In-situ Hybridization (FISH) and Comparative Genomic Hybridization (CGH)
- The report has focused study on preimplantation genetic diagnosis market by basis of application as follows: HLA Typing, Inheritable Genetic Disorders, Chromosomal Abnormalities, Single Gene Disorders, Gender Identification and Sex Linked Disorders
- The report has focused study on preimplantation genetic diagnosis market by basis of end-user as follows: Hospital, Diagnostic Lab, Research Lab, Academia
- This report on preimplntation genetic diagnosis has been further segmented into major regions, which includes detailed analysis of each region such as: North America, Europe, Asia-Pacific (APAC), and Rest of the World (RoW) covering all the major country level markets in each of the region
This report identifies all the major companies operating in the preimplantation genetic diagnosis market. Some of the major companies’ profiles in detail are as follows:
- Abbott Laboratories, Inc. (U.S.)
- F. Hoffmann-La Roche. Ltd. (Switzerland)
- Genesis Genetics, LLC (U.S.)
- Illumina, Inc. (U.S.)
- Laboratory Corporation of America Holdings (U.S.)
1. Preimplantation Genetic Diagnosis Market – Overview
2. Executive Summary
3. Market Landscape
3.1. Market Share Analysis
3.2. Comparative Analysis
3.3. Product Benchmarking
3.4. End User Profiling
3.5. Top 5 Financials Analysis
4. Preimplantation Genetic Diagnosis Market–Forces
4.1. Drivers
4.1.1. Increasing preference for personalized medicine
4.1.2. Growing awareness related to genetic techniques
4.2. Restraints
4.2.1. Higher cost of treatment
4.3. Opportunities
4.4. Challenges
4.5. Porter’s Five Forces Analysis
4.5.1. Bargaining Power of Suppliers
4.5.2. Bargaining Power of Buyers
4.5.3. Threat of New Entrants
4.5.4. Threat of Substitutes
4.5.5. Degree of Competition
5. Preimplantation Genetic Diagnosis Market – Strategic Analysis
5.1. Value Chain Analysis
5.2. Pricing Analysis
5.3. Opportunities Analysis
5.4. Product/Market Life cycle Analysis
5.5. Suppliers & Distributors
6. Preimplantation Genetic Diagnosis Market, By Technology
6.1. Polymerase Chain Reaction (PCR)
6.2. Next Generation Sequencing (NGS)
6.3. Fluorescence In-situ Hybridization (FISH)
6.4. Comparative Genomic Hybridization (CGH)
7. Preimplantation Genetic Diagnosis Market, By Product
7.1. Instrument
7.2. Reagent
8. Preimplantation Genetic Diagnosis Market, By End-User
8.1. Hospital
8.2. Diagnostic Lab
8.3. Research Lab
8.4. Academia
9. Preimplantation Genetic Diagnosis Market, By Application
9.1. HLA Typing
9.2. Inheritable Genetic Disorders
9.3. Chromosomal Abnormalities
9.4. Single Gene Disorders
9.5. Gender Identification
9.6. Sex Linked Disorders
10. Preimplantation Genetic Diagnosis Market, By Geography
10.1. Europe
10.1.1. Germany
10.1.2. France
10.1.3. Italy
10.1.4. Spain
10.1.5. Russia
10.1.6. U.K.
10.1.7. Rest of Europe
10.2. Asia Pacific
10.2.1. China
10.2.2. India
10.2.3. Japan
10.2.4. South Korea
10.2.5. Rest of Asia-Pacific
10.3. North America
10.3.1. U.S.
10.3.2. Canada
10.3.3. Mexico
10.4. Rest of the World (RoW)
10.4.1. Brazil
10.4.2. Rest of RoW
11. Preimplantation Genetic Diagnosis – Market Entropy
11.1. Expansion
11.2. Technological Developments
11.3. Merger & Acquisitions, and Joint Ventures
11.4. Supply- Contract
12. Company Profiles (Overview, Financials, SWOT Analysis, Developments, Product Portfolio)
12.1. Abbott Laboratories, Inc. (U.S.)
12.2. F. Hoffmann-La Roche. Ltd. (Switzerland)
12.3. Genesis Genetics, LLC (U.S.)
12.4. Illumina, Inc. (U.S.)
12.5. Laboratory Corporation of America Holdings (U.S.)
12.6. Natera, Inc. (U.S.)
12.7. PerkinElmer, Inc. (U.S.)
12.8. Quest Diagnostics, Inc. (U.S.)
12.9. Reproductive Genetics Institute (U.S.)
12.10. Reprogenetics LLC (U.S.)
* More than 40 Companies are profiled in this Research Report, Complete List available on Request*
"Financials would be provided on a best efforts basis for private companies"
13. Appendix
13.1. Abbreviations
13.2. Sources
13.3. Research Methodology
13.4. Bibiliography
13.5. Compilation of Expert Insights
13.6. Disclaimer
List of Tables
Table 1 Preimplantation Genetic Diagnosis Market Overview 2021-2026
Table 2 Preimplantation Genetic Diagnosis Market Leader Analysis 2018-2019 (US$)
Table 3 Preimplantation Genetic Diagnosis MarketProduct Analysis 2018-2019 (US$)
Table 4 Preimplantation Genetic Diagnosis MarketEnd User Analysis 2018-2019 (US$)
Table 5 Preimplantation Genetic Diagnosis MarketPatent Analysis 2013-2018* (US$)
Table 6 Preimplantation Genetic Diagnosis MarketFinancial Analysis 2018-2019 (US$)
Table 7 Preimplantation Genetic Diagnosis Market Driver Analysis 2018-2019 (US$)
Table 8 Preimplantation Genetic Diagnosis MarketChallenges Analysis 2018-2019 (US$)
Table 9 Preimplantation Genetic Diagnosis MarketConstraint Analysis 2018-2019 (US$)
Table 10 Preimplantation Genetic Diagnosis Market Supplier Bargaining Power Analysis 2018-2019 (US$)
Table 11 Preimplantation Genetic Diagnosis Market Buyer Bargaining Power Analysis 2018-2019 (US$)
Table 12 Preimplantation Genetic Diagnosis Market Threat of Substitutes Analysis 2018-2019 (US$)
Table 13 Preimplantation Genetic Diagnosis Market Threat of New Entrants Analysis 2018-2019 (US$)
Table 14 Preimplantation Genetic Diagnosis Market Degree of Competition Analysis 2018-2019 (US$)
Table 15 Preimplantation Genetic Diagnosis MarketValue Chain Analysis 2018-2019 (US$)
Table 16 Preimplantation Genetic Diagnosis MarketPricing Analysis 2021-2026 (US$)
Table 17 Preimplantation Genetic Diagnosis MarketOpportunities Analysis 2021-2026 (US$)
Table 18 Preimplantation Genetic Diagnosis MarketProduct Life Cycle Analysis 2021-2026 (US$)
Table 19 Preimplantation Genetic Diagnosis MarketSupplier Analysis 2018-2019 (US$)
Table 20 Preimplantation Genetic Diagnosis MarketDistributor Analysis 2018-2019 (US$)
Table 21 Preimplantation Genetic Diagnosis Market Trend Analysis 2018-2019 (US$)
Table 22 Preimplantation Genetic Diagnosis Market Size 2018 (US$)
Table 23 Preimplantation Genetic Diagnosis Market Forecast Analysis 2021-2026 (US$)
Table 24 Preimplantation Genetic Diagnosis Market Sales Forecast Analysis 2021-2026 (Units)
Table 25 Preimplantation Genetic Diagnosis Market, Revenue & Volume,By Product, 2021-2026 ($)
Table 26 Preimplantation Genetic Diagnosis MarketBy Product, Revenue & Volume,By Instrument, 2021-2026 ($)
Table 27 Preimplantation Genetic Diagnosis MarketBy Product, Revenue & Volume,By Reagent, 2021-2026 ($)
Table 28 Preimplantation Genetic Diagnosis Market, Revenue & Volume,By Technology, 2021-2026 ($)
Table 29 Preimplantation Genetic Diagnosis MarketBy Technology, Revenue & Volume,By Polymerase Chain Reaction, 2021-2026 ($)
Table 30 Preimplantation Genetic Diagnosis MarketBy Technology, Revenue & Volume,By Next Generation Sequencing, 2021-2026 ($)
Table 31 Preimplantation Genetic Diagnosis MarketBy Technology, Revenue & Volume,By Fluorescence In-situ Hybridization , 2021-2026 ($)
Table 32 Preimplantation Genetic Diagnosis MarketBy Technology, Revenue & Volume,By Comparative Genomic Hybridization (, 2021-2026 ($)
Table 33 Preimplantation Genetic Diagnosis Market, Revenue & Volume,By Application, 2021-2026 ($)
Table 34 Preimplantation Genetic Diagnosis MarketBy Application, Revenue & Volume,By HLA Typing, 2021-2026 ($)
Table 35 Preimplantation Genetic Diagnosis MarketBy Application, Revenue & Volume,By Inheritable Genetic Disorders, 2021-2026 ($)
Table 36 Preimplantation Genetic Diagnosis MarketBy Application, Revenue & Volume,By Chromosomal Abnormalities, 2021-2026 ($)
Table 37 Preimplantation Genetic Diagnosis MarketBy Application, Revenue & Volume,By Single Gene Disorders, 2021-2026 ($)
Table 38 Preimplantation Genetic Diagnosis MarketBy Application, Revenue & Volume,By Gender Identification, 2021-2026 ($)
Table 39 Preimplantation Genetic Diagnosis Market, Revenue & Volume,By End Use, 2021-2026 ($)
Table 40 Preimplantation Genetic Diagnosis MarketBy End Use, Revenue & Volume,By Hospital, 2021-2026 ($)
Table 41 Preimplantation Genetic Diagnosis MarketBy End Use, Revenue & Volume,By Diagnostic Lab, 2021-2026 ($)
Table 42 Preimplantation Genetic Diagnosis MarketBy End Use, Revenue & Volume,By Research Lab, 2021-2026 ($)
Table 43 Preimplantation Genetic Diagnosis MarketBy End Use, Revenue & Volume,By Academia , 2021-2026 ($)
Table 44 North America Preimplantation Genetic Diagnosis Market, Revenue & Volume,By Product, 2021-2026 ($)
Table 45 North America Preimplantation Genetic Diagnosis Market, Revenue & Volume,By Technology, 2021-2026 ($)
Table 46 North America Preimplantation Genetic Diagnosis Market, Revenue & Volume,By Application, 2021-2026 ($)
Table 47 North America Preimplantation Genetic Diagnosis Market, Revenue & Volume,By End Use, 2021-2026 ($)
Table 48 South america Preimplantation Genetic Diagnosis Market, Revenue & Volume,By Product, 2021-2026 ($)
Table 49 South america Preimplantation Genetic Diagnosis Market, Revenue & Volume,By Technology, 2021-2026 ($)
Table 50 South america Preimplantation Genetic Diagnosis Market, Revenue & Volume,By Application, 2021-2026 ($)
Table 51 South america Preimplantation Genetic Diagnosis Market, Revenue & Volume,By End Use, 2021-2026 ($)
Table 52 Europe Preimplantation Genetic Diagnosis Market, Revenue & Volume,By Product, 2021-2026 ($)
Table 53 Europe Preimplantation Genetic Diagnosis Market, Revenue & Volume,By Technology, 2021-2026 ($)
Table 54 Europe Preimplantation Genetic Diagnosis Market, Revenue & Volume,By Application, 2021-2026 ($)
Table 55 Europe Preimplantation Genetic Diagnosis Market, Revenue & Volume,By End Use, 2021-2026 ($)
Table 56 APAC Preimplantation Genetic Diagnosis Market, Revenue & Volume,By Product, 2021-2026 ($)
Table 57 APAC Preimplantation Genetic Diagnosis Market, Revenue & Volume,By Technology, 2021-2026 ($)
Table 58 APAC Preimplantation Genetic Diagnosis Market, Revenue & Volume,By Application, 2021-2026 ($)
Table 59 APAC Preimplantation Genetic Diagnosis Market, Revenue & Volume,By End Use, 2021-2026 ($)
Table 60 Middle East & Africa Preimplantation Genetic Diagnosis Market, Revenue & Volume,By Product, 2021-2026 ($)
Table 61 Middle East & Africa Preimplantation Genetic Diagnosis Market, Revenue & Volume,By Technology, 2021-2026 ($)
Table 62 Middle East & Africa Preimplantation Genetic Diagnosis Market, Revenue & Volume,By Application, 2021-2026 ($)
Table 63 Middle East & Africa Preimplantation Genetic Diagnosis Market, Revenue & Volume,By End Use, 2021-2026 ($)
Table 64 Russia Preimplantation Genetic Diagnosis Market, Revenue & Volume,By Product, 2021-2026 ($)
Table 65 Russia Preimplantation Genetic Diagnosis Market, Revenue & Volume,By Technology, 2021-2026 ($)
Table 66 Russia Preimplantation Genetic Diagnosis Market, Revenue & Volume,By Application, 2021-2026 ($)
Table 67 Russia Preimplantation Genetic Diagnosis Market, Revenue & Volume,By End Use, 2021-2026 ($)
Table 68 Israel Preimplantation Genetic Diagnosis Market, Revenue & Volume,By Product, 2021-2026 ($)
Table 69 Israel Preimplantation Genetic Diagnosis Market, Revenue & Volume,By Technology, 2021-2026 ($)
Table 70 Israel Preimplantation Genetic Diagnosis Market, Revenue & Volume,By Application, 2021-2026 ($)
Table 71 Israel Preimplantation Genetic Diagnosis Market, Revenue & Volume,By End Use, 2021-2026 ($)
Table 72 Top Companies 2018 (US$)Preimplantation Genetic Diagnosis Market, Revenue & Volume,,
Table 73 Product Launch 2018-2019Preimplantation Genetic Diagnosis Market, Revenue & Volume,,
Table 74 Mergers & Acquistions 2018-2019Preimplantation Genetic Diagnosis Market, Revenue & Volume,,
List of Figures
Figure 1 Overview of Preimplantation Genetic Diagnosis Market 2021-2026
Figure 2 Market Share Analysis for Preimplantation Genetic Diagnosis Market 2018 (US$)
Figure 3 Product Comparison in Preimplantation Genetic Diagnosis Market 2018-2019 (US$)
Figure 4 End User Profile for Preimplantation Genetic Diagnosis Market 2018-2019 (US$)
Figure 5 Patent Application and Grant in Preimplantation Genetic Diagnosis Market 2013-2018* (US$)
Figure 6 Top 5 Companies Financial Analysis in Preimplantation Genetic Diagnosis Market 2018-2019 (US$)
Figure 7 Market Entry Strategy in Preimplantation Genetic Diagnosis Market 2018-2019
Figure 8 Ecosystem Analysis in Preimplantation Genetic Diagnosis Market2018
Figure 9 Average Selling Price in Preimplantation Genetic Diagnosis Market 2021-2026
Figure 10 Top Opportunites in Preimplantation Genetic Diagnosis Market 2018-2019
Figure 11 Market Life Cycle Analysis in Preimplantation Genetic Diagnosis Market
Figure 12 GlobalBy ProductPreimplantation Genetic Diagnosis Market Revenue, 2021-2026 ($)
Figure 13 GlobalBy TechnologyPreimplantation Genetic Diagnosis Market Revenue, 2021-2026 ($)
Figure 14 GlobalBy ApplicationPreimplantation Genetic Diagnosis Market Revenue, 2021-2026 ($)
Figure 15 GlobalBy End UsePreimplantation Genetic Diagnosis Market Revenue, 2021-2026 ($)
Figure 16 Global Preimplantation Genetic Diagnosis Market - By Geography
Figure 17 Global Preimplantation Genetic Diagnosis Market Value & Volume, By Geography, 2021-2026 ($)
Figure 18 Global Preimplantation Genetic Diagnosis Market CAGR, By Geography, 2021-2026 (%)
Figure 19 North America Preimplantation Genetic Diagnosis Market Value & Volume, 2021-2026 ($)
Figure 20 US Preimplantation Genetic Diagnosis Market Value & Volume, 2021-2026 ($)
Figure 21 US GDP and Population, 2018-2019 ($)
Figure 22 US GDP – Composition of 2018, By Sector of Origin
Figure 23 US Export and Import Value & Volume, 2018-2019 ($)
Figure 24 Canada Preimplantation Genetic Diagnosis Market Value & Volume, 2021-2026 ($)
Figure 25 Canada GDP and Population, 2018-2019 ($)
Figure 26 Canada GDP – Composition of 2018, By Sector of Origin
Figure 27 Canada Export and Import Value & Volume, 2018-2019 ($)
Figure 28 Mexico Preimplantation Genetic Diagnosis Market Value & Volume, 2021-2026 ($)
Figure 29 Mexico GDP and Population, 2018-2019 ($)
Figure 30 Mexico GDP – Composition of 2018, By Sector of Origin
Figure 31 Mexico Export and Import Value & Volume, 2018-2019 ($)
Figure 32 South America Preimplantation Genetic Diagnosis MarketSouth America 3D Printing Market Value & Volume, 2021-2026 ($)
Figure 33 Brazil Preimplantation Genetic Diagnosis Market Value & Volume, 2021-2026 ($)
Figure 34 Brazil GDP and Population, 2018-2019 ($)
Figure 35 Brazil GDP – Composition of 2018, By Sector of Origin
Figure 36 Brazil Export and Import Value & Volume, 2018-2019 ($)
Figure 37 Venezuela Preimplantation Genetic Diagnosis Market Value & Volume, 2021-2026 ($)
Figure 38 Venezuela GDP and Population, 2018-2019 ($)
Figure 39 Venezuela GDP – Composition of 2018, By Sector of Origin
Figure 40 Venezuela Export and Import Value & Volume, 2018-2019 ($)
Figure 41 Argentina Preimplantation Genetic Diagnosis Market Value & Volume, 2021-2026 ($)
Figure 42 Argentina GDP and Population, 2018-2019 ($)
Figure 43 Argentina GDP – Composition of 2018, By Sector of Origin
Figure 44 Argentina Export and Import Value & Volume, 2018-2019 ($)
Figure 45 Ecuador Preimplantation Genetic Diagnosis Market Value & Volume, 2021-2026 ($)
Figure 46 Ecuador GDP and Population, 2018-2019 ($)
Figure 47 Ecuador GDP – Composition of 2018, By Sector of Origin
Figure 48 Ecuador Export and Import Value & Volume, 2018-2019 ($)
Figure 49 Peru Preimplantation Genetic Diagnosis Market Value & Volume, 2021-2026 ($)
Figure 50 Peru GDP and Population, 2018-2019 ($)
Figure 51 Peru GDP – Composition of 2018, By Sector of Origin
Figure 52 Peru Export and Import Value & Volume, 2018-2019 ($)
Figure 53 Colombia Preimplantation Genetic Diagnosis Market Value & Volume, 2021-2026 ($)
Figure 54 Colombia GDP and Population, 2018-2019 ($)
Figure 55 Colombia GDP – Composition of 2018, By Sector of Origin
Figure 56 Colombia Export and Import Value & Volume, 2018-2019 ($)
Figure 57 Costa Rica Preimplantation Genetic Diagnosis MarketCosta Rica 3D Printing Market Value & Volume, 2021-2026 ($)
Figure 58 Costa Rica GDP and Population, 2018-2019 ($)
Figure 59 Costa Rica GDP – Composition of 2018, By Sector of Origin
Figure 60 Costa Rica Export and Import Value & Volume, 2018-2019 ($)
Figure 61 Europe Preimplantation Genetic Diagnosis Market Value & Volume, 2021-2026 ($)
Figure 62 U.K Preimplantation Genetic Diagnosis Market Value & Volume, 2021-2026 ($)
Figure 63 U.K GDP and Population, 2018-2019 ($)
Figure 64 U.K GDP – Composition of 2018, By Sector of Origin
Figure 65 U.K Export and Import Value & Volume, 2018-2019 ($)
Figure 66 Germany Preimplantation Genetic Diagnosis Market Value & Volume, 2021-2026 ($)
Figure 67 Germany GDP and Population, 2018-2019 ($)
Figure 68 Germany GDP – Composition of 2018, By Sector of Origin
Figure 69 Germany Export and Import Value & Volume, 2018-2019 ($)
Figure 70 Italy Preimplantation Genetic Diagnosis Market Value & Volume, 2021-2026 ($)
Figure 71 Italy GDP and Population, 2018-2019 ($)
Figure 72 Italy GDP – Composition of 2018, By Sector of Origin
Figure 73 Italy Export and Import Value & Volume, 2018-2019 ($)
Figure 74 France Preimplantation Genetic Diagnosis Market Value & Volume, 2021-2026 ($)
Figure 75 France GDP and Population, 2018-2019 ($)
Figure 76 France GDP – Composition of 2018, By Sector of Origin
Figure 77 France Export and Import Value & Volume, 2018-2019 ($)
Figure 78 Netherlands Preimplantation Genetic Diagnosis Market Value & Volume, 2021-2026 ($)
Figure 79 Netherlands GDP and Population, 2018-2019 ($)
Figure 80 Netherlands GDP – Composition of 2018, By Sector of Origin
Figure 81 Netherlands Export and Import Value & Volume, 2018-2019 ($)
Figure 82 Belgium Preimplantation Genetic Diagnosis Market Value & Volume, 2021-2026 ($)
Figure 83 Belgium GDP and Population, 2018-2019 ($)
Figure 84 Belgium GDP – Composition of 2018, By Sector of Origin
Figure 85 Belgium Export and Import Value & Volume, 2018-2019 ($)
Figure 86 Spain Preimplantation Genetic Diagnosis Market Value & Volume, 2021-2026 ($)
Figure 87 Spain GDP and Population, 2018-2019 ($)
Figure 88 Spain GDP – Composition of 2018, By Sector of Origin
Figure 89 Spain Export and Import Value & Volume, 2018-2019 ($)
Figure 90 Denmark Preimplantation Genetic Diagnosis Market Value & Volume, 2021-2026 ($)
Figure 91 Denmark GDP and Population, 2018-2019 ($)
Figure 92 Denmark GDP – Composition of 2018, By Sector of Origin
Figure 93 Denmark Export and Import Value & Volume, 2018-2019 ($)
Figure 94 APAC Preimplantation Genetic Diagnosis Market Value & Volume, 2021-2026 ($)
Figure 95 China Preimplantation Genetic Diagnosis MarketValue & Volume, 2021-2026
Figure 96 China GDP and Population, 2018-2019 ($)
Figure 97 China GDP – Composition of 2018, By Sector of Origin
Figure 98 China Export and Import Value & Volume, 2018-2019 ($)Preimplantation Genetic Diagnosis MarketChina Export and Import Value & Volume, 2018-2019 ($)
Figure 99 Australia Preimplantation Genetic Diagnosis Market Value & Volume, 2021-2026 ($)
Figure 100 Australia GDP and Population, 2018-2019 ($)
Figure 101 Australia GDP – Composition of 2018, By Sector of Origin
Figure 102 Australia Export and Import Value & Volume, 2018-2019 ($)
Figure 103 South Korea Preimplantation Genetic Diagnosis Market Value & Volume, 2021-2026 ($)
Figure 104 South Korea GDP and Population, 2018-2019 ($)
Figure 105 South Korea GDP – Composition of 2018, By Sector of Origin
Figure 106 South Korea Export and Import Value & Volume, 2018-2019 ($)
Figure 107 India Preimplantation Genetic Diagnosis Market Value & Volume, 2021-2026 ($)
Figure 108 India GDP and Population, 2018-2019 ($)
Figure 109 India GDP – Composition of 2018, By Sector of Origin
Figure 110 India Export and Import Value & Volume, 2018-2019 ($)
Figure 111 Taiwan Preimplantation Genetic Diagnosis MarketTaiwan 3D Printing Market Value & Volume, 2021-2026 ($)
Figure 112 Taiwan GDP and Population, 2018-2019 ($)
Figure 113 Taiwan GDP – Composition of 2018, By Sector of Origin
Figure 114 Taiwan Export and Import Value & Volume, 2018-2019 ($)
Figure 115 Malaysia Preimplantation Genetic Diagnosis MarketMalaysia 3D Printing Market Value & Volume, 2021-2026 ($)
Figure 116 Malaysia GDP and Population, 2018-2019 ($)
Figure 117 Malaysia GDP – Composition of 2018, By Sector of Origin
Figure 118 Malaysia Export and Import Value & Volume, 2018-2019 ($)
Figure 119 Hong Kong Preimplantation Genetic Diagnosis MarketHong Kong 3D Printing Market Value & Volume, 2021-2026 ($)
Figure 120 Hong Kong GDP and Population, 2018-2019 ($)
Figure 121 Hong Kong GDP – Composition of 2018, By Sector of Origin
Figure 122 Hong Kong Export and Import Value & Volume, 2018-2019 ($)
Figure 123 Middle East & Africa Preimplantation Genetic Diagnosis MarketMiddle East & Africa 3D Printing Market Value & Volume, 2021-2026 ($)
Figure 124 Russia Preimplantation Genetic Diagnosis MarketRussia 3D Printing Market Value & Volume, 2021-2026 ($)
Figure 125 Russia GDP and Population, 2018-2019 ($)
Figure 126 Russia GDP – Composition of 2018, By Sector of Origin
Figure 127 Russia Export and Import Value & Volume, 2018-2019 ($)
Figure 128 Israel Preimplantation Genetic Diagnosis Market Value & Volume, 2021-2026 ($)
Figure 129 Israel GDP and Population, 2018-2019 ($)
Figure 130 Israel GDP – Composition of 2018, By Sector of Origin
Figure 131 Israel Export and Import Value & Volume, 2018-2019 ($)
Figure 132 Entropy Share, By Strategies, 2018-2019* (%)Preimplantation Genetic Diagnosis Market
Figure 133 Developments, 2018-2019*Preimplantation Genetic Diagnosis Market
Figure 134 Company 1 Preimplantation Genetic Diagnosis Market Net Revenue, By Years, 2018-2019* ($)
Figure 135 Company 1 Preimplantation Genetic Diagnosis Market Net Revenue Share, By Business segments, 2018 (%)
Figure 136 Company 1 Preimplantation Genetic Diagnosis Market Net Sales Share, By Geography, 2018 (%)
Figure 137 Company 2 Preimplantation Genetic Diagnosis Market Net Revenue, By Years, 2018-2019* ($)
Figure 138 Company 2 Preimplantation Genetic Diagnosis Market Net Revenue Share, By Business segments, 2018 (%)
Figure 139 Company 2 Preimplantation Genetic Diagnosis Market Net Sales Share, By Geography, 2018 (%)
Figure 140 Company 3Preimplantation Genetic Diagnosis Market Net Revenue, By Years, 2018-2019* ($)
Figure 141 Company 3Preimplantation Genetic Diagnosis Market Net Revenue Share, By Business segments, 2018 (%)
Figure 142 Company 3Preimplantation Genetic Diagnosis Market Net Sales Share, By Geography, 2018 (%)
Figure 143 Company 4 Preimplantation Genetic Diagnosis Market Net Revenue, By Years, 2018-2019* ($)
Figure 144 Company 4 Preimplantation Genetic Diagnosis Market Net Revenue Share, By Business segments, 2018 (%)
Figure 145 Company 4 Preimplantation Genetic Diagnosis Market Net Sales Share, By Geography, 2018 (%)
Figure 146 Company 5 Preimplantation Genetic Diagnosis Market Net Revenue, By Years, 2018-2019* ($)
Figure 147 Company 5 Preimplantation Genetic Diagnosis Market Net Revenue Share, By Business segments, 2018 (%)
Figure 148 Company 5 Preimplantation Genetic Diagnosis Market Net Sales Share, By Geography, 2018 (%)
Figure 149 Company 6 Preimplantation Genetic Diagnosis Market Net Revenue, By Years, 2018-2019* ($)
Figure 150 Company 6 Preimplantation Genetic Diagnosis Market Net Revenue Share, By Business segments, 2018 (%)
Figure 151 Company 6 Preimplantation Genetic Diagnosis Market Net Sales Share, By Geography, 2018 (%)
Figure 152 Company 7 Preimplantation Genetic Diagnosis Market Net Revenue, By Years, 2018-2019* ($)
Figure 153 Company 7 Preimplantation Genetic Diagnosis Market Net Revenue Share, By Business segments, 2018 (%)
Figure 154 Company 7 Preimplantation Genetic Diagnosis Market Net Sales Share, By Geography, 2018 (%)
Figure 155 Company 8 Preimplantation Genetic Diagnosis Market Net Revenue, By Years, 2018-2019* ($)
Figure 156 Company 8 Preimplantation Genetic Diagnosis Market Net Revenue Share, By Business segments, 2018 (%)
Figure 157 Company 8 Preimplantation Genetic Diagnosis Market Net Sales Share, By Geography, 2018 (%)
Figure 158 Company 9 Preimplantation Genetic Diagnosis Market Net Revenue, By Years, 2018-2019* ($)
Figure 159 Company 9 Preimplantation Genetic Diagnosis Market Net Revenue Share, By Business segments, 2018 (%)
Figure 160 Company 9 Preimplantation Genetic Diagnosis Market Net Sales Share, By Geography, 2018 (%)
Figure 161 Company 10 Preimplantation Genetic Diagnosis Market Net Revenue, By Years, 2018-2019* ($)
Figure 162 Company 10 Preimplantation Genetic Diagnosis Market Net Revenue Share, By Business segments, 2018 (%)
Figure 163 Company 10 Preimplantation Genetic Diagnosis Market Net Sales Share, By Geography, 2018 (%)
Figure 164 Company 11 Preimplantation Genetic Diagnosis Market Net Revenue, By Years, 2018-2019* ($)
Figure 165 Company 11 Preimplantation Genetic Diagnosis Market Net Revenue Share, By Business segments, 2018 (%)
Figure 166 Company 11 Preimplantation Genetic Diagnosis Market Net Sales Share, By Geography, 2018 (%)
Figure 167 Company 12 Preimplantation Genetic Diagnosis Market Net Revenue, By Years, 2018-2019* ($)
Figure 168 Company 12 Preimplantation Genetic Diagnosis Market Net Revenue Share, By Business segments, 2018 (%)
Figure 169 Company 12 Preimplantation Genetic Diagnosis Market Net Sales Share, By Geography, 2018 (%)
Figure 170 Company 13Preimplantation Genetic Diagnosis Market Net Revenue, By Years, 2018-2019* ($)
Figure 171 Company 13Preimplantation Genetic Diagnosis Market Net Revenue Share, By Business segments, 2018 (%)
Figure 172 Company 13Preimplantation Genetic Diagnosis Market Net Sales Share, By Geography, 2018 (%)
Figure 173 Company 14 Preimplantation Genetic Diagnosis Market Net Revenue, By Years, 2018-2019* ($)
Figure 174 Company 14 Preimplantation Genetic Diagnosis Market Net Revenue Share, By Business segments, 2018 (%)
Figure 175 Company 14 Preimplantation Genetic Diagnosis Market Net Sales Share, By Geography, 2018 (%)
Figure 176 Company 15 Preimplantation Genetic Diagnosis Market Net Revenue, By Years, 2018-2019* ($)
Figure 177 Company 15 Preimplantation Genetic Diagnosis Market Net Revenue Share, By Business segments, 2018 (%)
Figure 178 Company 15 Preimplantation Genetic Diagnosis Market Net Sales Share, By Geography, 2018 (%)