 Email
Email Print
Print


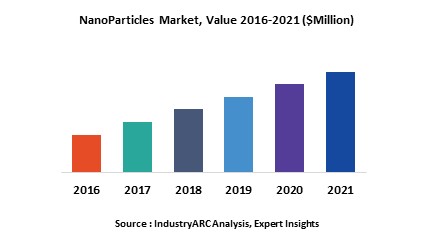
Gold nanoparticles have unique optical properties and hence are widely used in photonics and bio-imaging applications. Gold nanoparticles have varied sizes and can emit vibrant colors ranging from red to pale blue. The different sizes and shape of gold nanoparticles are responsible for different optical properties. Owing to several properties of these particles including easy preparation, low toxicity, and ability to attach to specific biological molecules for diagnosis or treatment, the gold nanoparticles market has observed considerable growth from past few years which is expected to continue in near future.
The report highlights major factors responsible for the growth of gold nanoparticles market. The market dynamics of gold nanoparticles includes the drivers, restraints and opportunities. The major factor driving the growth of this industry is the high demand from healthcare industry to improve the pharmacokinetics and reduce side effects. Moreover, the use of gold nanoparticles to treat cancer and tumors has increased its acceptance among the people. Currently, biocompatibility of these particles is the major issue imposing great challenge to the industry. There are several opportunities all over the globe in nanoparticle industry as it is in nascent stage and lots of investments in being made in research & development.
The report classifies the global gold nanoparticle market on the basis of – market by applications, and market by geography. The major applications include healthcare industry, pharmaceutical industry, cosmetics, electronics, and biomedical industry, among others. Among these applications, healthcare captures largest share in the market due to its increasing demand in developing & highly populated countries. Cosmetics and electronics industry are at emerging stage in gold nanoparticle industry and have less penetration rate. However, these industries are estimated to penetrate the gold nanoparticle at very high growth rate. The market is further classified based on geography. The major regions consider for this study includes North America, Europe, Asia-Pacific, and Rest of the World.
North America accounts for larger share and dominates the gold nanoparticle market. Countries from Asia-Pacific region such as China, South Korea, India, and Taiwan are estimated to have high growth rate in the market due to the growing healthcare and pharmaceutical industry in these countries.
The detailed insights on the key players’ competitiveness in the gold nanoparticle market is given high importance in the report. The report gives detailed insights on the key business strategies and developments adopted by the key players in the market.
The major manufacturers that are profiled in the report are:
- BBI Solutions
- Nanosphere
- Nanostellar Inc.
- Cytodiagnostics
- Sigma-Aldrich
1. NanoParticles Market - Overview
1.1. Definitions and Scope
2. NanoParticles Market - Executive summary
2.1. Market Revenue, Market Size and Key Trends by Company
2.2. Key Trends by type of Application
2.3. Key Trends segmented by Geography
3. NanoParticles Market
3.1. Comparative analysis
3.1.1. Product Benchmarking - Top 10 companies
3.1.2. Top 5 Financials Analysis
3.1.3. Market Value split by Top 10 companies
3.1.4. Patent Analysis - Top 10 companies
3.1.5. Pricing Analysis
4. NanoParticles Market – Startup companies Scenario Premium
4.1. Top 10 startup company Analysis by
4.1.1. Investment
4.1.2. Revenue
4.1.3. Market Shares
4.1.4. Market Size and Application Analysis
4.1.5. Venture Capital and Funding Scenario
5. NanoParticles Market – Industry Market Entry Scenario Premium
5.1. Regulatory Framework Overview
5.2. New Business and Ease of Doing business index
5.3. Case studies of successful ventures
5.4. Customer Analysis – Top 10 companies
6. NanoParticles Market Forces
6.1. Drivers
6.2. Constraints
6.3. Challenges
6.4. Porters five force model
6.4.1. Bargaining power of suppliers
6.4.2. Bargaining powers of customers
6.4.3. Threat of new entrants
6.4.4. Rivalry among existing players
6.4.5. Threat of substitutes
7. NanoParticles Market -Strategic analysis
7.1. Value chain analysis
7.2. Opportunities analysis
7.3. Product life cycle
7.4. Suppliers and distributors Market Share
8. NanoParticles Market – By Application (Market Size -$Million / $Billion)
8.1. Market Size and Market Share Analysis
8.2. Application Revenue and Trend Research
8.3. Product Segment Analysis
8.3.1. Healthcare industry
8.3.2. Pharmaceuticals
8.3.3. Cosmetics
8.3.4. Electronics
8.3.5. Biomedical industry
8.3.6. Others
9. NanoParticles - By Geography (Market Size -$Million / $Billion)
9.1. NanoParticles Market - North America Segment Research
9.2. North America Market Research (Million / $Billion)
9.2.1. Segment type Size and Market Size Analysis
9.2.2. Revenue and Trends
9.2.3. Application Revenue and Trends by type of Application
9.2.4. Company Revenue and Product Analysis
9.2.5. North America Product type and Application Market Size
9.2.5.1. U.S.
9.2.5.2. Canada
9.2.5.3. Mexico
9.2.5.4. Rest of North America
9.3. NanoParticles - South America Segment Research
9.4. South America Market Research (Market Size -$Million / $Billion)
9.4.1. Segment type Size and Market Size Analysis
9.4.2. Revenue and Trends
9.4.3. Application Revenue and Trends by type of Application
9.4.4. Company Revenue and Product Analysis
9.4.5. South America Product type and Application Market Size
9.4.5.1. Brazil
9.4.5.2. Venezuela
9.4.5.3. Argentina
9.4.5.4. Ecuador
9.4.5.5. Peru
9.4.5.6. Colombia
9.4.5.7. Costa Rica
9.4.5.8. Rest of South America
9.5. NanoParticles - Europe Segment Research
9.6. Europe Market Research (Market Size -$Million / $Billion)
9.6.1. Segment type Size and Market Size Analysis
9.6.2. Revenue and Trends
9.6.3. Application Revenue and Trends by type of Application
9.6.4. Company Revenue and Product Analysis
9.6.5. Europe Segment Product type and Application Market Size
9.6.5.1. U.K
9.6.5.2. Germany
9.6.5.3. Italy
9.6.5.4. France
9.6.5.5. Netherlands
9.6.5.6. Belgium
9.6.5.7. Spain
9.6.5.8. Denmark
9.6.5.9. Rest of Europe
9.7. NanoParticles – APAC Segment Research
9.8. APAC Market Research (Market Size -$Million / $Billion)
9.8.1. Segment type Size and Market Size Analysis
9.8.2. Revenue and Trends
9.8.3. Application Revenue and Trends by type of Application
9.8.4. Company Revenue and Product Analysis
9.8.5. APAC Segment – Product type and Application Market Size
9.8.5.1. China
9.8.5.2. Australia
9.8.5.3. Japan
9.8.5.4. South Korea
9.8.5.5. India
9.8.5.6. Taiwan
9.8.5.7. Malaysia
10. NanoParticles Market - Entropy
10.1. New product launches
10.2. M&A's, collaborations, JVs and partnerships
11. NanoParticles Market – Industry / Segment Competition landscape Premium
11.1. Market Share Analysis
11.1.1. Market Share by Country- Top companies
11.1.2. Market Share by Region- Top 10 companies
11.1.3. Market Share by type of Application – Top 10 companies
11.1.4. Market Share by type of Product / Product category- Top 10 companies
11.1.5. Market Share at global level- Top 10 companies
11.1.6. Best Practises for companies
12. NanoParticles Market – Key Company List by Country Premium
13. NanoParticles Market Company Analysis
13.1. Market Share, Company Revenue, Products, M&A, Developments
13.2. BBI Solutions
13.3. Nanosphere
13.4. Nanostellar Inc
13.5. Cytodiagnostics
13.6. Sigma-Aldrich
13.7. Metalor Technologies SA
13.8. Johnson Matthey
13.9. NanoHybrids
13.10. Solaris Nanosciences
13.11. Innova Biosciences
13.12. Company 11
13.13. Company 12
13.14. Company 13
13.15. Company 14 and more
"*Financials would be provided on a best efforts basis for private companies"
14. NanoParticles Market -Appendix
14.1. Abbreviations
14.2. Sources
15. NanoParticles Market -Methodology Premium
15.1. Research Methodology
15.1.1. Company Expert Interviews
15.1.2. Industry Databases
15.1.3. Associations
15.1.4. Company News
15.1.5. Company Annual Reports
15.1.6. Application Trends
15.1.7. New Products and Product database
15.1.8. Company Transcripts
15.1.9. R&D Trends
15.1.10. Key Opinion Leaders Interviews
15.1.11. Supply and Demand Trends
List of Tables:
Table 1: NanoParticles Market Overview 2021-2026
Table 2: NanoParticles Market Leader Analysis 2018-2019 (US$)
Table 3: NanoParticles Market Product Analysis 2018-2019 (US$)
Table 4: NanoParticles Market End User Analysis 2018-2019 (US$)
Table 5: NanoParticles Market Patent Analysis 2013-2018* (US$)
Table 6: NanoParticles Market Financial Analysis 2018-2019 (US$)
Table 7: NanoParticles Market Driver Analysis 2018-2019 (US$)
Table 8: NanoParticles Market Challenges Analysis 2018-2019 (US$)
Table 9: NanoParticles Market Constraint Analysis 2018-2019 (US$)
Table 10: NanoParticles Market Supplier Bargaining Power Analysis 2018-2019 (US$)
Table 11: NanoParticles Market Buyer Bargaining Power Analysis 2018-2019 (US$)
Table 12: NanoParticles Market Threat of Substitutes Analysis 2018-2019 (US$)
Table 13: NanoParticles Market Threat of New Entrants Analysis 2018-2019 (US$)
Table 14: NanoParticles Market Degree of Competition Analysis 2018-2019 (US$)
Table 15: NanoParticles Market Value Chain Analysis 2018-2019 (US$)
Table 16: NanoParticles Market Pricing Analysis 2021-2026 (US$)
Table 17: NanoParticles Market Opportunities Analysis 2021-2026 (US$)
Table 18: NanoParticles Market Product Life Cycle Analysis 2021-2026 (US$)
Table 19: NanoParticles Market Supplier Analysis 2018-2019 (US$)
Table 20: NanoParticles Market Distributor Analysis 2018-2019 (US$)
Table 21: NanoParticles Market Trend Analysis 2018-2019 (US$)
Table 22: NanoParticles Market Size 2018 (US$)
Table 23: NanoParticles Market Forecast Analysis 2021-2026 (US$)
Table 24: NanoParticles Market Sales Forecast Analysis 2021-2026 (Units)
Table 25: NanoParticles Market, Revenue & Volume, By Application, 2021-2026 ($)
Table 26: NanoParticles Market By Application, Revenue & Volume, By Healthcare industry, 2021-2026 ($)
Table 27: NanoParticles Market By Application, Revenue & Volume, By Pharmaceuticals, 2021-2026 ($)
Table 28: NanoParticles Market By Application, Revenue & Volume, By Cosmetics, 2021-2026 ($)
Table 29: NanoParticles Market By Application, Revenue & Volume, By Electronics, 2021-2026 ($)
Table 30: NanoParticles Market By Application, Revenue & Volume, By Biomedical industry, 2021-2026 ($)
Table 31: North America NanoParticles Market, Revenue & Volume, By Application, 2021-2026 ($)
Table 32: South america NanoParticles Market, Revenue & Volume, By Application, 2021-2026 ($)
Table 33: Europe NanoParticles Market, Revenue & Volume, By Application, 2021-2026 ($)
Table 34: APAC NanoParticles Market, Revenue & Volume, By Application, 2021-2026 ($)
Table 35: Middle East & Africa NanoParticles Market, Revenue & Volume, By Application, 2021-2026 ($)
Table 36: Russia NanoParticles Market, Revenue & Volume, By Application, 2021-2026 ($)
Table 37: Israel NanoParticles Market, Revenue & Volume, By Application, 2021-2026 ($)
Table 38: Top Companies 2018 (US$) NanoParticles Market, Revenue & Volume
Table 39: Product Launch 2018-2019 NanoParticles Market, Revenue & Volume
Table 40: Mergers & Acquistions 2018-2019 NanoParticles Market, Revenue & Volume
List of Figures :
Figure 1: Overview of NanoParticles Market 2021-2026
Figure 2: Market Share Analysis for NanoParticles Market 2018 (US$)
Figure 3: Product Comparison in NanoParticles Market 2018-2019 (US$)
Figure 4: End User Profile for NanoParticles Market 2018-2019 (US$)
Figure 5: Patent Application and Grant in NanoParticles Market 2013-2018* (US$)
Figure 6: Top 5 Companies Financial Analysis in NanoParticles Market 2018-2019 (US$)
Figure 7: Market Entry Strategy in NanoParticles Market 2018-2019
Figure 8: Ecosystem Analysis in NanoParticles Market 2018
Figure 9: Average Selling Price in NanoParticles Market 2021-2026
Figure 10: Top Opportunites in NanoParticles Market 2018-2019
Figure 11: Market Life Cycle Analysis in NanoParticles Market
Figure 12: GlobalBy ApplicationNanoParticles Market Revenue, 2021-2026 ($)
Figure 13: Global NanoParticles Market - By Geography
Figure 14: Global NanoParticles Market Value & Volume, By Geography, 2021-2026 ($)
Figure 15: Global NanoParticles Market CAGR, By Geography, 2021-2026 (%)
Figure 16: North America NanoParticles Market Value & Volume, 2021-2026 ($)
Figure 17: US NanoParticles Market Value & Volume, 2021-2026 ($)
Figure 18: US GDP and Population, 2018-2019 ($)
Figure 19: US GDP – Composition of 2018, By Sector of Origin
Figure 20: US Export and Import Value & Volume, 2018-2019 ($)
Figure 21: Canada NanoParticles Market Value & Volume, 2021-2026 ($)
Figure 22: Canada GDP and Population, 2018-2019 ($)
Figure 23: Canada GDP – Composition of 2018, By Sector of Origin
Figure 24: Canada Export and Import Value & Volume, 2018-2019 ($)
Figure 25: Mexico NanoParticles Market Value & Volume, 2021-2026 ($)
Figure 26: Mexico GDP and Population, 2018-2019 ($)
Figure 27: Mexico GDP – Composition of 2018, By Sector of Origin
Figure 28: Mexico Export and Import Value & Volume, 2018-2019 ($)
Figure 29: South America NanoParticles Market Value & Volume, 2021-2026 ($)
Figure 30: Brazil NanoParticles Market Value & Volume, 2021-2026 ($)
Figure 31: Brazil GDP and Population, 2018-2019 ($)
Figure 32: Brazil GDP – Composition of 2018, By Sector of Origin
Figure 33: Brazil Export and Import Value & Volume, 2018-2019 ($)
Figure 34: Venezuela NanoParticles Market Value & Volume, 2021-2026 ($)
Figure 35: Venezuela GDP and Population, 2018-2019 ($)
Figure 36: Venezuela GDP – Composition of 2018, By Sector of Origin
Figure 37: Venezuela Export and Import Value & Volume, 2018-2019 ($)
Figure 38: Argentina NanoParticles Market Value & Volume, 2021-2026 ($)
Figure 39: Argentina GDP and Population, 2018-2019 ($)
Figure 40: Argentina GDP – Composition of 2018, By Sector of Origin
Figure 41: Argentina Export and Import Value & Volume, 2018-2019 ($)
Figure 42: Ecuador NanoParticles Market Value & Volume, 2021-2026 ($)
Figure 43: Ecuador GDP and Population, 2018-2019 ($)
Figure 44: Ecuador GDP – Composition of 2018, By Sector of Origin
Figure 45: Ecuador Export and Import Value & Volume, 2018-2019 ($)
Figure 46: Peru NanoParticles Market Value & Volume, 2021-2026 ($)
Figure 47: Peru GDP and Population, 2018-2019 ($)
Figure 48: Peru GDP – Composition of 2018, By Sector of Origin
Figure 49: Peru Export and Import Value & Volume, 2018-2019 ($)
Figure 50: Colombia NanoParticles Market Value & Volume, 2021-2026 ($)
Figure 51: Colombia GDP and Population, 2018-2019 ($)
Figure 52: Colombia GDP – Composition of 2018, By Sector of Origin
Figure 53: Colombia Export and Import Value & Volume, 2018-2019 ($)
Figure 54: Costa Rica NanoParticles Market Value & Volume, 2021-2026 ($)
Figure 55: Costa Rica GDP and Population, 2018-2019 ($)
Figure 56: Costa Rica GDP – Composition of 2018, By Sector of Origin
Figure 57: Costa Rica Export and Import Value & Volume, 2018-2019 ($)
Figure 58: Europe NanoParticles Market Value & Volume, 2021-2026 ($)
Figure 59: U.K NanoParticles Market Value & Volume, 2021-2026 ($)
Figure 60: U.K GDP and Population, 2018-2019 ($)
Figure 61: U.K GDP – Composition of 2018, By Sector of Origin
Figure 62: U.K Export and Import Value & Volume, 2018-2019 ($)
Figure 63: Germany NanoParticles Market Value & Volume, 2021-2026 ($)
Figure 64: Germany GDP and Population, 2018-2019 ($)
Figure 65: Germany GDP – Composition of 2018, By Sector of Origin
Figure 66: Germany Export and Import Value & Volume, 2018-2019 ($)
Figure 67: Italy NanoParticles Market Value & Volume, 2021-2026 ($)
Figure 68: Italy GDP and Population, 2018-2019 ($)
Figure 69: Italy GDP – Composition of 2018, By Sector of Origin
Figure 70: Italy Export and Import Value & Volume, 2018-2019 ($)
Figure 71: France NanoParticles Market Value & Volume, 2021-2026 ($)
Figure 72: France GDP and Population, 2018-2019 ($)
Figure 73: France GDP – Composition of 2018, By Sector of Origin
Figure 74: France Export and Import Value & Volume, 2018-2019 ($)
Figure 75: Netherlands NanoParticles Market Value & Volume, 2021-2026 ($)
Figure 76: Netherlands GDP and Population, 2018-2019 ($)
Figure 77: Netherlands GDP – Composition of 2018, By Sector of Origin
Figure 78: Netherlands Export and Import Value & Volume, 2018-2019 ($)
Figure 79: Belgium NanoParticles Market Value & Volume, 2021-2026 ($)
Figure 80: Belgium GDP and Population, 2018-2019 ($)
Figure 81: Belgium GDP – Composition of 2018, By Sector of Origin
Figure 82: Belgium Export and Import Value & Volume, 2018-2019 ($)
Figure 83: Spain NanoParticles Market Value & Volume, 2021-2026 ($)
Figure 84: Spain GDP and Population, 2018-2019 ($)
Figure 85: Spain GDP – Composition of 2018, By Sector of Origin
Figure 86: Spain Export and Import Value & Volume, 2018-2019 ($)
Figure 87: Denmark NanoParticles Market Value & Volume, 2021-2026 ($)
Figure 88: Denmark GDP and Population, 2018-2019 ($)
Figure 89: Denmark GDP – Composition of 2018, By Sector of Origin
Figure 90: Denmark Export and Import Value & Volume, 2018-2019 ($)
Figure 91: APAC NanoParticles Market Value & Volume, 2021-2026 ($)
Figure 92: China NanoParticles Market Value & Volume, 2021-2026
Figure 93: China GDP and Population, 2018-2019 ($)
Figure 94: China GDP – Composition of 2018, By Sector of Origin
Figure 95: China Export and Import Value & Volume, 2018-2019 ($)NanoParticles Market China Export and Import Value & Volume, 2018-2019 ($)
Figure 96: Australia NanoParticles Market Value & Volume, 2021-2026 ($)
Figure 97: Australia GDP and Population, 2018-2019 ($)
Figure 98: Australia GDP – Composition of 2018, By Sector of Origin
Figure 99: Australia Export and Import Value & Volume, 2018-2019 ($)
Figure 100: South Korea NanoParticles Market Value & Volume, 2021-2026 ($)
Figure 101: South Korea GDP and Population, 2018-2019 ($)
Figure 102: South Korea GDP – Composition of 2018, By Sector of Origin
Figure 103: South Korea Export and Import Value & Volume, 2018-2019 ($)
Figure 104: India NanoParticles Market Value & Volume, 2021-2026 ($)
Figure 105: India GDP and Population, 2018-2019 ($)
Figure 106: India GDP – Composition of 2018, By Sector of Origin
Figure 107: India Export and Import Value & Volume, 2018-2019 ($)
Figure 108: Taiwan NanoParticles Market Value & Volume, 2021-2026 ($)
Figure 109: Taiwan GDP and Population, 2018-2019 ($)
Figure 110: Taiwan GDP – Composition of 2018, By Sector of Origin
Figure 111: Taiwan Export and Import Value & Volume, 2018-2019 ($)
Figure 112: Malaysia NanoParticles Market Value & Volume, 2021-2026 ($)
Figure 113: Malaysia GDP and Population, 2018-2019 ($)
Figure 114: Malaysia GDP – Composition of 2018, By Sector of Origin
Figure 115: Malaysia Export and Import Value & Volume, 2018-2019 ($)
Figure 116: Hong Kong NanoParticles Market Value & Volume, 2021-2026 ($)
Figure 117: Hong Kong GDP and Population, 2018-2019 ($)
Figure 118: Hong Kong GDP – Composition of 2018, By Sector of Origin
Figure 119: Hong Kong Export and Import Value & Volume, 2018-2019 ($)
Figure 120: Middle East & Africa NanoParticles Market Middle East & Africa 3D Printing Market Value & Volume, 2021-2026 ($)
Figure 121: Russia NanoParticles Market Value & Volume, 2021-2026 ($)
Figure 122: Russia GDP and Population, 2018-2019 ($)
Figure 123: Russia GDP – Composition of 2018, By Sector of Origin
Figure 124: Russia Export and Import Value & Volume, 2018-2019 ($)
Figure 125: Israel NanoParticles Market Value & Volume, 2021-2026 ($)
Figure 126: Israel GDP and Population, 2018-2019 ($)
Figure 127: Israel GDP – Composition of 2018, By Sector of Origin
Figure 128: Israel Export and Import Value & Volume, 2018-2019 ($)
Figure 129: Entropy Share, By Strategies, 2018-2019* (%)NanoParticles Market
Figure 130: Developments, 2018-2019*NanoParticles Market
Figure 131: Company 1 NanoParticles Market Net Revenue, By Years, 2018-2019* ($)
Figure 132: Company 1 NanoParticles Market Net Revenue Share, By Business segments, 2018 (%)
Figure 133: Company 1 NanoParticles Market Net Sales Share, By Geography, 2018 (%)
Figure 134: Company 2 NanoParticles Market Net Revenue, By Years, 2018-2019* ($)
Figure 135: Company 2 NanoParticles Market Net Revenue Share, By Business segments, 2018 (%)
Figure 136: Company 2 NanoParticles Market Net Sales Share, By Geography, 2018 (%)
Figure 137: Company 3 NanoParticles Market Net Revenue, By Years, 2018-2019* ($)
Figure 138: Company 3 NanoParticles Market Net Revenue Share, By Business segments, 2018 (%)
Figure 139: Company 3 NanoParticles Market Net Sales Share, By Geography, 2018 (%)
Figure 140: Company 4 NanoParticles Market Net Revenue, By Years, 2018-2019* ($)
Figure 141: Company 4 NanoParticles Market Net Revenue Share, By Business segments, 2018 (%)
Figure 142: Company 4 NanoParticles Market Net Sales Share, By Geography, 2018 (%)
Figure 143: Company 5 NanoParticles Market Net Revenue, By Years, 2018-2019* ($)
Figure 144: Company 5 NanoParticles Market Net Revenue Share, By Business segments, 2018 (%)
Figure 145: Company 5 NanoParticles Market Net Sales Share, By Geography, 2018 (%)
Figure 146: Company 6 NanoParticles Market Net Revenue, By Years, 2018-2019* ($)
Figure 147: Company 6 NanoParticles Market Net Revenue Share, By Business segments, 2018 (%)
Figure 148: Company 6 NanoParticles Market Net Sales Share, By Geography, 2018 (%)
Figure 149: Company 7 NanoParticles Market Net Revenue, By Years, 2018-2019* ($)
Figure 150: Company 7 NanoParticles Market Net Revenue Share, By Business segments, 2018 (%)
Figure 151: Company 7 NanoParticles Market Net Sales Share, By Geography, 2018 (%)
Figure 152: Company 8 NanoParticles Market Net Revenue, By Years, 2018-2019* ($)
Figure 153: Company 8 NanoParticles Market Net Revenue Share, By Business segments, 2018 (%)
Figure 154: Company 8 NanoParticles Market Net Sales Share, By Geography, 2018 (%)
Figure 155: Company 9 NanoParticles Market Net Revenue, By Years, 2018-2019* ($)
Figure 156: Company 9 NanoParticles Market Net Revenue Share, By Business segments, 2018 (%)
Figure 157: Company 9 NanoParticles Market Net Sales Share, By Geography, 2018 (%)
Figure 158: Company 10 NanoParticles Market Net Revenue, By Years, 2018-2019* ($)
Figure 159: Company 10 NanoParticles Market Net Revenue Share, By Business segments, 2018 (%)
Figure 160: Company 10 NanoParticles Market Net Sales Share, By Geography, 2018 (%)
Figure 161: Company 11 NanoParticles Market Net Revenue, By Years, 2018-2019* ($)
Figure 162: Company 11 NanoParticles Market Net Revenue Share, By Business segments, 2018 (%)
Figure 163: Company 11 NanoParticles Market Net Sales Share, By Geography, 2018 (%)
Figure 164: Company 12 NanoParticles Market Net Revenue, By Years, 2018-2019* ($)
Figure 165: Company 12 NanoParticles Market Net Revenue Share, By Business segments, 2018 (%)
Figure 166: Company 12 NanoParticles Market Net Sales Share, By Geography, 2018 (%)
Figure 167: Company 13 NanoParticles Market Net Revenue, By Years, 2018-2019* ($)
Figure 168: Company 13 NanoParticles Market Net Revenue Share, By Business segments, 2018 (%)
Figure 169: Company 13 NanoParticles Market Net Sales Share, By Geography, 2018 (%)
Figure 170: Company 14 NanoParticles Market Net Revenue, By Years, 2018-2019* ($)
Figure 171: Company 14 NanoParticles Market Net Revenue Share, By Business segments, 2018 (%)
Figure 172: Company 14 NanoParticles Market Net Sales Share, By Geography, 2018 (%)
Figure 173: Company 15 NanoParticles Market Net Revenue, By Years, 2018-2019* ($)
Figure 174: Company 15 NanoParticles Market Net Revenue Share, By Business segments, 2018 (%)
Figure 175: Company 15 NanoParticles Market Net Sales Share, By Geography, 2018 (%)