 Email
Email Print
Print


Idiopathic Short Stature Market - Forecast(2024 - 2030)
Idiopathic Short Stature is a condition which leads to an impaired growth. Health care organizations define this condition as, height deviated by more than 2 standard deviations below the average height of a given sex, age and population. More than 80% of the children diagnosed with short stature are categorized as Idiopathic Short Stature. In general, there is no identifiable disorder of growth hormone (GH)/ insulin-like growth factor (IGF) and no other endocrine disorder, but in the rare case, it might be.
Idiopathic Short Stature is categorized into Familial Short Stature (FSS) - when the child remains in the range of target height but have short stature compared to reference population and Non-Familial Short Stature (NFSS) - a child is short statured when compared with both reference population and the target height.
Factors driving global demand for Idiopathic Short Stature are increasing awareness amongst people and increasing number of growth hormone options available in the market.
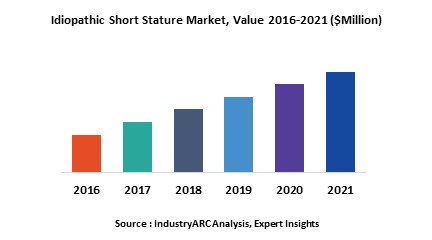
This report provides information on Idiopathic Short Stature market size for the year 2014-2016, and forecast of the same for year 2021. It also focuses on market drivers, challenges, restraints, market dynamics, growth indicators, competitive landscape, potential growth opportunities and other key aspects with respect to Idiopathic Short Stature treatment market.
United States and Europe remain the potential markets for Idiopathic Short Stature accounting for more than four million children. Availability of insurance aid in developed markets increases the penetration of the biologics/biosimilar drugs used in the treatment of Idiopathic Short Stature. The market is dominated by few major players, which indeed has become a major challenge for the new entrants.
This report identifies global Idiopathic Short Stature market on the basis of treatment type and regional market as follows:
- Idiopathic Short Stature treatment market is segmented based on available treatment options. Although various treatment options are in the market majority of these are not approved for growth acceleration and hence they are considered under off label use. Recombinant growth hormone therapy, Insulin like Growth Factor -1 (IGF-1) therapy, Aromatase inhibitors and low-dose androgen therapy (with injectable testosterone and low dose androgen) are the available treatment options.
- This report is further segmented based on potential markets for Idiopathic Short Stature. A detailed analysis by region – North America, Europe, Asia Pacific (APAC) and Rest of the World (RoW), has been provided in this report.
This report looks into all the major companies operating in the Idiopathic Short Stature treatment. Some of the major companies’ profiles are as follows:
- Eli Lilly
- Genentech/Roche
- Novo Nordisk
- Merck KGaA
- Pfizer
1. Idiopathic Short Stature Market - Overview
1.1. Definitions and Scope
2. Idiopathic Short Stature Market - Executive summary
2.1. Market Revenue, Market Size and Key Trends by Company
2.2. Key Trends by type of Application
2.3. Key Trends segmented by Geography
3. Idiopathic Short Stature Market
3.1. Comparative analysis
3.1.1. Product Benchmarking - Top 10 companies
3.1.2. Top 5 Financials Analysis
3.1.3. Market Value split by Top 10 companies
3.1.4. Patent Analysis - Top 10 companies
3.1.5. Pricing Analysis
4. Idiopathic Short Stature Market – Startup companies Scenario Premium
4.1. Top 10 startup company Analysis by
4.1.1. Investment
4.1.2. Revenue
4.1.3. Market Shares
4.1.4. Market Size and Application Analysis
4.1.5. Venture Capital and Funding Scenario
5. Idiopathic Short Stature Market – Industry Market Entry Scenario Premium
5.1. Regulatory Framework Overview
5.2. New Business and Ease of Doing business index
5.3. Case studies of successful ventures
5.4. Customer Analysis – Top 10 companies
6. Idiopathic Short Stature Market Forces
6.1. Drivers
6.2. Constraints
6.3. Challenges
6.4. Porters five force model
6.4.1. Bargaining power of suppliers
6.4.2. Bargaining powers of customers
6.4.3. Threat of new entrants
6.4.4. Rivalry among existing players
6.4.5. Threat of substitutes
7. Idiopathic Short Stature Market -Strategic analysis
7.1. Value chain analysis
7.2. Opportunities analysis
7.3. Product life cycle
7.4. Suppliers and distributors Market Share
8. Idiopathic Short Stature Market – By Treatment Type (Market Size -$Million / $Billion)
8.1. Market Size and Market Share Analysis
8.2. Application Revenue and Trend Research
8.3. Product Segment Analysis
8.3.1. Growth Hormone Replacement Therapy
8.3.2. Insulin like Growth Factor -1 (IGF-1) Therapy
8.3.3. Aromatase inhibitors and low-dose androgen therapy
9. Idiopathic Short Stature - By Geography (Market Size -$Million / $Billion)
9.1. Idiopathic Short Stature Market - North America Segment Research
9.2. North America Market Research (Million / $Billion)
9.2.1. Segment type Size and Market Size Analysis
9.2.2. Revenue and Trends
9.2.3. Application Revenue and Trends by type of Application
9.2.4. Company Revenue and Product Analysis
9.2.5. North America Product type and Application Market Size
9.2.5.1. U.S.
9.2.5.2. Canada
9.2.5.3. Mexico
9.2.5.4. Rest of North America
9.3. Idiopathic Short Stature - South America Segment Research
9.4. South America Market Research (Market Size -$Million / $Billion)
9.4.1. Segment type Size and Market Size Analysis
9.4.2. Revenue and Trends
9.4.3. Application Revenue and Trends by type of Application
9.4.4. Company Revenue and Product Analysis
9.4.5. South America Product type and Application Market Size
9.4.5.1. Brazil
9.4.5.2. Venezuela
9.4.5.3. Argentina
9.4.5.4. Ecuador
9.4.5.5. Peru
9.4.5.6. Colombia
9.4.5.7. Costa Rica
9.4.5.8. Rest of South America
9.5. Idiopathic Short Stature - Europe Segment Research
9.6. Europe Market Research (Market Size -$Million / $Billion)
9.6.1. Segment type Size and Market Size Analysis
9.6.2. Revenue and Trends
9.6.3. Application Revenue and Trends by type of Application
9.6.4. Company Revenue and Product Analysis
9.6.5. Europe Segment Product type and Application Market Size
9.6.5.1. U.K
9.6.5.2. Germany
9.6.5.3. Italy Idiopathic Short Stature Market
9.6.5.4. France
9.6.5.5. Netherlands
9.6.5.6. Belgium
9.6.5.7. Spain
9.6.5.8. Denmark
9.6.5.9. Rest of Europe
9.7. Idiopathic Short Stature – APAC Segment Research
9.8. APAC Market Research (Market Size -$Million / $Billion)
9.8.1. Segment type Size and Market Size Analysis
9.8.2. Revenue and Trends
9.8.3. Application Revenue and Trends by type of Application
9.8.4. Company Revenue and Product Analysis
9.8.5. APAC Segment – Product type and Application Market Size
9.8.5.1. China
9.8.5.2. Australia
9.8.5.3. Japan
9.8.5.4. South Korea
9.8.5.5. India
9.8.5.6. Taiwan
9.8.5.7. Malaysia
10. Idiopathic Short Stature Market - Entropy
10.1. New product launches
10.2. M&A's, collaborations, JVs and partnerships
11. Idiopathic Short Stature Market – Industry / Segment Competition landscape Premium
11.1. Market Share Analysis
11.1.1. Market Share by Country- Top companies
11.1.2. Market Share by Region- Top 10 companies
11.1.3. Market Share by type of Application – Top 10 companies
11.1.4. Market Share by type of Product / Product category- Top 10 companies
11.1.5. Market Share at global level- Top 10 companies
11.1.6. Best Practises for companies
12. Idiopathic Short Stature Market – Key Company List by Country Premium
13. Idiopathic Short Stature Market Company Analysis
13.1. Market Share, Company Revenue, Products, M&A, Developments
13.2. Eli Lilly
13.3. Genentech/Roche
13.4. Novo Nordisk
13.5. Merck KGaA
13.6. Pfizer
13.7. Sandoz/Novartis
13.8. JCR Pharmaceuticals
13.9. Ferring Pharmaceuticals
13.10. Ispen
13.11. Company 10
13.12. Company 11
13.11. Company 12 and more
"*Financials would be provided on a best efforts basis for private companies"
14. Idiopathic Short Stature Market - Appendix
14.1. Abbreviations
14.2. Sources
15. Idiopathic Short Stature Market - Methodology
15.1. Research Methodology
15.1.1. Company Expert Interviews
15.1.2. Industry Databases
15.1.3. Associations
15.1.4. Company News
15.1.5. Company Annual Reports
15.1.6. Application Trends
15.1.7. New Products and Product database
15.1.8. Company Transcripts
15.1.9. R&D Trends
15.1.10. Key Opinion Leaders Interviews
15.1.11. Supply and Demand Trends
List of Tables:
Table 1: Idiopathic Short Stature Market Overview 2021-2026
Table 2: Idiopathic Short Stature Market Leader Analysis 2018-2019 (US$)
Table 3: Idiopathic Short Stature Market Product Analysis 2018-2019 (US$)
Table 4: Idiopathic Short Stature Market End User Analysis 2018-2019 (US$)
Table 5: Idiopathic Short Stature Market Patent Analysis 2013-2018* (US$)
Table 6: Idiopathic Short Stature Market Financial Analysis 2018-2019 (US$)
Table 7: Idiopathic Short Stature Market Driver Analysis 2018-2019 (US$)
Table 8: Idiopathic Short Stature Market Challenges Analysis 2018-2019 (US$)
Table 9: Idiopathic Short Stature Market Constraint Analysis 2018-2019 (US$)
Table 10: Idiopathic Short Stature Market Supplier Bargaining Power Analysis 2018-2019 (US$)
Table 11: Idiopathic Short Stature Market Buyer Bargaining Power Analysis 2018-2019 (US$)
Table 12: Idiopathic Short Stature Market Threat of Substitutes Analysis 2018-2019 (US$)
Table 13: Idiopathic Short Stature Market Threat of New Entrants Analysis 2018-2019 (US$)
Table 14: Idiopathic Short Stature Market Degree of Competition Analysis 2018-2019 (US$)
Table 15: Idiopathic Short Stature Market Value Chain Analysis 2018-2019 (US$)
Table 16: Idiopathic Short Stature Market Pricing Analysis 2021-2026 (US$)
Table 17: Idiopathic Short Stature Market Opportunities Analysis 2021-2026 (US$)
Table 18: Idiopathic Short Stature Market Product Life Cycle Analysis 2021-2026 (US$)
Table 19: Idiopathic Short Stature Market Supplier Analysis 2018-2019 (US$)
Table 20: Idiopathic Short Stature Market Distributor Analysis 2018-2019 (US$)
Table 21: Idiopathic Short Stature Market Trend Analysis 2018-2019 (US$)
Table 22: Idiopathic Short Stature Market Size 2018 (US$)
Table 23: Idiopathic Short Stature Market Forecast Analysis 2021-2026 (US$)
Table 24: Idiopathic Short Stature Market Sales Forecast Analysis 2021-2026 (Units)
Table 25: Idiopathic Short Stature Market, Revenue & Volume, By Treatment Type, 2021-2026 ($)
Table 26: Idiopathic Short Stature Market By Treatment Type, Revenue & Volume, By Growth Hormone Replacement Therapy, 2021-2026 ($)
Table 27: Idiopathic Short Stature Market By Treatment Type, Revenue & Volume, By Insulin like Growth Factor -1 (IGF-1) Therapy, 2021-2026 ($)
Table 28: Idiopathic Short Stature Market By Treatment Type, Revenue & Volume, By Aromatase inhibitors and low-dose androgen therapy, 2021-2026 ($)
Table 29: North America Idiopathic Short Stature Market, Revenue & Volume, By Treatment Type, 2021-2026 ($)
Table 30: South america Idiopathic Short Stature Market, Revenue & Volume, By Treatment Type, 2021-2026 ($)
Table 31: Europe Idiopathic Short Stature Market, Revenue & Volume, By Treatment Type, 2021-2026 ($)
Table 32: APAC Idiopathic Short Stature Market, Revenue & Volume, By Treatment Type, 2021-2026 ($)
Table 33: Middle East & Africa Idiopathic Short Stature Market, Revenue & Volume, By Treatment Type, 2021-2026 ($)
Table 34: Russia Idiopathic Short Stature Market, Revenue & Volume, By Treatment Type, 2021-2026 ($)
Table 35: Israel Idiopathic Short Stature Market, Revenue & Volume, By Treatment Type, 2021-2026 ($)
Table 36: Top Companies 2018 (US$)Idiopathic Short Stature Market, Revenue & Volume
Table 37: Product Launch 2018-2019Idiopathic Short Stature Market, Revenue & Volume
Table 38: Mergers & Acquistions 2018-2019Idiopathic Short Stature Market, Revenue & Volume
List of Figures:
Figure 1: Overview of Idiopathic Short Stature Market 2021-2026
Figure 2: Market Share Analysis for Idiopathic Short Stature Market 2018 (US$)
Figure 3: Product Comparison in Idiopathic Short Stature Market 2018-2019 (US$)
Figure 4: End User Profile for Idiopathic Short Stature Market 2018-2019 (US$)
Figure 5: Patent Application and Grant in Idiopathic Short Stature Market 2013-2018* (US$)
Figure 6: Top 5 Companies Financial Analysis in Idiopathic Short Stature Market 2018-2019 (US$)
Figure 7: Market Entry Strategy in Idiopathic Short Stature Market 2018-2019
Figure 8: Ecosystem Analysis in Idiopathic Short Stature Market 2018
Figure 9: Average Selling Price in Idiopathic Short Stature Market 2021-2026
Figure 10: Top Opportunites in Idiopathic Short Stature Market 2018-2019
Figure 11: Market Life Cycle Analysis in Idiopathic Short Stature Market
Figure 12: GlobalBy Treatment TypeIdiopathic Short Stature Market Revenue, 2021-2026 ($)
Figure 13: Global Idiopathic Short Stature Market - By Geography
Figure 14: Global Idiopathic Short Stature Market Value & Volume, By Geography, 2021-2026 ($)
Figure 15: Global Idiopathic Short Stature Market CAGR, By Geography, 2021-2026 (%)
Figure 16: North America Idiopathic Short Stature Market Value & Volume, 2021-2026 ($)
Figure 17: US Idiopathic Short Stature Market Value & Volume, 2021-2026 ($)
Figure 18: US GDP and Population, 2018-2019 ($)
Figure 19: US GDP – Composition of 2018, By Sector of Origin
Figure 20: US Export and Import Value & Volume, 2018-2019 ($)
Figure 21: Canada Idiopathic Short Stature Market Value & Volume, 2021-2026 ($)
Figure 22: Canada GDP and Population, 2018-2019 ($)
Figure 23: Canada GDP – Composition of 2018, By Sector of Origin
Figure 24: Canada Export and Import Value & Volume, 2018-2019 ($)
Figure 25: Mexico Idiopathic Short Stature Market Value & Volume, 2021-2026 ($)
Figure 26: Mexico GDP and Population, 2018-2019 ($)
Figure 27: Mexico GDP – Composition of 2018, By Sector of Origin
Figure 28: Mexico Export and Import Value & Volume, 2018-2019 ($)
Figure 29: South America Idiopathic Short Stature Market Value & Volume, 2021-2026 ($)
Figure 30: Brazil Idiopathic Short Stature Market Value & Volume, 2021-2026 ($)
Figure 31: Brazil GDP and Population, 2018-2019 ($)
Figure 32: Brazil GDP – Composition of 2018, By Sector of Origin
Figure 33: Brazil Export and Import Value & Volume, 2018-2019 ($)
Figure 34: Venezuela Idiopathic Short Stature Market Value & Volume, 2021-2026 ($)
Figure 35: Venezuela GDP and Population, 2018-2019 ($)
Figure 36: Venezuela GDP – Composition of 2018, By Sector of Origin
Figure 37: Venezuela Export and Import Value & Volume, 2018-2019 ($)
Figure 38: Argentina Idiopathic Short Stature Market Value & Volume, 2021-2026 ($)
Figure 39: Argentina GDP and Population, 2018-2019 ($)
Figure 40: Argentina GDP – Composition of 2018, By Sector of Origin
Figure 41: Argentina Export and Import Value & Volume, 2018-2019 ($)
Figure 42: Ecuador Idiopathic Short Stature Market Value & Volume, 2021-2026 ($)
Figure 43: Ecuador GDP and Population, 2018-2019 ($)
Figure 44: Ecuador GDP – Composition of 2018, By Sector of Origin
Figure 45: Ecuador Export and Import Value & Volume, 2018-2019 ($)
Figure 46: Peru Idiopathic Short Stature Market Value & Volume, 2021-2026 ($)
Figure 47: Peru GDP and Population, 2018-2019 ($)
Figure 48: Peru GDP – Composition of 2018, By Sector of Origin
Figure 49: Peru Export and Import Value & Volume, 2018-2019 ($)
Figure 50: Colombia Idiopathic Short Stature Market Value & Volume, 2021-2026 ($)
Figure 51: Colombia GDP and Population, 2018-2019 ($)
Figure 52: Colombia GDP – Composition of 2018, By Sector of Origin
Figure 53: Colombia Export and Import Value & Volume, 2018-2019 ($)
Figure 54: Costa Rica Idiopathic Short Stature Market Value & Volume, 2021-2026 ($)
Figure 55: Costa Rica GDP and Population, 2018-2019 ($)
Figure 56: Costa Rica GDP – Composition of 2018, By Sector of Origin
Figure 57: Costa Rica Export and Import Value & Volume, 2018-2019 ($)
Figure 58: Europe Idiopathic Short Stature Market Value & Volume, 2021-2026 ($)
Figure 59: U.K Idiopathic Short Stature Market Value & Volume, 2021-2026 ($)
Figure 60: U.K GDP and Population, 2018-2019 ($)
Figure 61: U.K GDP – Composition of 2018, By Sector of Origin
Figure 62: U.K Export and Import Value & Volume, 2018-2019 ($)
Figure 63: Germany Idiopathic Short Stature Market Value & Volume, 2021-2026 ($)
Figure 64: Germany GDP and Population, 2018-2019 ($)
Figure 65: Germany GDP – Composition of 2018, By Sector of Origin
Figure 66: Germany Export and Import Value & Volume, 2018-2019 ($)
Figure 67: Italy Idiopathic Short Stature Market Value & Volume, 2021-2026 ($)
Figure 68: Italy GDP and Population, 2018-2019 ($)
Figure 69: Italy GDP – Composition of 2018, By Sector of Origin
Figure 70: Italy Export and Import Value & Volume, 2018-2019 ($)
Figure 71: France Idiopathic Short Stature Market Value & Volume, 2021-2026 ($)
Figure 72: France GDP and Population, 2018-2019 ($)
Figure 73: France GDP – Composition of 2018, By Sector of Origin
Figure 74: France Export and Import Value & Volume, 2018-2019 ($)
Figure 75: Netherlands Idiopathic Short Stature Market Value & Volume, 2021-2026 ($)
Figure 76: Netherlands GDP and Population, 2018-2019 ($)
Figure 77: Netherlands GDP – Composition of 2018, By Sector of Origin
Figure 78: Netherlands Export and Import Value & Volume, 2018-2019 ($)
Figure 79: Belgium Idiopathic Short Stature Market Value & Volume, 2021-2026 ($)
Figure 80: Belgium GDP and Population, 2018-2019 ($)
Figure 81: Belgium GDP – Composition of 2018, By Sector of Origin
Figure 82: Belgium Export and Import Value & Volume, 2018-2019 ($)
Figure 83: Spain Idiopathic Short Stature Market Value & Volume, 2021-2026 ($)
Figure 84: Spain GDP and Population, 2018-2019 ($)
Figure 85: Spain GDP – Composition of 2018, By Sector of Origin
Figure 86: Spain Export and Import Value & Volume, 2018-2019 ($)
Figure 87: Denmark Idiopathic Short Stature Market Value & Volume, 2021-2026 ($)
Figure 88: Denmark GDP and Population, 2018-2019 ($)
Figure 89: Denmark GDP – Composition of 2018, By Sector of Origin
Figure 90: Denmark Export and Import Value & Volume, 2018-2019 ($)
Figure 91: APAC Idiopathic Short Stature Market Value & Volume, 2021-2026 ($)
Figure 92: China Idiopathic Short Stature Market Value & Volume, 2021-2026
Figure 93: China GDP and Population, 2018-2019 ($)
Figure 94: China GDP – Composition of 2018, By Sector of Origin
Figure 95: China Export and Import Value & Volume, 2018-2019 ($)Idiopathic Short Stature Market China Export and Import Value & Volume, 2018-2019 ($)
Figure 96: Australia Idiopathic Short Stature Market Value & Volume, 2021-2026 ($)
Figure 97: Australia GDP and Population, 2018-2019 ($)
Figure 98: Australia GDP – Composition of 2018, By Sector of Origin
Figure 99: Australia Export and Import Value & Volume, 2018-2019 ($)
Figure 100: South Korea Idiopathic Short Stature Market Value & Volume, 2021-2026 ($)
Figure 101: South Korea GDP and Population, 2018-2019 ($)
Figure 102: South Korea GDP – Composition of 2018, By Sector of Origin
Figure 103: South Korea Export and Import Value & Volume, 2018-2019 ($)
Figure 104: India Idiopathic Short Stature Market Value & Volume, 2021-2026 ($)
Figure 105: India GDP and Population, 2018-2019 ($)
Figure 106: India GDP – Composition of 2018, By Sector of Origin
Figure 107: India Export and Import Value & Volume, 2018-2019 ($)
Figure 108: Taiwan Idiopathic Short Stature Market Value & Volume, 2021-2026 ($)
Figure 109: Taiwan GDP and Population, 2018-2019 ($)
Figure 110: Taiwan GDP – Composition of 2018, By Sector of Origin
Figure 111: Taiwan Export and Import Value & Volume, 2018-2019 ($)
Figure 112: Malaysia Idiopathic Short Stature Market Value & Volume, 2021-2026 ($)
Figure 113: Malaysia GDP and Population, 2018-2019 ($)
Figure 114: Malaysia GDP – Composition of 2018, By Sector of Origin
Figure 115: Malaysia Export and Import Value & Volume, 2018-2019 ($)
Figure 116: Hong Kong Idiopathic Short Stature Market Value & Volume, 2021-2026 ($)
Figure 117: Hong Kong GDP and Population, 2018-2019 ($)
Figure 118: Hong Kong GDP – Composition of 2018, By Sector of Origin
Figure 119: Hong Kong Export and Import Value & Volume, 2018-2019 ($)
Figure 120: Middle East & Africa Idiopathic Short Stature Market Middle East & Africa 3D Printing Market Value & Volume, 2021-2026 ($)
Figure 121: Russia Idiopathic Short Stature Market Value & Volume, 2021-2026 ($)
Figure 122: Russia GDP and Population, 2018-2019 ($)
Figure 123: Russia GDP – Composition of 2018, By Sector of Origin
Figure 124: Russia Export and Import Value & Volume, 2018-2019 ($)
Figure 125: Israel Idiopathic Short Stature Market Value & Volume, 2021-2026 ($)
Figure 126: Israel GDP and Population, 2018-2019 ($)
Figure 127: Israel GDP – Composition of 2018, By Sector of Origin
Figure 128: Israel Export and Import Value & Volume, 2018-2019 ($)
Figure 129: Entropy Share, By Strategies, 2018-2019* (%)Idiopathic Short Stature Market
Figure 130: Developments, 2018-2019*Idiopathic Short Stature Market
Figure 131: Company 1 Idiopathic Short Stature Market Net Revenue, By Years, 2018-2019* ($)
Figure 132: Company 1 Idiopathic Short Stature Market Net Revenue Share, By Business segments, 2018 (%)
Figure 133: Company 1 Idiopathic Short Stature Market Net Sales Share, By Geography, 2018 (%)
Figure 134: Company 2 Idiopathic Short Stature Market Net Revenue, By Years, 2018-2019* ($)
Figure 135: Company 2 Idiopathic Short Stature Market Net Revenue Share, By Business segments, 2018 (%)
Figure 136: Company 2 Idiopathic Short Stature Market Net Sales Share, By Geography, 2018 (%)
Figure 137: Company 3 Idiopathic Short Stature Market Net Revenue, By Years, 2018-2019* ($)
Figure 138: Company 3 Idiopathic Short Stature Market Net Revenue Share, By Business segments, 2018 (%)
Figure 139: Company 3 Idiopathic Short Stature Market Net Sales Share, By Geography, 2018 (%)
Figure 140: Company 4 Idiopathic Short Stature Market Net Revenue, By Years, 2018-2019* ($)
Figure 141: Company 4 Idiopathic Short Stature Market Net Revenue Share, By Business segments, 2018 (%)
Figure 142: Company 4 Idiopathic Short Stature Market Net Sales Share, By Geography, 2018 (%)
Figure 143: Company 5 Idiopathic Short Stature Market Net Revenue, By Years, 2018-2019* ($)
Figure 144: Company 5 Idiopathic Short Stature Market Net Revenue Share, By Business segments, 2018 (%)
Figure 145: Company 5 Idiopathic Short Stature Market Net Sales Share, By Geography, 2018 (%)
Figure 146: Company 6 Idiopathic Short Stature Market Net Revenue, By Years, 2018-2019* ($)
Figure 147: Company 6 Idiopathic Short Stature Market Net Revenue Share, By Business segments, 2018 (%)
Figure 148: Company 6 Idiopathic Short Stature Market Net Sales Share, By Geography, 2018 (%)
Figure 149: Company 7 Idiopathic Short Stature Market Net Revenue, By Years, 2018-2019* ($)
Figure 150: Company 7 Idiopathic Short Stature Market Net Revenue Share, By Business segments, 2018 (%)
Figure 151: Company 7 Idiopathic Short Stature Market Net Sales Share, By Geography, 2018 (%)
Figure 152: Company 8 Idiopathic Short Stature Market Net Revenue, By Years, 2018-2019* ($)
Figure 153: Company 8 Idiopathic Short Stature Market Net Revenue Share, By Business segments, 2018 (%)
Figure 154: Company 8 Idiopathic Short Stature Market Net Sales Share, By Geography, 2018 (%)
Figure 155: Company 9 Idiopathic Short Stature Market Net Revenue, By Years, 2018-2019* ($)
Figure 156: Company 9 Idiopathic Short Stature Market Net Revenue Share, By Business segments, 2018 (%)
Figure 157: Company 9 Idiopathic Short Stature Market Net Sales Share, By Geography, 2018 (%)
Figure 158: Company 10 Idiopathic Short Stature Market Net Revenue, By Years, 2018-2019* ($)
Figure 159: Company 10 Idiopathic Short Stature Market Net Revenue Share, By Business segments, 2018 (%)
Figure 160: Company 10 Idiopathic Short Stature Market Net Sales Share, By Geography, 2018 (%)
Figure 161: Company 11 Idiopathic Short Stature Market Net Revenue, By Years, 2018-2019* ($)
Figure 162: Company 11 Idiopathic Short Stature Market Net Revenue Share, By Business segments, 2018 (%)
Figure 163: Company 11 Idiopathic Short Stature Market Net Sales Share, By Geography, 2018 (%)
Figure 164: Company 12 Idiopathic Short Stature Market Net Revenue, By Years, 2018-2019* ($)
Figure 165: Company 12 Idiopathic Short Stature Market Net Revenue Share, By Business segments, 2018 (%)
Figure 166: Company 12 Idiopathic Short Stature Market Net Sales Share, By Geography, 2018 (%)
Figure 167: Company 13 Idiopathic Short Stature Market Net Revenue, By Years, 2018-2019* ($)
Figure 168: Company 13 Idiopathic Short Stature Market Net Revenue Share, By Business segments, 2018 (%)
Figure 169: Company 13 Idiopathic Short Stature Market Net Sales Share, By Geography, 2018 (%)
Figure 170: Company 14 Idiopathic Short Stature Market Net Revenue, By Years, 2018-2019* ($)
Figure 171: Company 14 Idiopathic Short Stature Market Net Revenue Share, By Business segments, 2018 (%)
Figure 172: Company 14 Idiopathic Short Stature Market Net Sales Share, By Geography, 2018 (%)
Figure 173: Company 15 Idiopathic Short Stature Market Net Revenue, By Years, 2018-2019* ($)
Figure 174: Company 15 Idiopathic Short Stature Market Net Revenue Share, By Business segments, 2018 (%)
Figure 175: Company 15 Idiopathic Short Stature Market Net Sales Share, By Geography, 2018 (%)