 Email
Email Print
Print


Dimethoate Market Overview
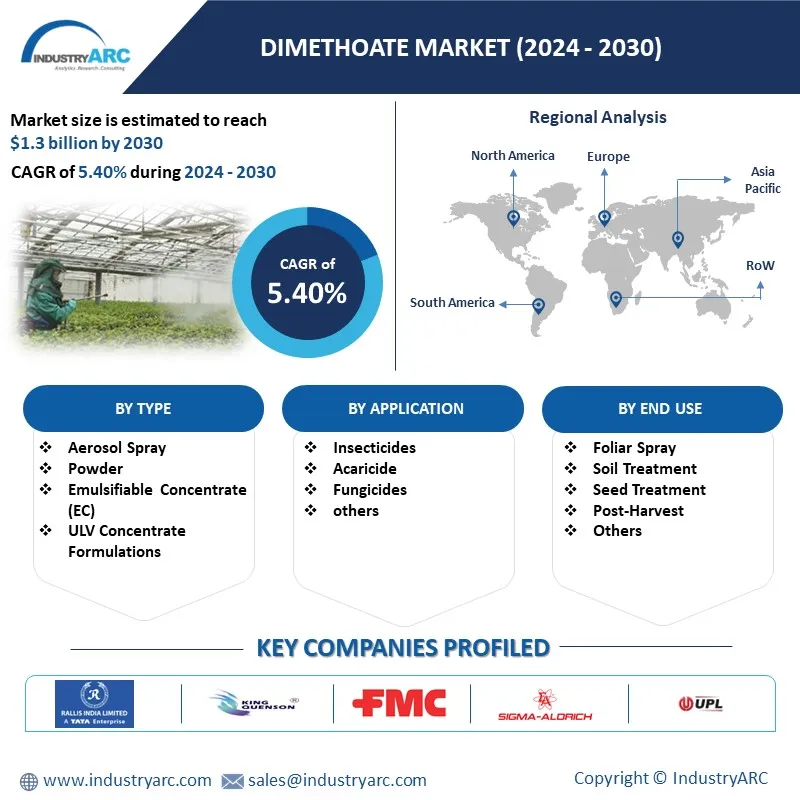
Dimethoate Market size is forecast to reach around $1.3 billion by 2030, after growing at a CAGR of 5.4% during 2024-2030. Dimethoate is an organophosphate insecticide with a camphor-like odor. Dimethoate is extensively used against a broad range of insects and pests like aphids, mites, thrips, and whiteflies which infect a number of crops like cotton, olives, mites, potatoes, tea, tobacco, and other vegetables. The dimethoate market is experiencing substantial growth propelled by two key factors such as the global surge in food demand and its cost-effective, high-yield capabilities. As the world population expands, the need for efficient agricultural solutions intensifies. Dimethoate, a widely used organophosphorus insecticide, addresses this demand by offering effective pest control across various crops. Its affordability and efficacy contribute to its widespread adoption, especially in regions where cost-efficient agricultural practices are paramount. This rise in global food demand, coupled with dimethoate's ability to provide cost-effective pest management, positions the market as a crucial player in sustaining agricultural productivity and addressing food security challenges. Globally demand for Dimethoate market is expected to increase due to increased use of the chemical in agriculture, declining agricultural land, and growing population. However, stringent regulations about the utility & distribution of dimethoate pesticides and eco-friendly substitutes of dimethoate pesticides like Buprofezin & Imazamox, may act as a restraint for the growth of the market.
Market Snapshot
Report Coverage
The report: “Dimethoate Market – Forecast (2024-2030)”, by IndustryARC, covers an in-depth analysis of the following segments of the Dimethoate Industry.
By Type: Aerosol Spray, Powder, Emulsifiable Concentrate (EC), and ULV Concentrate Formulations
By Crop Type: Agricultural Crops (Grains & Cereals, Oilseeds, Fruits & Vegetables, and Others) and Non-Agricultural (Turf & Ornamental, Plantation Crops, and Others)
By Application: Insecticides, Acaricide, Fungicides, and others
By End-Use: Foliar Spray, Soil Treatment, Seed Treatment, Post-Harvest, and Others
By Geography: North America, South America, Europe, APAC, and RoW
Key Takeaways
• The decline in agricultural land and growing food demand leading to demand for efficient and highly productive agricultural processes are expected to drive the market for dimethoate.
• The demand for Dimethoate is projected to grow at greater velocity in the South America and African regions due to escalating in food demand and availability of the agricultural land
• The European market is witnessing a shift towards bio-based insecticides and pesticides. This may restrain the growth of the dimethoate market.
Dimethoate Market Segment Analysis - By Type
Emulsifiable Concentrate (EC) segment hold the largest share of more than 35% in the dimethoate market in 2023. Emulsifiable concentrates are oily liquid formulations that are prepared by dissolving a certain amount of pesticide in organic solvents such as benzene, toluene, xylene, and solvent oil, and also contain surfactants and other additives. ECs are simple to manufacture, have good chemical stability and spontaneous emulsification upon dilution. These set of properties augments the demand for emulsifiable concentrate (EC) dimethoates. However, main disadvantage of using EC is that they contain flammable organic solvents that can lead to high production costs, increased combustibility, and risks of explosion.
Dimethoate Market Segment Analysis - By Crop Type
Agricultural crops segment dominates the dimethoate market with a share of more than 55% in 2023. According to the United Nations Organization (UNO), world population is projected to reach 8.5 billion in 2030, and to increase further to 9.7 billion in 2050. The growing population has increased the demand of cereals, oilseeds, and vegetables, which in turn boost the agriculture sector along with the use of dimethoates to protect crops, fruits and vegetables from insects to improve the per hectare production and fulfill the ever-growing demand for food. The Organisation for Economic Co-operation and Development has forecasted that global cereal production is projected to expand by 13% by 2027, subsequently augmenting the growth of dimethoate market.
Dimethoate Market Segment Analysis - By Application
Insecticides segment holds the largest share of more than 40% in the dimethoate market in 2023. The insects damage the crops by feeding over the leaves, stems, fruits, and roots of the plants. This causes injury to the plant part and promotes the viral, fungal, and bacterial infections resulting in the plant death. Accelerating use of dimethoate for eradication of insects such as grasshoppers, caterpillars, beetles is driving the growth of the market. Dimethoate acts as a cholinesterase inhibitor that block the normal breakdown of acetylcholine, the main neurotransmitter that functions in both the peripheral nervous system and the central nervous system. Acetylcholine can then build up, causing a "jam" in the nervous system and lead to death of insects.
Dimethoate Market Segment Analysis - By End-Use Industry
Based on the end-user, the foliar segment holds the largest share of 30% in the dimethoate market in 2023. Foliar feeding is an effective technique of applying pesticides directly onto the crops. Direct contact of pesticides with pests and insects results in faster application of dimethoate. Dimethoate affects the central nervous system of pests. Destruction of the nervous system kill the insects and results in better crop productivity. Moreover, other mode of application such as soil treatment and post-harvest takes sufficient time in eliminating pests and thus, less preferred as compared to foliar application.
Dimethoate Market Segment Analysis - Geography
Among the regions, the Asia Pacific is projected to witness the highest CAGR of around 7% in the global market during the forecast period. Rapid industrialization and urbanization in emerging economic nations like China, India, and Malaysia has decreased the farming land further proliferating the use of dimethoate for pest elimination and high agricultural output. Furthermore, increase in commercial farming coupled with rapid population growth has fueled the growth of the dimethoate market. According to the Indian governmental report, total consumption of the food and beverage segment domestically is expected to reach $1.142 Tn by 2025, subsequently aiding the demand for dimethoate.

Dimethoate Market Drivers
FDI and government initiatives to boosts agriculture sector
Government’s initiatives to increase the crop yield to mitigate the growing food demand drive the growth of the dimethoate market. For instance, according to Invest India 2024, All efforts are being made by the Ministry of Food Processing Industries (MoFPI) to promote investments at every stage of the value chain. The food processing sector holds a 12.22% market share. Thus, owing to the various initiatives by the government and huge investments, agricultural production is increasing in the various regions. Thus, with the increasing crop production the demand for dimethoate is also increasing for elimination of mites and insects, which acts as a driver for the growth of the dimethoate market.
High efficacy of dimethoate pesticides or insecticides
Insects or pests are getting adapted to the conventional insecticides hence the demand for organic compounds such as dimethoate is growing. The dimethoate is effective against wide range of pest and destroy nervous system and suppresses metabolic growth of an organism. Due to their high efficacy, they find applications in various agrochemical products such as insecticides, fungicides, weedicides, and acaricides. Thus, the resistance of insects towards various pesticides has made farmers to opt for Dimethoate as an option to fight against the crop-eating insects which in turn boosts the market growth.
Dimethoate Market Challenges
Environmental and Health hazards of dimethoate
The environmental and health hazards of dimethoate are the major factors hampering the growth of the dimethoate market. The use of dimethoate in insecticides contaminates the ground water which and may enter the food chain. Exposure to dimethoate may cause hypotension, chest pain, lower heart rate, damages nervous system and even lead to death. Owing to its adverse effect many countries are banning the use of dimethoate in agrochemical products. For instance, in 2024, Dimethoate use is suspended in Australia because it was discovered that pesticide residue exceeded safety limits.
Emergence of COVID-19
Food distribution channels of almost all countries across the world have been highly disrupted due to COVID 19 crisis. Wastage of fresh vegetables, fruits, and milk due to inability by farmers or entrepreneurs to transport them from point of production to local markets or supermarkets in nearby towns or cities is negatively impacting the agriculture sector. The pandemic has led to disruptions in the global supply chain, affected the production and distribution of agricultural chemicals, including Dimethoate. Lockdowns, restrictions on movement, and labor shortages have impacted agricultural activities and the demand for pesticides. Additionally, the focus on food safety and supply chain resilience has gained prominence during the pandemic. This may lead to increased scrutiny and regulations on pesticide usage, affecting the Dimethoate market dynamics. It's crucial for industry stakeholders to adapt to changing circumstances and navigate the evolving landscape created by the ongoing global health crisis.
Market Landscape
Technology launches, acquisitions and R&D activities are key strategies adopted by players in the dimethoate market report. In 2023, the market of dimethoate has been consolidated by the top 10 companies accounting for XX% of the share. Major players in the dimethoate market are Rallis India Ltd, Shenzhen King Quenson Industry Co., Ltd., FMC Corporation, Sigma-Aldrich, Inc., United Phosphorus Limited, Aroxa Crop Science Pvt Ltd, Drexel Chemical Company, Steve Regan Company, Ageruo and Adama Ltd. among others.
For more Chemicals and Materials Market reports - Please click here
1. Dimethoate Market - Market Overview
1.1 Definitions and Scope
2. Dimethoate Market- Executive Summary
2.1 Market Revenue, Market Size and Key Trends by Company
2.2 Key Trends by Type
2.3 Key Trends by Crop Type
2.4 Key Trends by Application
2.5 Key Trends by End-Use
2.6 Key Trends by Geography
3. Dimethoate Market - Landscape
3.1 Comparative analysis
3.1.1 Market Share Analysis - Top Companies
3.1.2 Product Benchmarking- Top Companies
3.1.3 Top 5 Financials Analysis
3.1.4 Patent Analysis- Top Companies
3.1.5 Pricing Analysis
4. Dimethoate Market - Startup companies Scenario Premium Premium
4.1 Top startup company Analysis by
4.1.1 Investment
4.1.2 Revenue
4.1.3 Market Shares
4.1.4 Market Size and Application Analysis
4.1.5 Venture Capital and Funding Scenario
5. Dimethoate Market – Industry Market Entry Scenario Premium Premium
5.1 Regulatory Framework Overview
5.2 New Business and Ease of Doing business index
5.3 Case studies of successful ventures
5.4 Customer Analysis - Top companies
6. Dimethoate Market - Market Forces
6.1 Market Drivers
6.2 Market Constraints
6.3 Market Opportunities
6.4 Porters five force model
6.4.1 Bargaining power of suppliers
6.4.2 Bargaining powers of customers
6.4.3 Threat of new entrants
6.4.4 Rivalry among existing players
6.4.5 Threat of substitutes
7. Dimethoate Market - Strategic analysis
7.1 Value chain analysis
7.2 Opportunities analysis
7.3 Market life cycle
7.4 Suppliers and distributors Analysis
8. Dimethoate Market – By Type (Market Size - $Million)
8.1 Aerosol Spray
8.2 Powder
8.3 Emulsifiable Concentrate (EC)
8.4 ULV Concentrate Formulations
9. Dimethoate Market – By Crop Type (Market Size - $Million)
9.1 Agricultural Crops
9.1.1 Grains & Cereals
9.1.2 Oilseeds
9.1.3 Fruits & Vegetables
9.1.4 Others
9.2 Non-Agricultural Crops
9.2.1 Turf & Ornamental
9.2.2 Plantation Crops
9.2.3 Others
10. Dimethoate Market – By Application (Market Size - $Million)
10.1 Insecticides
10.2 Acaricide
10.3 Fungicides
10.4 Others
11. Dimethoate Market – By End-Use (Market Size - $Million)
11.1 Foliar Spray
11.2 Soil Treatment
11.3 Seed Treatment
11.4 Post-Harvest
11.5 Others
12. Dimethoate Market - By Geography (Market Size - $Million)
12.1 North America
12.1.1 U.S.
12.1.2 Canada
12.1.3 Mexico
12.2 South America
12.2.1 Brazil
12.2.2 Argentina
12.2.3 Colombia
12.2.4 Chile
12.2.5 Rest of South America
12.3 Europe
12.3.1 U.K
12.3.2 Germany
12.3.3 Italy
12.3.4 France
12.3.5 Russia
12.3.6 Spain
12.3.7 Netherland
12.3.8 Belgium
12.3.9 Rest of Europe
12.4 Asia Pacific
12.4.1 China
12.4.2 India
12.4.3 Japan
12.4.4 South Korea
12.4.5 Australia & New Zealand
12.4.6 Rest of Asia Pacific
12.5 RoW
12.5.1 Middle East
12.5.1.1 Saudi Arabia
12.5.1.2 UAE
12.5.1.3 Israel
12.5.1.4 Rest of Middle East
12.5.2 Africa
12.5.2.1 South Africa
12.5.2.2 Nigeria
12.5.2.3 Rest of Africa
13. Dimethoate Market - Entropy
13.1 New Product Launches
13.2 M&A’s, Collaborations, JVs and Partnerships
14. Dimethoate Market- Industry/Segment Competition Landscape Premium
14.1 Market Share by Country- Top Companies
14.2 Market Share by Region- Top companies
14.3 Market Share by Type of Product / Product Category - Top companies
14.4 Market Share at global level- Top companies
14.5 Best Practices for Companies
15. Dimethoate Market- List of Key Companies by Country Premium
16. Dimethoate Market Company Analysis - Business Overview, Product Portfolio, Financials, and Developments
16.1 Rallis India Ltd
16.2 Shenzhen King Quenson Industry Co., Ltd.
16.3 FMC Corporation
16.4 Sigma-Aldrich, Inc.
16.5 United Phosphorus Limited
16.6 Aroxa Crop Science Pvt Ltd
16.7 Drexel Chemical Company
16.8 Steve Regan Company
16.9 Ageruo
16.10 Adama Ltd.
"*Financials would be provided on a best-efforts basis for private companies"
List of Tables:
Table 1: Dimethoate Market Overview 2021-2026
Table 2: Dimethoate Market Leader Analysis 2018-2019 (US$)
Table 3: Dimethoate Market Product Analysis 2018-2019 (US$)
Table 4: Dimethoate Market End User Analysis 2018-2019 (US$)
Table 5: Dimethoate Market Patent Analysis 2013-2018* (US$)
Table 6: Dimethoate Market Financial Analysis 2018-2019 (US$)
Table 7: Dimethoate Market Driver Analysis 2018-2019 (US$)
Table 8: Dimethoate Market Challenges Analysis 2018-2019 (US$)
Table 9: Dimethoate Market Constraint Analysis 2018-2019 (US$)
Table 10: Dimethoate Market Supplier Bargaining Power Analysis 2018-2019 (US$)
Table 11: Dimethoate Market Buyer Bargaining Power Analysis 2018-2019 (US$)
Table 12: Dimethoate Market Threat of Substitutes Analysis 2018-2019 (US$)
Table 13: Dimethoate Market Threat of New Entrants Analysis 2018-2019 (US$)
Table 14: Dimethoate Market Degree of Competition Analysis 2018-2019 (US$)
Table 15: Dimethoate Market Value Chain Analysis 2018-2019 (US$)
Table 16: Dimethoate Market Pricing Analysis 2021-2026 (US$)
Table 17: Dimethoate Market Opportunities Analysis 2021-2026 (US$)
Table 18: Dimethoate Market Product Life Cycle Analysis 2021-2026 (US$)
Table 19: Dimethoate Market Supplier Analysis 2018-2019 (US$)
Table 20: Dimethoate Market Distributor Analysis 2018-2019 (US$)
Table 21: Dimethoate Market Trend Analysis 2018-2019 (US$)
Table 22: Dimethoate Market Size 2018 (US$)
Table 23: Dimethoate Market Forecast Analysis 2021-2026 (US$)
Table 24: Dimethoate Market Sales Forecast Analysis 2021-2026 (Units)
Table 25: Dimethoate Market, Revenue & Volume, By application type, 2021-2026 ($)
Table 26: Dimethoate Market By application type, Revenue & Volume, By Agriculture, 2021-2026 ($)
Table 27: Dimethoate Market By application type, Revenue & Volume, By Livestock, 2021-2026 ($)
Table 28: Dimethoate Market By application type, Revenue & Volume, By Food storage, 2021-2026 ($)
Table 29: North America Dimethoate Market, Revenue & Volume, By application type, 2021-2026 ($)
Table 30: South america Dimethoate Market, Revenue & Volume, By application type, 2021-2026 ($)
Table 31: Europe Dimethoate Market, Revenue & Volume, By application type, 2021-2026 ($)
Table 32: APAC Dimethoate Market, Revenue & Volume, By application type, 2021-2026 ($)
Table 33: Middle East & Africa Dimethoate Market, Revenue & Volume, By application type, 2021-2026 ($)
Table 34: Russia Dimethoate Market, Revenue & Volume, By application type, 2021-2026 ($)
Table 35: Israel Dimethoate Market, Revenue & Volume, By application type, 2021-2026 ($)
Table 36: Top Companies 2018 (US$) Dimethoate Market, Revenue & Volume
Table 37: Product Launch 2018-2019 Dimethoate Market, Revenue & Volume
Table 38: Mergers & Acquistions 2018-2019 Dimethoate Market, Revenue & Volume
List of Figures:
Figure 1: Overview of Dimethoate Market 2021-2026
Figure 2: Market Share Analysis for Dimethoate Market 2018 (US$)
Figure 3: Product Comparison in Dimethoate Market 2018-2019 (US$)
Figure 4: End User Profile for Dimethoate Market 2018-2019 (US$)
Figure 5: Patent Application and Grant in Dimethoate Market 2013-2018* (US$)
Figure 6: Top 5 Companies Financial Analysis in Dimethoate Market 2018-2019 (US$)
Figure 7: Market Entry Strategy in Dimethoate Market 2018-2019
Figure 8: Ecosystem Analysis in Dimethoate Market 2018
Figure 9: Average Selling Price in Dimethoate Market 2021-2026
Figure 10: Top Opportunites in Dimethoate Market 2018-2019
Figure 11: Market Life Cycle Analysis in Dimethoate Market
Figure 12: GlobalBy application type Dimethoate Market Revenue, 2021-2026 ($)
Figure 13: Global Dimethoate Market - By Geography
Figure 14: Global Dimethoate Market Value & Volume, By Geography, 2021-2026 ($)
Figure 15: Global Dimethoate Market CAGR, By Geography, 2021-2026 (%)
Figure 16: North America Dimethoate Market Value & Volume, 2021-2026 ($)
Figure 17: US Dimethoate Market Value & Volume, 2021-2026 ($)
Figure 18: US GDP and Population, 2018-2019 ($)
Figure 19: US GDP – Composition of 2018, By Sector of Origin
Figure 20: US Export and Import Value & Volume, 2018-2019 ($)
Figure 21: Canada Dimethoate Market Value & Volume, 2021-2026 ($)
Figure 22: Canada GDP and Population, 2018-2019 ($)
Figure 23: Canada GDP – Composition of 2018, By Sector of Origin
Figure 24: Canada Export and Import Value & Volume, 2018-2019 ($)
Figure 25: Mexico Dimethoate Market Value & Volume, 2021-2026 ($)
Figure 26: Mexico GDP and Population, 2018-2019 ($)
Figure 27: Mexico GDP – Composition of 2018, By Sector of Origin
Figure 28: Mexico Export and Import Value & Volume, 2018-2019 ($)
Figure 29: South America Dimethoate Market Value & Volume, 2021-2026 ($)
Figure 30: Brazil Dimethoate Market Value & Volume, 2021-2026 ($)
Figure 31: Brazil GDP and Population, 2018-2019 ($)
Figure 32: Brazil GDP – Composition of 2018, By Sector of Origin
Figure 33: Brazil Export and Import Value & Volume, 2018-2019 ($)
Figure 34: Venezuela Dimethoate Market Value & Volume, 2021-2026 ($)
Figure 35: Venezuela GDP and Population, 2018-2019 ($)
Figure 36: Venezuela GDP – Composition of 2018, By Sector of Origin
Figure 37: Venezuela Export and Import Value & Volume, 2018-2019 ($)
Figure 38: Argentina Dimethoate Market Value & Volume, 2021-2026 ($)
Figure 39: Argentina GDP and Population, 2018-2019 ($)
Figure 40: Argentina GDP – Composition of 2018, By Sector of Origin
Figure 41: Argentina Export and Import Value & Volume, 2018-2019 ($)
Figure 42: Ecuador Dimethoate Market Value & Volume, 2021-2026 ($)
Figure 43: Ecuador GDP and Population, 2018-2019 ($)
Figure 44: Ecuador GDP – Composition of 2018, By Sector of Origin
Figure 45: Ecuador Export and Import Value & Volume, 2018-2019 ($)
Figure 46: Peru Dimethoate Market Value & Volume, 2021-2026 ($)
Figure 47: Peru GDP and Population, 2018-2019 ($)
Figure 48: Peru GDP – Composition of 2018, By Sector of Origin
Figure 49: Peru Export and Import Value & Volume, 2018-2019 ($)
Figure 50: Colombia Dimethoate Market Value & Volume, 2021-2026 ($)
Figure 51: Colombia GDP and Population, 2018-2019 ($)
Figure 52: Colombia GDP – Composition of 2018, By Sector of Origin
Figure 53: Colombia Export and Import Value & Volume, 2018-2019 ($)
Figure 54: Costa Rica Dimethoate Market Value & Volume, 2021-2026 ($)
Figure 55: Costa Rica GDP and Population, 2018-2019 ($)
Figure 56: Costa Rica GDP – Composition of 2018, By Sector of Origin
Figure 57: Costa Rica Export and Import Value & Volume, 2018-2019 ($)
Figure 58: Europe Dimethoate Market Value & Volume, 2021-2026 ($)
Figure 59: U.K Dimethoate Market Value & Volume, 2021-2026 ($)
Figure 60: U.K GDP and Population, 2018-2019 ($)
Figure 61: U.K GDP – Composition of 2018, By Sector of Origin
Figure 62: U.K Export and Import Value & Volume, 2018-2019 ($)
Figure 63: Germany Dimethoate Market Value & Volume, 2021-2026 ($)
Figure 64: Germany GDP and Population, 2018-2019 ($)
Figure 65: Germany GDP – Composition of 2018, By Sector of Origin
Figure 66: Germany Export and Import Value & Volume, 2018-2019 ($)
Figure 67: Italy Dimethoate Market Value & Volume, 2021-2026 ($)
Figure 68: Italy GDP and Population, 2018-2019 ($)
Figure 69: Italy GDP – Composition of 2018, By Sector of Origin
Figure 70: Italy Export and Import Value & Volume, 2018-2019 ($)
Figure 71: France Dimethoate Market Value & Volume, 2021-2026 ($)
Figure 72: France GDP and Population, 2018-2019 ($)
Figure 73: France GDP – Composition of 2018, By Sector of Origin
Figure 74: France Export and Import Value & Volume, 2018-2019 ($)
Figure 75: Netherlands Dimethoate Market Value & Volume, 2021-2026 ($)
Figure 76: Netherlands GDP and Population, 2018-2019 ($)
Figure 77: Netherlands GDP – Composition of 2018, By Sector of Origin
Figure 78: Netherlands Export and Import Value & Volume, 2018-2019 ($)
Figure 79: Belgium Dimethoate Market Value & Volume, 2021-2026 ($)
Figure 80: Belgium GDP and Population, 2018-2019 ($)
Figure 81: Belgium GDP – Composition of 2018, By Sector of Origin
Figure 82: Belgium Export and Import Value & Volume, 2018-2019 ($)
Figure 83: Spain Dimethoate Market Value & Volume, 2021-2026 ($)
Figure 84: Spain GDP and Population, 2018-2019 ($)
Figure 85: Spain GDP – Composition of 2018, By Sector of Origin
Figure 86: Spain Export and Import Value & Volume, 2018-2019 ($)
Figure 87: Denmark Dimethoate Market Value & Volume, 2021-2026 ($)
Figure 88: Denmark GDP and Population, 2018-2019 ($)
Figure 89: Denmark GDP – Composition of 2018, By Sector of Origin
Figure 90: Denmark Export and Import Value & Volume, 2018-2019 ($)
Figure 91: APAC Dimethoate Market Value & Volume, 2021-2026 ($)
Figure 92: China Dimethoate Market Value & Volume, 2021-2026
Figure 93: China GDP and Population, 2018-2019 ($)
Figure 94: China GDP – Composition of 2018, By Sector of Origin
Figure 95: China Export and Import Value & Volume, 2018-2019 ($) Dimethoate Market China Export and Import Value & Volume, 2018-2019 ($)
Figure 96: Australia Dimethoate Market Value & Volume, 2021-2026 ($)
Figure 97: Australia GDP and Population, 2018-2019 ($)
Figure 98: Australia GDP – Composition of 2018, By Sector of Origin
Figure 99: Australia Export and Import Value & Volume, 2018-2019 ($)
Figure 100: South Korea Dimethoate Market Value & Volume, 2021-2026 ($)
Figure 101: South Korea GDP and Population, 2018-2019 ($)
Figure 102: South Korea GDP – Composition of 2018, By Sector of Origin
Figure 103: South Korea Export and Import Value & Volume, 2018-2019 ($)
Figure 104: India Dimethoate Market Value & Volume, 2021-2026 ($)
Figure 105: India GDP and Population, 2018-2019 ($)
Figure 106: India GDP – Composition of 2018, By Sector of Origin
Figure 107: India Export and Import Value & Volume, 2018-2019 ($)
Figure 108: Taiwan Dimethoate Market Value & Volume, 2021-2026 ($)
Figure 109: Taiwan GDP and Population, 2018-2019 ($)
Figure 110: Taiwan GDP – Composition of 2018, By Sector of Origin
Figure 111: Taiwan Export and Import Value & Volume, 2018-2019 ($)
Figure 112: Malaysia Dimethoate Market Value & Volume, 2021-2026 ($)
Figure 113: Malaysia GDP and Population, 2018-2019 ($)
Figure 114: Malaysia GDP – Composition of 2018, By Sector of Origin
Figure 115: Malaysia Export and Import Value & Volume, 2018-2019 ($)
Figure 116: Hong Kong Dimethoate Market Value & Volume, 2021-2026 ($)
Figure 117: Hong Kong GDP and Population, 2018-2019 ($)
Figure 118: Hong Kong GDP – Composition of 2018, By Sector of Origin
Figure 119: Hong Kong Export and Import Value & Volume, 2018-2019 ($)
Figure 120: Middle East & Africa Dimethoate Market Middle East & Africa 3D Printing Market Value & Volume, 2021-2026 ($)
Figure 121: Russia Dimethoate Market Value & Volume, 2021-2026 ($)
Figure 122: Russia GDP and Population, 2018-2019 ($)
Figure 123: Russia GDP – Composition of 2018, By Sector of Origin
Figure 124: Russia Export and Import Value & Volume, 2018-2019 ($)
Figure 125: Israel Dimethoate Market Value & Volume, 2021-2026 ($)
Figure 126: Israel GDP and Population, 2018-2019 ($)
Figure 127: Israel GDP – Composition of 2018, By Sector of Origin
Figure 128: Israel Export and Import Value & Volume, 2018-2019 ($)
Figure 129: Entropy Share, By Strategies, 2018-2019* (%) Dimethoate Market
Figure 130: Developments, 2018-2019* Dimethoate Market
Figure 131: Company 1 Dimethoate Market Net Revenue, By Years, 2018-2019* ($)
Figure 132: Company 1 Dimethoate Market Net Revenue Share, By Business segments, 2018 (%)
Figure 133: Company 1 Dimethoate Market Net Sales Share, By Geography, 2018 (%)
Figure 134: Company 2 Dimethoate Market Net Revenue, By Years, 2018-2019* ($)
Figure 135: Company 2 Dimethoate Market Net Revenue Share, By Business segments, 2018 (%)
Figure 136: Company 2 Dimethoate Market Net Sales Share, By Geography, 2018 (%)
Figure 137: Company 3 Dimethoate Market Net Revenue, By Years, 2018-2019* ($)
Figure 138: Company 3 Dimethoate Market Net Revenue Share, By Business segments, 2018 (%)
Figure 139: Company 3 Dimethoate Market Net Sales Share, By Geography, 2018 (%)
Figure 140: Company 4 Dimethoate Market Net Revenue, By Years, 2018-2019* ($)
Figure 141: Company 4 Dimethoate Market Net Revenue Share, By Business segments, 2018 (%)
Figure 142: Company 4 Dimethoate Market Net Sales Share, By Geography, 2018 (%)
Figure 143: Company 5 Dimethoate Market Net Revenue, By Years, 2018-2019* ($)
Figure 144: Company 5 Dimethoate Market Net Revenue Share, By Business segments, 2018 (%)
Figure 145: Company 5 Dimethoate Market Net Sales Share, By Geography, 2018 (%)
Figure 146: Company 6 Dimethoate Market Net Revenue, By Years, 2018-2019* ($)
Figure 147: Company 6 Dimethoate Market Net Revenue Share, By Business segments, 2018 (%)
Figure 148: Company 6 Dimethoate Market Net Sales Share, By Geography, 2018 (%)
Figure 149: Company 7 Dimethoate Market Net Revenue, By Years, 2018-2019* ($)
Figure 150: Company 7 Dimethoate Market Net Revenue Share, By Business segments, 2018 (%)
Figure 151: Company 7 Dimethoate Market Net Sales Share, By Geography, 2018 (%)
Figure 152: Company 8 Dimethoate Market Net Revenue, By Years, 2018-2019* ($)
Figure 153: Company 8 Dimethoate Market Net Revenue Share, By Business segments, 2018 (%)
Figure 154: Company 8 Dimethoate Market Net Sales Share, By Geography, 2018 (%)
Figure 155: Company 9 Dimethoate Market Net Revenue, By Years, 2018-2019* ($)
Figure 156: Company 9 Dimethoate Market Net Revenue Share, By Business segments, 2018 (%)
Figure 157: Company 9 Dimethoate Market Net Sales Share, By Geography, 2018 (%)
Figure 158: Company 10 Dimethoate Market Net Revenue, By Years, 2018-2019* ($)
Figure 159: Company 10 Dimethoate Market Net Revenue Share, By Business segments, 2018 (%)
Figure 160: Company 10 Dimethoate Market Net Sales Share, By Geography, 2018 (%)
Figure 161: Company 11 Dimethoate Market Net Revenue, By Years, 2018-2019* ($)
Figure 162: Company 11 Dimethoate Market Net Revenue Share, By Business segments, 2018 (%)
Figure 163: Company 11 Dimethoate Market Net Sales Share, By Geography, 2018 (%)
Figure 164: Company 12 Dimethoate Market Net Revenue, By Years, 2018-2019* ($)
Figure 165: Company 12 Dimethoate Market Net Revenue Share, By Business segments, 2018 (%)
Figure 166: Company 12 Dimethoate Market Net Sales Share, By Geography, 2018 (%)
Figure 167: Company 13 Dimethoate Market Net Revenue, By Years, 2018-2019* ($)
Figure 168: Company 13 Dimethoate Market Net Revenue Share, By Business segments, 2018 (%)
Figure 169: Company 13 Dimethoate Market Net Sales Share, By Geography, 2018 (%)
Figure 170: Company 14 Dimethoate Market Net Revenue, By Years, 2018-2019* ($)
Figure 171: Company 14 Dimethoate Market Net Revenue Share, By Business segments, 2018 (%)
Figure 172: Company 14 Dimethoate Market Net Sales Share, By Geography, 2018 (%)
Figure 173: Company 15 Dimethoate Market Net Revenue, By Years, 2018-2019* ($)
Figure 174: Company 15 Dimethoate Market Net Revenue Share, By Business segments, 2018 (%)
Figure 175: Company 15 Dimethoate Market Net Sales Share, By Geography, 2018 (%)