 Email
Email Print
Print


Dodecanedioic Acid Market Overview
The Dodecanedioic Acid Market size is estimated to grow at a CAGR of 5.6% during the forecast period 2022-2027 and reach US$1.1 billion by 2027. Dodecanedioic acid is a dicarboxylic acid that can be produced using butadiene or paraffin wax as its primary material. They are primarily used in a wide range of applications which include surfactants, painting materials, engineering plastics and more. The growth of the automotive and cosmetic & personal care industries is expected to drive the growth of the dodecanedioic acid market size in the upcoming years. For instance, according to the International Organization of Motor Vehicle Manufacturers (OICA), the total global automobile production reached 80.2 billion units in 2021, an increase of 3% as compared to 77.7 billion units in 2020. In 2020, the surge in the COVID-19 pandemic negatively impacted the growth of the dodecanedioic acid industry. Meanwhile, the fluctuating prices of raw materials may confine the market growth.
Dodecanedioic
Acid Market Report Coverage
The
"Dodecanedioic Acid Market Report – Forecast (2022-2027)” by IndustryARC,
covers an in-depth analysis of the following segments in the Dodecanedioic Acid Market.
Key Takeaways
- The paint materials segment
held a significant share in the Dodecanedioic Acid Market in 2021. The
properties of dodecanedioic acid such
as high resistance to corrosion and chemicals, thermal stability, along with
enhanced performance make them ideal for use in the production of resins,
adhesives and other materials used to manufacture paints and coating.
- Paints & coating
industry held the largest share in the Dodecanedioic
Acid Market in 2021, owing to the increasing demand for dodecanedioic acid from
the coating sector across the world.
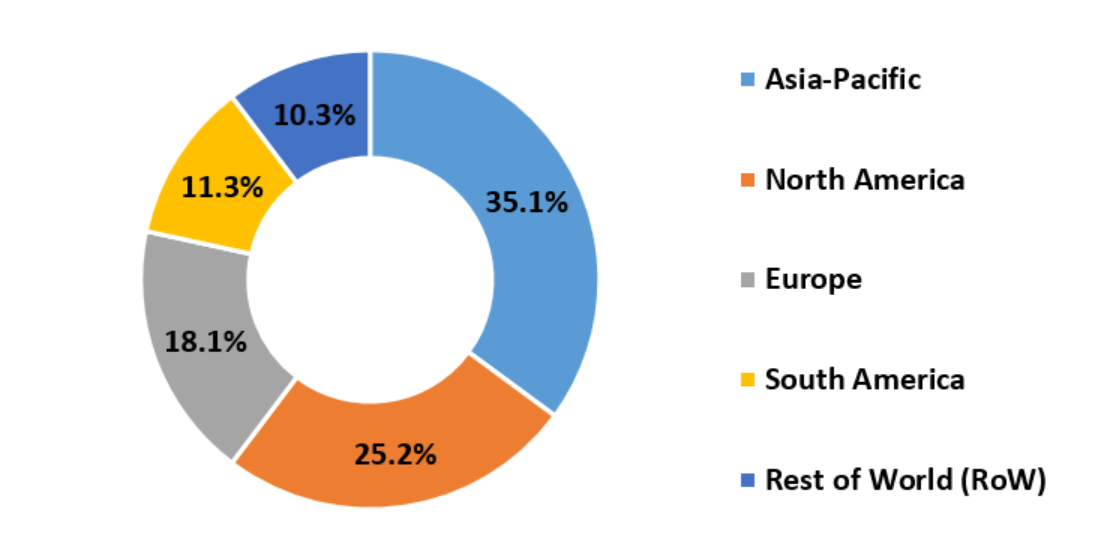
- Asia-Pacific dominated the Dodecanedioic Acid Market in 2021, owing to its increasing demand from the coating sector in the region. For instance, in July 2019, Asian Paints commenced the commercial production of coatings and intermediaries in the Mysore plant in India, with a total capacity of 211,888 tons per annum.
- A detailed analysis of strengths, weaknesses, opportunities and threats will be provided in the Dodecanedioic Acid Market Report.
Dodecanedioic Acid Market Segment Analysis – by Application
The paint
materials segment held a significant Dodecanedioic Acid Market share of over 20%
in 2021, owing to the
increasing demand for dodecanedioic acid for use in the
production of resins, adhesives to manufacture paints and
coating. The properties of dodecanedioic acid such as high corrosion resistance,
thermal stability, chemical resistance and enhanced performance make it ideal
for use in such applications. For instance, in 2021, Nippon
Paints Group made medium to long-term investments for upgrading and
streamlining industrial facilities in Japan from 2021 to 2023 to boost the
production of paints and coatings in the country. Thus, such an increase in the production of
paints & coating is expected to boost the market growth during the forecast
period.
Dodecanedioic Acid Market Segment Analysis – by End-use Industry
The paints &
coating industry held the largest Dodecanedioic Acid Market share of over 25%
in 2021, owing to the
increasing production of paints and coatings across the globe. For instance,
according to Japan Paint Manufacturers Association (JPMA), the total paints and
coatings production in Japan reached up to 1,645,960 tons during the year 2019.
Moreover, according to the British Coatings Federation (BCF), the first 5
months of 2021 achieved significant sales results in both industrial and
decorative coatings in the United Kingdom, owing to strong consumer demand for
DIY commodities such as paints and coatings in the country. Dodecanedioic acid is a dicarboxylic acid composed of butadiene or paraffin
wax and it is primarily used in the production of resins to manufacture
paints and coating. Thus, such surging growth of the paints &
coating sector is expected to expand
the dodecanedioic acid market size during the forecast period.
Dodecanedioic Acid Market Segment Analysis – by Geography
Asia-Pacific held a dominant Dodecanedioic Acid Market share of around 35% in the year 2021. The consumption of dodecanedioic acid is particularly high in this region due to its increasing demand from the coating sector in the region. For instance, according to Japan Paint Manufacturers Association (JPMA), the total paints and coatings production in Japan reached up to 1487.7 million tons in 2020. Moreover, in 2020, the government of Vietnam announced its plan to develop the paint and coating industry with a vision for 2030. The average growth rate in the production value of the paint and coating industry is expected to reach up to 14% during the period from 2021 to 2030. Thus, such surging growth of the coating sector in the region is anticipated to propel the growth of the market during the forecast period.
Dodecanedioic Acid Market Drivers
An increase in automotive production
Dodecanedioic acid
is primarily used in the manufacturing of engineering plastics such as nylon
which is utilized in the automotive industry for the production of
interior and exterior automotive components. According to the International
Organization of Motor Vehicle Manufacturers (OICA), the total automobile
production in 2021 in Europe, America, Asia and Africa increased by 25%, 17%,
28% and 37% respectively in comparison to 2020. Hence, an
increase in global automotive production is expected to increase the demand for dodecanedioic acid for the production of engineering plastics
utilized in the industry, owing to their above-mentioned usage. This is
anticipated to drive the growth of the dodecanedioic acid market in the
upcoming years.
Growth of the cosmetic & personal industry
Dodecanedioic
acid is a dicarboxylic acid composed of butadiene or paraffin wax and it is
commonly used in the production of surfactants, additives and fragrances
utilized in cosmetics & personal care products. According to the European
Trade Association for the Cosmetics and Personal Care Industry, the total
consumption of the cosmetics and personal care industry in Europe was valued at
EUR 80 billion (US$94.6 billion) in 2021, an increase of 4.3% as compared to
EUR 76.7 billion (US$87.6 billion) in 2020. Moreover, according to a study
published on Fashion Network, skin care and sun care products produced an
average annual growth of 5.6% in 2020. Thus, such surging growth of the
cosmetics and personal care industry is expected to increase the demand for
dodecanedioic acid, owing to its above-mentioned usage. This is expected to
fuel the growth of the market in the upcoming years.
Dodecanedioic Acid Market Challenge
Fluctuating prices of raw materials
Some of the raw materials used in the
production of synthetic dodecanedioic acid are obtained from crude oil. As a
result, fluctuations in the prices of crude oil may hinder the growth of the
market. For instance, in 2020, the international benchmark for petroleum prices
across the world also known as Brent crude prices decreased to US$9.12 per
barrel, which was the lowest record since December 10, 1998. Likewise, in April
2020, India’s Crude Oil Basket (COB) reached US$19.90 per barrel, which was the
lowest record since February 2002. Furthermore, as per revised estimates for
2020-21, the COB has increased by around 35% from its initial budget estimate.
In this way, such uncertainty regarding the price of crude oil may affect the
prices of raw materials that are used in the production of dodecanedioic acid. Thus,
such instability and fluctuating prices of raw materials may limit the growth
of the dodecanedioic acid industry during the forecast period.
Dodecanedioic Acid Industry Outlook
Technology launches, acquisitions and increased R&D activities are
key strategies adopted by players in the Dodecanedioic
Acid Market. The top 10 companies in the Dodecanedioic Acid Market are:
- BASF SE
- Evonik Industries AG
- Cathay Biotech Inc.
- ChemCeed LLC
- Santa Cruz Biotechnology Inc.
- Selleck Chemicals
- Merck KGaA
- Toronto Research Chemicals
- UBE Industries Ltd.
- Zibo Guangtong Chemical Co. Ltd.
Relevant Reports
Report Code: CMR
20369
Report Code: CMR
0025
Report Code: CMR 0285
For more Chemicals and Materials Market reports, please click here
Table 1: Dodecanedioic Acid Market Overview 2021-2026
Table 2: Dodecanedioic Acid Market Leader Analysis 2018-2019 (US$)
Table 3: Dodecanedioic Acid Market Product Analysis 2018-2019 (US$)
Table 4: Dodecanedioic Acid Market End User Analysis 2018-2019 (US$)
Table 5: Dodecanedioic Acid Market Patent Analysis 2013-2018* (US$)
Table 6: Dodecanedioic Acid Market Financial Analysis 2018-2019 (US$)
Table 7: Dodecanedioic Acid Market Driver Analysis 2018-2019 (US$)
Table 8: Dodecanedioic Acid Market Challenges Analysis 2018-2019 (US$)
Table 9: Dodecanedioic Acid Market Constraint Analysis 2018-2019 (US$)
Table 10: Dodecanedioic Acid Market Supplier Bargaining Power Analysis 2018-2019 (US$)
Table 11: Dodecanedioic Acid Market Buyer Bargaining Power Analysis 2018-2019 (US$)
Table 12: Dodecanedioic Acid Market Threat of Substitutes Analysis 2018-2019 (US$)
Table 13: Dodecanedioic Acid Market Threat of New Entrants Analysis 2018-2019 (US$)
Table 14: Dodecanedioic Acid Market Degree of Competition Analysis 2018-2019 (US$)
Table 15: Dodecanedioic Acid Market Value Chain Analysis 2018-2019 (US$)
Table 16: Dodecanedioic Acid Market Pricing Analysis 2021-2026 (US$)
Table 17: Dodecanedioic Acid Market Opportunities Analysis 2021-2026 (US$)
Table 18: Dodecanedioic Acid Market Product Life Cycle Analysis 2021-2026 (US$)
Table 19: Dodecanedioic Acid Market Supplier Analysis 2018-2019 (US$)
Table 20: Dodecanedioic Acid Market Distributor Analysis 2018-2019 (US$)
Table 21: Dodecanedioic Acid Market Trend Analysis 2018-2019 (US$)
Table 22: Dodecanedioic Acid Market Size 2018 (US$)
Table 23: Dodecanedioic Acid Market Forecast Analysis 2021-2026 (US$)
Table 24: Dodecanedioic Acid Market Sales Forecast Analysis 2021-2026 (Units)
Table 25: Dodecanedioic Acid Market, Revenue & Volume, By Application, 2021-2026 ($)
Table 26: Dodecanedioic Acid Market By Application, Revenue & Volume, By High performance polyamides, 2021-2026 ($)
Table 27: Dodecanedioic Acid Market By Application, Revenue & Volume, By Polyester coatings, 2021-2026 ($)
Table 28: Dodecanedioic Acid Market By Application, Revenue & Volume, By Diester synthetic lubricants, 2021-2026 ($)
Table 29: Dodecanedioic Acid Market By Application, Revenue & Volume, By Adhesives, 2021-2026 ($)
Table 30: Dodecanedioic Acid Market By Application, Revenue & Volume, By Others, 2021-2026 ($)
Table 31: North America Dodecanedioic Acid Market, Revenue & Volume, By Application, 2021-2026 ($)
Table 32: South america Dodecanedioic Acid Market, Revenue & Volume, By Application, 2021-2026 ($)
Table 33: Europe Dodecanedioic Acid Market, Revenue & Volume, By Application, 2021-2026 ($)
Table 34: APAC Dodecanedioic Acid Market, Revenue & Volume, By Application, 2021-2026 ($)
Table 35: Middle East & Africa Dodecanedioic Acid Market, Revenue & Volume, By Application, 2021-2026 ($)
Table 36: Russia Dodecanedioic Acid Market, Revenue & Volume, By Application, 2021-2026 ($)
Table 37: Israel Dodecanedioic Acid Market, Revenue & Volume, By Application, 2021-2026 ($)
Table 38: Top Companies 2018 (US$)Dodecanedioic Acid Market, Revenue & Volume
Table 39: Product Launch 2018-2019Dodecanedioic Acid Market, Revenue & Volume
Table 40: Mergers & Acquistions 2018-2019Dodecanedioic Acid Market, Revenue & Volume
List of Figures:
Figure 1: Overview of Dodecanedioic Acid Market 2021-2026
Figure 2: Market Share Analysis for Dodecanedioic Acid Market 2018 (US$)
Figure 3: Product Comparison in Dodecanedioic Acid Market 2018-2019 (US$)
Figure 4: End User Profile for Dodecanedioic Acid Market 2018-2019 (US$)
Figure 5: Patent Application and Grant in Dodecanedioic Acid Market 2013-2018* (US$)
Figure 6: Top 5 Companies Financial Analysis in Dodecanedioic Acid Market 2018-2019 (US$)
Figure 7: Market Entry Strategy in Dodecanedioic Acid Market 2018-2019
Figure 8: Ecosystem Analysis in Dodecanedioic Acid Market 2018
Figure 9: Average Selling Price in Dodecanedioic Acid Market 2021-2026
Figure 10: Top Opportunites in Dodecanedioic Acid Market 2018-2019
Figure 11: Market Life Cycle Analysis in Dodecanedioic Acid Market
Figure 12: GlobalBy ApplicationDodecanedioic Acid Market Revenue, 2021-2026 ($)
Figure 13: Global Dodecanedioic Acid Market - By Geography
Figure 14: Global Dodecanedioic Acid Market Value & Volume, By Geography, 2021-2026 ($)
Figure 15: Global Dodecanedioic Acid Market CAGR, By Geography, 2021-2026 (%)
Figure 16: North America Dodecanedioic Acid Market Value & Volume, 2021-2026 ($)
Figure 17: US Dodecanedioic Acid Market Value & Volume, 2021-2026 ($)
Figure 18: US GDP and Population, 2018-2019 ($)
Figure 19: US GDP – Composition of 2018, By Sector of Origin
Figure 20: US Export and Import Value & Volume, 2018-2019 ($)
Figure 21: Canada Dodecanedioic Acid Market Value & Volume, 2021-2026 ($)
Figure 22: Canada GDP and Population, 2018-2019 ($)
Figure 23: Canada GDP – Composition of 2018, By Sector of Origin
Figure 24: Canada Export and Import Value & Volume, 2018-2019 ($)
Figure 25: Mexico Dodecanedioic Acid Market Value & Volume, 2021-2026 ($)
Figure 26: Mexico GDP and Population, 2018-2019 ($)
Figure 27: Mexico GDP – Composition of 2018, By Sector of Origin
Figure 28: Mexico Export and Import Value & Volume, 2018-2019 ($)
Figure 29: South America Dodecanedioic Acid Market Value & Volume, 2021-2026 ($)
Figure 30: Brazil Dodecanedioic Acid Market Value & Volume, 2021-2026 ($)
Figure 31: Brazil GDP and Population, 2018-2019 ($)
Figure 32: Brazil GDP – Composition of 2018, By Sector of Origin
Figure 33: Brazil Export and Import Value & Volume, 2018-2019 ($)
Figure 34: Venezuela Dodecanedioic Acid Market Value & Volume, 2021-2026 ($)
Figure 35: Venezuela GDP and Population, 2018-2019 ($)
Figure 36: Venezuela GDP – Composition of 2018, By Sector of Origin
Figure 37: Venezuela Export and Import Value & Volume, 2018-2019 ($)
Figure 38: Argentina Dodecanedioic Acid Market Value & Volume, 2021-2026 ($)
Figure 39: Argentina GDP and Population, 2018-2019 ($)
Figure 40: Argentina GDP – Composition of 2018, By Sector of Origin
Figure 41: Argentina Export and Import Value & Volume, 2018-2019 ($)
Figure 42: Ecuador Dodecanedioic Acid Market Value & Volume, 2021-2026 ($)
Figure 43: Ecuador GDP and Population, 2018-2019 ($)
Figure 44: Ecuador GDP – Composition of 2018, By Sector of Origin
Figure 45: Ecuador Export and Import Value & Volume, 2018-2019 ($)
Figure 46: Peru Dodecanedioic Acid Market Value & Volume, 2021-2026 ($)
Figure 47: Peru GDP and Population, 2018-2019 ($)
Figure 48: Peru GDP – Composition of 2018, By Sector of Origin
Figure 49: Peru Export and Import Value & Volume, 2018-2019 ($)
Figure 50: Colombia Dodecanedioic Acid Market Value & Volume, 2021-2026 ($)
Figure 51: Colombia GDP and Population, 2018-2019 ($)
Figure 52: Colombia GDP – Composition of 2018, By Sector of Origin
Figure 53: Colombia Export and Import Value & Volume, 2018-2019 ($)
Figure 54: Costa Rica Dodecanedioic Acid Market Value & Volume, 2021-2026 ($)
Figure 55: Costa Rica GDP and Population, 2018-2019 ($)
Figure 56: Costa Rica GDP – Composition of 2018, By Sector of Origin
Figure 57: Costa Rica Export and Import Value & Volume, 2018-2019 ($)
Figure 58: Europe Dodecanedioic Acid Market Value & Volume, 2021-2026 ($)
Figure 59: U.K Dodecanedioic Acid Market Value & Volume, 2021-2026 ($)
Figure 60: U.K GDP and Population, 2018-2019 ($)
Figure 61: U.K GDP – Composition of 2018, By Sector of Origin
Figure 62: U.K Export and Import Value & Volume, 2018-2019 ($)
Figure 63: Germany Dodecanedioic Acid Market Value & Volume, 2021-2026 ($)
Figure 64: Germany GDP and Population, 2018-2019 ($)
Figure 65: Germany GDP – Composition of 2018, By Sector of Origin
Figure 66: Germany Export and Import Value & Volume, 2018-2019 ($)
Figure 67: Italy Dodecanedioic Acid Market Value & Volume, 2021-2026 ($)
Figure 68: Italy GDP and Population, 2018-2019 ($)
Figure 69: Italy GDP – Composition of 2018, By Sector of Origin
Figure 70: Italy Export and Import Value & Volume, 2018-2019 ($)
Figure 71: France Dodecanedioic Acid Market Value & Volume, 2021-2026 ($)
Figure 72: France GDP and Population, 2018-2019 ($)
Figure 73: France GDP – Composition of 2018, By Sector of Origin
Figure 74: France Export and Import Value & Volume, 2018-2019 ($)
Figure 75: Netherlands Dodecanedioic Acid Market Value & Volume, 2021-2026 ($)
Figure 76: Netherlands GDP and Population, 2018-2019 ($)
Figure 77: Netherlands GDP – Composition of 2018, By Sector of Origin
Figure 78: Netherlands Export and Import Value & Volume, 2018-2019 ($)
Figure 79: Belgium Dodecanedioic Acid Market Value & Volume, 2021-2026 ($)
Figure 80: Belgium GDP and Population, 2018-2019 ($)
Figure 81: Belgium GDP – Composition of 2018, By Sector of Origin
Figure 82: Belgium Export and Import Value & Volume, 2018-2019 ($)
Figure 83: Spain Dodecanedioic Acid Market Value & Volume, 2021-2026 ($)
Figure 84: Spain GDP and Population, 2018-2019 ($)
Figure 85: Spain GDP – Composition of 2018, By Sector of Origin
Figure 86: Spain Export and Import Value & Volume, 2018-2019 ($)
Figure 87: Denmark Dodecanedioic Acid Market Value & Volume, 2021-2026 ($)
Figure 88: Denmark GDP and Population, 2018-2019 ($)
Figure 89: Denmark GDP – Composition of 2018, By Sector of Origin
Figure 90: Denmark Export and Import Value & Volume, 2018-2019 ($)
Figure 91: APAC Dodecanedioic Acid Market Value & Volume, 2021-2026 ($)
Figure 92: China Dodecanedioic Acid Market Value & Volume, 2021-2026
Figure 93: China GDP and Population, 2018-2019 ($)
Figure 94: China GDP – Composition of 2018, By Sector of Origin
Figure 95: China Export and Import Value & Volume, 2018-2019 ($)Dodecanedioic Acid Market China Export and Import Value & Volume, 2018-2019 ($)
Figure 96: Australia Dodecanedioic Acid Market Value & Volume, 2021-2026 ($)
Figure 97: Australia GDP and Population, 2018-2019 ($)
Figure 98: Australia GDP – Composition of 2018, By Sector of Origin
Figure 99: Australia Export and Import Value & Volume, 2018-2019 ($)
Figure 100: South Korea Dodecanedioic Acid Market Value & Volume, 2021-2026 ($)
Figure 101: South Korea GDP and Population, 2018-2019 ($)
Figure 102: South Korea GDP – Composition of 2018, By Sector of Origin
Figure 103: South Korea Export and Import Value & Volume, 2018-2019 ($)
Figure 104: India Dodecanedioic Acid Market Value & Volume, 2021-2026 ($)
Figure 105: India GDP and Population, 2018-2019 ($)
Figure 106: India GDP – Composition of 2018, By Sector of Origin
Figure 107: India Export and Import Value & Volume, 2018-2019 ($)
Figure 108: Taiwan Dodecanedioic Acid Market Value & Volume, 2021-2026 ($)
Figure 109: Taiwan GDP and Population, 2018-2019 ($)
Figure 110: Taiwan GDP – Composition of 2018, By Sector of Origin
Figure 111: Taiwan Export and Import Value & Volume, 2018-2019 ($)
Figure 112: Malaysia Dodecanedioic Acid Market Value & Volume, 2021-2026 ($)
Figure 113: Malaysia GDP and Population, 2018-2019 ($)
Figure 114: Malaysia GDP – Composition of 2018, By Sector of Origin
Figure 115: Malaysia Export and Import Value & Volume, 2018-2019 ($)
Figure 116: Hong Kong Dodecanedioic Acid Market Value & Volume, 2021-2026 ($)
Figure 117: Hong Kong GDP and Population, 2018-2019 ($)
Figure 118: Hong Kong GDP – Composition of 2018, By Sector of Origin
Figure 119: Hong Kong Export and Import Value & Volume, 2018-2019 ($)
Figure 120: Middle East & Africa Dodecanedioic Acid Market Middle East & Africa 3D Printing Market Value & Volume, 2021-2026 ($)
Figure 121: Russia Dodecanedioic Acid Market Value & Volume, 2021-2026 ($)
Figure 122: Russia GDP and Population, 2018-2019 ($)
Figure 123: Russia GDP – Composition of 2018, By Sector of Origin
Figure 124: Russia Export and Import Value & Volume, 2018-2019 ($)
Figure 125: Israel Dodecanedioic Acid Market Value & Volume, 2021-2026 ($)
Figure 126: Israel GDP and Population, 2018-2019 ($)
Figure 127: Israel GDP – Composition of 2018, By Sector of Origin
Figure 128: Israel Export and Import Value & Volume, 2018-2019 ($)
Figure 129: Entropy Share, By Strategies, 2018-2019* (%)Dodecanedioic Acid Market
Figure 130: Developments, 2018-2019*Dodecanedioic Acid Market
Figure 131: Company 1 Dodecanedioic Acid Market Net Revenue, By Years, 2018-2019* ($)
Figure 132: Company 1 Dodecanedioic Acid Market Net Revenue Share, By Business segments, 2018 (%)
Figure 133: Company 1 Dodecanedioic Acid Market Net Sales Share, By Geography, 2018 (%)
Figure 134: Company 2 Dodecanedioic Acid Market Net Revenue, By Years, 2018-2019* ($)
Figure 135: Company 2 Dodecanedioic Acid Market Net Revenue Share, By Business segments, 2018 (%)
Figure 136: Company 2 Dodecanedioic Acid Market Net Sales Share, By Geography, 2018 (%)
Figure 137: Company 3 Dodecanedioic Acid Market Net Revenue, By Years, 2018-2019* ($)
Figure 138: Company 3 Dodecanedioic Acid Market Net Revenue Share, By Business segments, 2018 (%)
Figure 139: Company 3 Dodecanedioic Acid Market Net Sales Share, By Geography, 2018 (%)
Figure 140: Company 4 Dodecanedioic Acid Market Net Revenue, By Years, 2018-2019* ($)
Figure 141: Company 4 Dodecanedioic Acid Market Net Revenue Share, By Business segments, 2018 (%)
Figure 142: Company 4 Dodecanedioic Acid Market Net Sales Share, By Geography, 2018 (%)
Figure 143: Company 5 Dodecanedioic Acid Market Net Revenue, By Years, 2018-2019* ($)
Figure 144: Company 5 Dodecanedioic Acid Market Net Revenue Share, By Business segments, 2018 (%)
Figure 145: Company 5 Dodecanedioic Acid Market Net Sales Share, By Geography, 2018 (%)
Figure 146: Company 6 Dodecanedioic Acid Market Net Revenue, By Years, 2018-2019* ($)
Figure 147: Company 6 Dodecanedioic Acid Market Net Revenue Share, By Business segments, 2018 (%)
Figure 148: Company 6 Dodecanedioic Acid Market Net Sales Share, By Geography, 2018 (%)
Figure 149: Company 7 Dodecanedioic Acid Market Net Revenue, By Years, 2018-2019* ($)
Figure 150: Company 7 Dodecanedioic Acid Market Net Revenue Share, By Business segments, 2018 (%)
Figure 151: Company 7 Dodecanedioic Acid Market Net Sales Share, By Geography, 2018 (%)
Figure 152: Company 8 Dodecanedioic Acid Market Net Revenue, By Years, 2018-2019* ($)
Figure 153: Company 8 Dodecanedioic Acid Market Net Revenue Share, By Business segments, 2018 (%)
Figure 154: Company 8 Dodecanedioic Acid Market Net Sales Share, By Geography, 2018 (%)
Figure 155: Company 9 Dodecanedioic Acid Market Net Revenue, By Years, 2018-2019* ($)
Figure 156: Company 9 Dodecanedioic Acid Market Net Revenue Share, By Business segments, 2018 (%)
Figure 157: Company 9 Dodecanedioic Acid Market Net Sales Share, By Geography, 2018 (%)
Figure 158: Company 10 Dodecanedioic Acid Market Net Revenue, By Years, 2018-2019* ($)
Figure 159: Company 10 Dodecanedioic Acid Market Net Revenue Share, By Business segments, 2018 (%)
Figure 160: Company 10 Dodecanedioic Acid Market Net Sales Share, By Geography, 2018 (%)
Figure 161: Company 11 Dodecanedioic Acid Market Net Revenue, By Years, 2018-2019* ($)
Figure 162: Company 11 Dodecanedioic Acid Market Net Revenue Share, By Business segments, 2018 (%)
Figure 163: Company 11 Dodecanedioic Acid Market Net Sales Share, By Geography, 2018 (%)
Figure 164: Company 12 Dodecanedioic Acid Market Net Revenue, By Years, 2018-2019* ($)
Figure 165: Company 12 Dodecanedioic Acid Market Net Revenue Share, By Business segments, 2018 (%)
Figure 166: Company 12 Dodecanedioic Acid Market Net Sales Share, By Geography, 2018 (%)
Figure 167: Company 13 Dodecanedioic Acid Market Net Revenue, By Years, 2018-2019* ($)
Figure 168: Company 13 Dodecanedioic Acid Market Net Revenue Share, By Business segments, 2018 (%)
Figure 169: Company 13 Dodecanedioic Acid Market Net Sales Share, By Geography, 2018 (%)
Figure 170: Company 14 Dodecanedioic Acid Market Net Revenue, By Years, 2018-2019* ($)
Figure 171: Company 14 Dodecanedioic Acid Market Net Revenue Share, By Business segments, 2018 (%)
Figure 172: Company 14 Dodecanedioic Acid Market Net Sales Share, By Geography, 2018 (%)
Figure 173: Company 15 Dodecanedioic Acid Market Net Revenue, By Years, 2018-2019* ($)
Figure 174: Company 15 Dodecanedioic Acid Market Net Revenue Share, By Business segments, 2018 (%)
Figure 175: Company 15 Dodecanedioic Acid Market Net Sales Share, By Geography, 2018 (%)