 Email
Email Print
Print


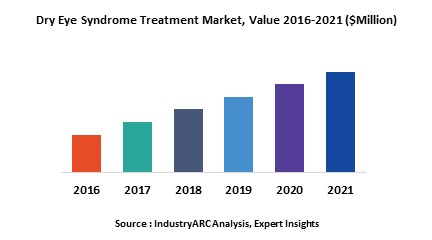
Dry Eye Syndrome Treatment Market - Forecast(2024 - 2030)
Eyes secrete fluid continuously, also known as tear film, which cover the eyes and remain stable between each blink and prevent the eyes from becoming dry. This tear film keeps the eyes clear with stress-free vision. Dry eye syndrome is a disease in which there is high tear film evaporation or low tear production thus eye is unable to maintain a healthy coating of tears. So, a healthy tear film on the eye is essential for good vision.
Population affected with dry eye syndrome is increasing because of many underlying causes of the disease. It is more frequent in old age; young generation is also affected by the disease because of change in lifestyle, poor dietary intake, more habituated towards mobiles and laptops, frequent travelling and rising pollution levels. Malnutrition resulting from vitamin A deficiency is also common cause of dry eye syndrome in some parts of the world. Other common causes include dry environment or workplace, medication, complications arising from eye surgeries and as a result of autoimmune disorders.
Dry eye syndrome treatment can be done by knowing the underlying cause of disease. Various methods include lubricant treatments, anti-inflammatory treatments, autologous serum eye drops and surgery etc.
There are various key factors driving the growth of dry eye syndrome treatment market like increasing prevalence of the disease, increasing awareness about the disease, demand for better treatment options, impact of other diseases like Diabetes, Sjogren's syndrome, Vitamin A deficiency, Lupus scleroderma and Rheumatoid arthritis. Other drivers include focus towards development of novel technologies and contribution of non-governmental organizations towards the disease.
This report provides information on dry eye syndrome treatment market size for the year 2014-2016, and forecast of the same for year 2021. It also focuses on market drivers, challenges, restraints, market dynamics, growth indicators, competitive landscape, potential growth opportunities and other key aspects with respect to dry eye syndrome.
The prevalence of the disease is high in APAC region compared to USA and Europe. China and India are potential markets for dry eye syndrome due to high prevalence of the disease, growth in the market for the disease is expected due to growing population, environmental factors and lack of awareness. USA and Europe have better treatment options and high awareness about the disease and they remain good market for dry eye syndrome.
This report of dry eye syndrome treatment market is segregated on the basis of treatment type and regional market as follows:
- Dry eye syndrome treatment market is segmented based on the available treatments which include major treatment namely: Lubricant Eye Drops, Anti-inflammatory Drugs, autologous Serum Eye Drops and surgery
- This report has been further segmented into major regions, which include detailed analysis of each region such as: North America, Europe, Asia-Pacific (APAC), and Rest of the World (RoW) covering all the major country level markets in each of the region
Sample Companies Profiled in this Report are:
- Novartis AG
- Allergan Inc.
- Otsuka Holdings Co. Ltd.
- Santen Pharmaceutical Co. Ltd.
- Bausch & Lomb Incorporated
- 10+
1. Dry Eye Syndrome Treatment Market - Overview
1.1. Definitions and Scope
2. Dry Eye Syndrome Treatment Market - Executive summary
2.1. Market Revenue, Market Size and Key Trends by Company
2.2. Key Trends by type of Application
2.3. Key Trends segmented by Geography
3. Dry Eye Syndrome Treatment Market
3.1. Comparative analysis
3.1.1. Product Benchmarking - Top 10 companies
3.1.2. Top 5 Financials Analysis
3.1.3. Market Value split by Top 10 companies
3.1.4. Patent Analysis - Top 10 companies
3.1.5. Pricing Analysis
4. Dry Eye Syndrome Treatment Market – Startup companies Scenario Premium
4.1. Top 10 startup company Analysis by
4.1.1. Investment
4.1.2. Revenue
4.1.3. Market Shares
4.1.4. Market Size and Application Analysis
4.1.5. Venture Capital and Funding Scenario
5. Dry Eye Syndrome Treatment Market – Industry Market Entry Scenario Premium
5.1. Regulatory Framework Overview
5.2. New Business and Ease of Doing business index
5.3. Case studies of successful ventures
5.4. Customer Analysis – Top 10 companies
6. Dry Eye Syndrome Treatment Market Forces
6.1. Drivers
6.2. Constraints
6.3. Challenges
6.4. Porters five force model
6.4.1. Bargaining power of suppliers
6.4.2. Bargaining powers of customers
6.4.3. Threat of new entrants
6.4.4. Rivalry among existing players
6.4.5. Threat of substitutes
7. Dry Eye Syndrome Treatment Market -Strategic analysis
7.1. Value chain analysis
7.2. Opportunities analysis
7.3. Product life cycle
7.4. Suppliers and distributors Market Share
8. Dry Eye Syndrome Treatment Market – By Treatment type (Market Size -$Million / $Billion)
8.1. Market Size and Market Share Analysis
8.2. Application Revenue and Trend Research
8.3. Product Segment Analysis
8.3.1. Lubricant Eye Drops
8.3.2. Anti-inflammatory Drugs
8.3.3. Surgery
8.3.4. Others
9. Dry Eye Syndrome Treatment - By Geography (Market Size -$Million / $Billion)
9.1. Dry Eye Syndrome Treatment Market - North America Segment Research
9.2. North America Market Research (Million / $Billion)
9.2.1. Segment type Size and Market Size Analysis
9.2.2. Revenue and Trends
9.2.3. Application Revenue and Trends by type of Application
9.2.4. Company Revenue and Product Analysis
9.2.5. North America Product type and Application Market Size
9.2.5.1. U.S.
9.2.5.2. Canada
9.2.5.3. Mexico
9.2.5.4. Rest of North America
9.3. Dry Eye Syndrome Treatment - South America Segment Research
9.4. South America Market Research (Market Size -$Million / $Billion)
9.4.1. Segment type Size and Market Size Analysis
9.4.2. Revenue and Trends
9.4.3. Application Revenue and Trends by type of Application
9.4.4. Company Revenue and Product Analysis
9.4.5. South America Product type and Application Market Size
9.4.5.1. Brazil
9.4.5.2. Venezuela
9.4.5.3. Argentina
9.4.5.4. Ecuador
9.4.5.5. Peru
9.4.5.6. Colombia
9.4.5.7. Costa Rica
9.4.5.8. Rest of South America
9.5. Dry Eye Syndrome Treatment - Europe Segment Research
9.6. Europe Market Research (Market Size -$Million / $Billion)
9.6.1. Segment type Size and Market Size Analysis
9.6.2. Revenue and Trends
9.6.3. Application Revenue and Trends by type of Application
9.6.4. Company Revenue and Product Analysis
9.6.5. Europe Segment Product type and Application Market Size
9.6.5.1. U.K
9.6.5.2. Germany
9.6.5.3. Italy
9.6.5.4. France
9.6.5.5. Netherlands
9.6.5.6. Belgium
9.6.5.7. Spain
9.6.5.8. Denmark
9.6.5.9. Rest of Europe
9.7. Dry Eye Syndrome Treatment – APAC Segment Research
9.8. APAC Market Research (Market Size -$Million / $Billion)
9.8.1. Segment type Size and Market Size Analysis
9.8.2. Revenue and Trends
9.8.3. Application Revenue and Trends by type of Application
9.8.4. Company Revenue and Product Analysis
9.8.5. APAC Segment – Product type and Application Market Size
9.8.5.1. China
9.8.5.2. Australia
9.8.5.3. Japan
9.8.5.4. South Korea
9.8.5.5. India
9.8.5.6. Taiwan
9.8.5.7. Malaysia
10. Dry Eye Syndrome Treatment Market - Entropy
10.1. New product launches
10.2. M&A's, collaborations, JVs and partnerships
11. Dry Eye Syndrome Treatment Market – Industry / Segment Competition landscape Premium
11.1. Market Share Analysis
11.1.1. Market Share by Country- Top companies
11.1.2. Market Share by Region- Top 10 companies
11.1.3. Market Share by type of Application – Top 10 companies
11.1.4. Market Share by type of Product / Product category- Top 10 companies
11.1.5. Market Share at global level- Top 10 companies
11.1.6. Best Practises for companies
12. Dry Eye Syndrome Treatment Market – Key Company List by Country Premium
13. Dry Eye Syndrome Treatment Market Company Analysis
13.1. Market Share, Company Revenue, Products, M&A, Developments
13.2. Novartis A.G
13.3. Allergan Inc.
13.4. Otsuka Holdings Co.Ltd
13.5. Santen Pharmaceutical Co.Ltd
13.6. Bausch & Lomb Incorporated
13.7. Merck Sharp & Dohme Corp.
13.8. Shire
13.9. Kissei Pharmaceutical Co., Ltd.
13.10. Dong-A ST Co., Ltd.
13.11. Kissei Pharmaceutical Co., Ltd.
13.12. Company 11
13.13. Company 12 and more
"*Financials would be provided on a best efforts basis for private companies"
14. Dry Eye Syndrome Treatment Market -Appendix
14.1. Abbreviations
14.2. Sources
15. Dry Eye Syndrome Treatment Market -Methodology Premium
15.1. Research Methodology
15.1.1. Company Expert Interviews
15.1.2. Industry Databases
15.1.3. Associations
15.1.4. Company News
15.1.5. Company Annual Reports
15.1.6. Application Trends
15.1.7. New Products and Product database
15.1.8. Company Transcripts
15.1.9. R&D Trends
15.1.10. Key Opinion Leaders Interviews
15.1.11. Supply and Demand Trends
List of Tables:
Table 1: Dry Eye Syndrome Treatment Market Overview 2021-2026
Table 2: Dry Eye Syndrome Treatment Market Leader Analysis 2018-2019 (US$)
Table 3: Dry Eye Syndrome Treatment Market Product Analysis 2018-2019 (US$)
Table 4: Dry Eye Syndrome Treatment Market End User Analysis 2018-2019 (US$)
Table 5: Dry Eye Syndrome Treatment Market Patent Analysis 2013-2018* (US$)
Table 6: Dry Eye Syndrome Treatment Market Financial Analysis 2018-2019 (US$)
Table 7: Dry Eye Syndrome Treatment Market Driver Analysis 2018-2019 (US$)
Table 8: Dry Eye Syndrome Treatment Market Challenges Analysis 2018-2019 (US$)
Table 9: Dry Eye Syndrome Treatment Market Constraint Analysis 2018-2019 (US$)
Table 10: Dry Eye Syndrome Treatment Market Supplier Bargaining Power Analysis 2018-2019 (US$)
Table 11: Dry Eye Syndrome Treatment Market Buyer Bargaining Power Analysis 2018-2019 (US$)
Table 12: Dry Eye Syndrome Treatment Market Threat of Substitutes Analysis 2018-2019 (US$)
Table 13: Dry Eye Syndrome Treatment Market Threat of New Entrants Analysis 2018-2019 (US$)
Table 14: Dry Eye Syndrome Treatment Market Degree of Competition Analysis 2018-2019 (US$)
Table 15: Dry Eye Syndrome Treatment Market Value Chain Analysis 2018-2019 (US$)
Table 16: Dry Eye Syndrome Treatment Market Pricing Analysis 2021-2026 (US$)
Table 17: Dry Eye Syndrome Treatment Market Opportunities Analysis 2021-2026 (US$)
Table 18: Dry Eye Syndrome Treatment Market Product Life Cycle Analysis 2021-2026 (US$)
Table 19: Dry Eye Syndrome Treatment Market Supplier Analysis 2018-2019 (US$)
Table 20: Dry Eye Syndrome Treatment Market Distributor Analysis 2018-2019 (US$)
Table 21: Dry Eye Syndrome Treatment Market Trend Analysis 2018-2019 (US$)
Table 22: Dry Eye Syndrome Treatment Market Size 2018 (US$)
Table 23: Dry Eye Syndrome Treatment Market Forecast Analysis 2021-2026 (US$)
Table 24: Dry Eye Syndrome Treatment Market Sales Forecast Analysis 2021-2026 (Units)
Table 25: Dry Eye Syndrome Treatment Market, Revenue & Volume, By Treatment type, 2021-2026 ($)
Table 26: Dry Eye Syndrome Treatment Market By Treatment type, Revenue & Volume, By Lubricant Eye Drops, 2021-2026 ($)
Table 27: Dry Eye Syndrome Treatment Market By Treatment type, Revenue & Volume, By Anti-inflammatory Drugs, 2021-2026 ($)
Table 28: Dry Eye Syndrome Treatment Market By Treatment type, Revenue & Volume, By Surgery, 2021-2026 ($)
Table 29: North America Dry Eye Syndrome Treatment Market, Revenue & Volume, By Treatment type, 2021-2026 ($)
Table 30: South america Dry Eye Syndrome Treatment Market, Revenue & Volume, By Treatment type, 2021-2026 ($)
Table 31: Europe Dry Eye Syndrome Treatment Market, Revenue & Volume, By Treatment type, 2021-2026 ($)
Table 32: APAC Dry Eye Syndrome Treatment Market, Revenue & Volume, By Treatment type, 2021-2026 ($)
Table 33: Middle East & Africa Dry Eye Syndrome Treatment Market, Revenue & Volume, By Treatment type, 2021-2026 ($)
Table 34: Russia Dry Eye Syndrome Treatment Market, Revenue & Volume, By Treatment type, 2021-2026 ($)
Table 35: Israel Dry Eye Syndrome Treatment Market, Revenue & Volume, By Treatment type, 2021-2026 ($)
Table 36: Top Companies 2018 (US$)Dry Eye Syndrome Treatment Market, Revenue & Volume
Table 37: Product Launch 2018-2019Dry Eye Syndrome Treatment Market, Revenue & Volume
Table 38: Mergers & Acquistions 2018-2019Dry Eye Syndrome Treatment Market, Revenue & Volume
List of Figures:
Figure 1: Overview of Dry Eye Syndrome Treatment Market 2021-2026
Figure 2: Market Share Analysis for Dry Eye Syndrome Treatment Market 2018 (US$)
Figure 3: Product Comparison in Dry Eye Syndrome Treatment Market 2018-2019 (US$)
Figure 4: End User Profile for Dry Eye Syndrome Treatment Market 2018-2019 (US$)
Figure 5: Patent Application and Grant in Dry Eye Syndrome Treatment Market 2013-2018* (US$)
Figure 6: Top 5 Companies Financial Analysis in Dry Eye Syndrome Treatment Market 2018-2019 (US$)
Figure 7: Market Entry Strategy in Dry Eye Syndrome Treatment Market 2018-2019
Figure 8: Ecosystem Analysis in Dry Eye Syndrome Treatment Market 2018
Figure 9: Average Selling Price in Dry Eye Syndrome Treatment Market 2021-2026
Figure 10: Top Opportunites in Dry Eye Syndrome Treatment Market 2018-2019
Figure 11: Market Life Cycle Analysis in Dry Eye Syndrome Treatment Market
Figure 12: GlobalBy Treatment typeDry Eye Syndrome Treatment Market Revenue, 2021-2026 ($)
Figure 13: Global Dry Eye Syndrome Treatment Market - By Geography
Figure 14: Global Dry Eye Syndrome Treatment Market Value & Volume, By Geography, 2021-2026 ($)
Figure 15: Global Dry Eye Syndrome Treatment Market CAGR, By Geography, 2021-2026 (%)
Figure 16: North America Dry Eye Syndrome Treatment Market Value & Volume, 2021-2026 ($)
Figure 17: US Dry Eye Syndrome Treatment Market Value & Volume, 2021-2026 ($)
Figure 18: US GDP and Population, 2018-2019 ($)
Figure 19: US GDP – Composition of 2018, By Sector of Origin
Figure 20: US Export and Import Value & Volume, 2018-2019 ($)
Figure 21: Canada Dry Eye Syndrome Treatment Market Value & Volume, 2021-2026 ($)
Figure 22: Canada GDP and Population, 2018-2019 ($)
Figure 23: Canada GDP – Composition of 2018, By Sector of Origin
Figure 24: Canada Export and Import Value & Volume, 2018-2019 ($)
Figure 25: Mexico Dry Eye Syndrome Treatment Market Value & Volume, 2021-2026 ($)
Figure 26: Mexico GDP and Population, 2018-2019 ($)
Figure 27: Mexico GDP – Composition of 2018, By Sector of Origin
Figure 28: Mexico Export and Import Value & Volume, 2018-2019 ($)
Figure 29: South America Dry Eye Syndrome Treatment Market Value & Volume, 2021-2026 ($)
Figure 30: Brazil Dry Eye Syndrome Treatment Market Value & Volume, 2021-2026 ($)
Figure 31: Brazil GDP and Population, 2018-2019 ($)
Figure 32: Brazil GDP – Composition of 2018, By Sector of Origin
Figure 33: Brazil Export and Import Value & Volume, 2018-2019 ($)
Figure 34: Venezuela Dry Eye Syndrome Treatment Market Value & Volume, 2021-2026 ($)
Figure 35: Venezuela GDP and Population, 2018-2019 ($)
Figure 36: Venezuela GDP – Composition of 2018, By Sector of Origin
Figure 37: Venezuela Export and Import Value & Volume, 2018-2019 ($)
Figure 38: Argentina Dry Eye Syndrome Treatment Market Value & Volume, 2021-2026 ($)
Figure 39: Argentina GDP and Population, 2018-2019 ($)
Figure 40: Argentina GDP – Composition of 2018, By Sector of Origin
Figure 41: Argentina Export and Import Value & Volume, 2018-2019 ($)
Figure 42: Ecuador Dry Eye Syndrome Treatment Market Value & Volume, 2021-2026 ($)
Figure 43: Ecuador GDP and Population, 2018-2019 ($)
Figure 44: Ecuador GDP – Composition of 2018, By Sector of Origin
Figure 45: Ecuador Export and Import Value & Volume, 2018-2019 ($)
Figure 46: Peru Dry Eye Syndrome Treatment Market Value & Volume, 2021-2026 ($)
Figure 47: Peru GDP and Population, 2018-2019 ($)
Figure 48: Peru GDP – Composition of 2018, By Sector of Origin
Figure 49: Peru Export and Import Value & Volume, 2018-2019 ($)
Figure 50: Colombia Dry Eye Syndrome Treatment Market Value & Volume, 2021-2026 ($)
Figure 51: Colombia GDP and Population, 2018-2019 ($)
Figure 52: Colombia GDP – Composition of 2018, By Sector of Origin
Figure 53: Colombia Export and Import Value & Volume, 2018-2019 ($)
Figure 54: Costa Rica Dry Eye Syndrome Treatment Market Value & Volume, 2021-2026 ($)
Figure 55: Costa Rica GDP and Population, 2018-2019 ($)
Figure 56: Costa Rica GDP – Composition of 2018, By Sector of Origin
Figure 57: Costa Rica Export and Import Value & Volume, 2018-2019 ($)
Figure 58: Europe Dry Eye Syndrome Treatment Market Value & Volume, 2021-2026 ($)
Figure 59: U.K Dry Eye Syndrome Treatment Market Value & Volume, 2021-2026 ($)
Figure 60: U.K GDP and Population, 2018-2019 ($)
Figure 61: U.K GDP – Composition of 2018, By Sector of Origin
Figure 62: U.K Export and Import Value & Volume, 2018-2019 ($)
Figure 63: Germany Dry Eye Syndrome Treatment Market Value & Volume, 2021-2026 ($)
Figure 64: Germany GDP and Population, 2018-2019 ($)
Figure 65: Germany GDP – Composition of 2018, By Sector of Origin
Figure 66: Germany Export and Import Value & Volume, 2018-2019 ($)
Figure 67: Italy Dry Eye Syndrome Treatment Market Value & Volume, 2021-2026 ($)
Figure 68: Italy GDP and Population, 2018-2019 ($)
Figure 69: Italy GDP – Composition of 2018, By Sector of Origin
Figure 70: Italy Export and Import Value & Volume, 2018-2019 ($)
Figure 71: France Dry Eye Syndrome Treatment Market Value & Volume, 2021-2026 ($)
Figure 72: France GDP and Population, 2018-2019 ($)
Figure 73: France GDP – Composition of 2018, By Sector of Origin
Figure 74: France Export and Import Value & Volume, 2018-2019 ($)
Figure 75: Netherlands Dry Eye Syndrome Treatment Market Value & Volume, 2021-2026 ($)
Figure 76: Netherlands GDP and Population, 2018-2019 ($)
Figure 77: Netherlands GDP – Composition of 2018, By Sector of Origin
Figure 78: Netherlands Export and Import Value & Volume, 2018-2019 ($)
Figure 79: Belgium Dry Eye Syndrome Treatment Market Value & Volume, 2021-2026 ($)
Figure 80: Belgium GDP and Population, 2018-2019 ($)
Figure 81: Belgium GDP – Composition of 2018, By Sector of Origin
Figure 82: Belgium Export and Import Value & Volume, 2018-2019 ($)
Figure 83: Spain Dry Eye Syndrome Treatment Market Value & Volume, 2021-2026 ($)
Figure 84: Spain GDP and Population, 2018-2019 ($)
Figure 85: Spain GDP – Composition of 2018, By Sector of Origin
Figure 86: Spain Export and Import Value & Volume, 2018-2019 ($)
Figure 87: Denmark Dry Eye Syndrome Treatment Market Value & Volume, 2021-2026 ($)
Figure 88: Denmark GDP and Population, 2018-2019 ($)
Figure 89: Denmark GDP – Composition of 2018, By Sector of Origin
Figure 90: Denmark Export and Import Value & Volume, 2018-2019 ($)
Figure 91: APAC Dry Eye Syndrome Treatment Market Value & Volume, 2021-2026 ($)
Figure 92: China Dry Eye Syndrome Treatment Market Value & Volume, 2021-2026
Figure 93: China GDP and Population, 2018-2019 ($)
Figure 94: China GDP – Composition of 2018, By Sector of Origin
Figure 95: China Export and Import Value & Volume, 2018-2019 ($)Dry Eye Syndrome Treatment Market China Export and Import Value & Volume, 2018-2019 ($)
Figure 96: Australia Dry Eye Syndrome Treatment Market Value & Volume, 2021-2026 ($)
Figure 97: Australia GDP and Population, 2018-2019 ($)
Figure 98: Australia GDP – Composition of 2018, By Sector of Origin
Figure 99: Australia Export and Import Value & Volume, 2018-2019 ($)
Figure 100: South Korea Dry Eye Syndrome Treatment Market Value & Volume, 2021-2026 ($)
Figure 101: South Korea GDP and Population, 2018-2019 ($)
Figure 102: South Korea GDP – Composition of 2018, By Sector of Origin
Figure 103: South Korea Export and Import Value & Volume, 2018-2019 ($)
Figure 104: India Dry Eye Syndrome Treatment Market Value & Volume, 2021-2026 ($)
Figure 105: India GDP and Population, 2018-2019 ($)
Figure 106: India GDP – Composition of 2018, By Sector of Origin
Figure 107: India Export and Import Value & Volume, 2018-2019 ($)
Figure 108: Taiwan Dry Eye Syndrome Treatment Market Value & Volume, 2021-2026 ($)
Figure 109: Taiwan GDP and Population, 2018-2019 ($)
Figure 110: Taiwan GDP – Composition of 2018, By Sector of Origin
Figure 111: Taiwan Export and Import Value & Volume, 2018-2019 ($)
Figure 112: Malaysia Dry Eye Syndrome Treatment Market Value & Volume, 2021-2026 ($)
Figure 113: Malaysia GDP and Population, 2018-2019 ($)
Figure 114: Malaysia GDP – Composition of 2018, By Sector of Origin
Figure 115: Malaysia Export and Import Value & Volume, 2018-2019 ($)
Figure 116: Hong Kong Dry Eye Syndrome Treatment Market Value & Volume, 2021-2026 ($)
Figure 117: Hong Kong GDP and Population, 2018-2019 ($)
Figure 118: Hong Kong GDP – Composition of 2018, By Sector of Origin
Figure 119: Hong Kong Export and Import Value & Volume, 2018-2019 ($)
Figure 120: Middle East & Africa Dry Eye Syndrome Treatment Market Middle East & Africa 3D Printing Market Value & Volume, 2021-2026 ($)
Figure 121: Russia Dry Eye Syndrome Treatment Market Value & Volume, 2021-2026 ($)
Figure 122: Russia GDP and Population, 2018-2019 ($)
Figure 123: Russia GDP – Composition of 2018, By Sector of Origin
Figure 124: Russia Export and Import Value & Volume, 2018-2019 ($)
Figure 125: Israel Dry Eye Syndrome Treatment Market Value & Volume, 2021-2026 ($)
Figure 126: Israel GDP and Population, 2018-2019 ($)
Figure 127: Israel GDP – Composition of 2018, By Sector of Origin
Figure 128: Israel Export and Import Value & Volume, 2018-2019 ($)
Figure 129: Entropy Share, By Strategies, 2018-2019* (%)Dry Eye Syndrome Treatment Market
Figure 130: Developments, 2018-2019*Dry Eye Syndrome Treatment Market
Figure 131: Company 1 Dry Eye Syndrome Treatment Market Net Revenue, By Years, 2018-2019* ($)
Figure 132: Company 1 Dry Eye Syndrome Treatment Market Net Revenue Share, By Business segments, 2018 (%)
Figure 133: Company 1 Dry Eye Syndrome Treatment Market Net Sales Share, By Geography, 2018 (%)
Figure 134: Company 2 Dry Eye Syndrome Treatment Market Net Revenue, By Years, 2018-2019* ($)
Figure 135: Company 2 Dry Eye Syndrome Treatment Market Net Revenue Share, By Business segments, 2018 (%)
Figure 136: Company 2 Dry Eye Syndrome Treatment Market Net Sales Share, By Geography, 2018 (%)
Figure 137: Company 3 Dry Eye Syndrome Treatment Market Net Revenue, By Years, 2018-2019* ($)
Figure 138: Company 3 Dry Eye Syndrome Treatment Market Net Revenue Share, By Business segments, 2018 (%)
Figure 139: Company 3 Dry Eye Syndrome Treatment Market Net Sales Share, By Geography, 2018 (%)
Figure 140: Company 4 Dry Eye Syndrome Treatment Market Net Revenue, By Years, 2018-2019* ($)
Figure 141: Company 4 Dry Eye Syndrome Treatment Market Net Revenue Share, By Business segments, 2018 (%)
Figure 142: Company 4 Dry Eye Syndrome Treatment Market Net Sales Share, By Geography, 2018 (%)
Figure 143: Company 5 Dry Eye Syndrome Treatment Market Net Revenue, By Years, 2018-2019* ($)
Figure 144: Company 5 Dry Eye Syndrome Treatment Market Net Revenue Share, By Business segments, 2018 (%)
Figure 145: Company 5 Dry Eye Syndrome Treatment Market Net Sales Share, By Geography, 2018 (%)
Figure 146: Company 6 Dry Eye Syndrome Treatment Market Net Revenue, By Years, 2018-2019* ($)
Figure 147: Company 6 Dry Eye Syndrome Treatment Market Net Revenue Share, By Business segments, 2018 (%)
Figure 148: Company 6 Dry Eye Syndrome Treatment Market Net Sales Share, By Geography, 2018 (%)
Figure 149: Company 7 Dry Eye Syndrome Treatment Market Net Revenue, By Years, 2018-2019* ($)
Figure 150: Company 7 Dry Eye Syndrome Treatment Market Net Revenue Share, By Business segments, 2018 (%)
Figure 151: Company 7 Dry Eye Syndrome Treatment Market Net Sales Share, By Geography, 2018 (%)
Figure 152: Company 8 Dry Eye Syndrome Treatment Market Net Revenue, By Years, 2018-2019* ($)
Figure 153: Company 8 Dry Eye Syndrome Treatment Market Net Revenue Share, By Business segments, 2018 (%)
Figure 154: Company 8 Dry Eye Syndrome Treatment Market Net Sales Share, By Geography, 2018 (%)
Figure 155: Company 9 Dry Eye Syndrome Treatment Market Net Revenue, By Years, 2018-2019* ($)
Figure 156: Company 9 Dry Eye Syndrome Treatment Market Net Revenue Share, By Business segments, 2018 (%)
Figure 157: Company 9 Dry Eye Syndrome Treatment Market Net Sales Share, By Geography, 2018 (%)
Figure 158: Company 10 Dry Eye Syndrome Treatment Market Net Revenue, By Years, 2018-2019* ($)
Figure 159: Company 10 Dry Eye Syndrome Treatment Market Net Revenue Share, By Business segments, 2018 (%)
Figure 160: Company 10 Dry Eye Syndrome Treatment Market Net Sales Share, By Geography, 2018 (%)
Figure 161: Company 11 Dry Eye Syndrome Treatment Market Net Revenue, By Years, 2018-2019* ($)
Figure 162: Company 11 Dry Eye Syndrome Treatment Market Net Revenue Share, By Business segments, 2018 (%)
Figure 163: Company 11 Dry Eye Syndrome Treatment Market Net Sales Share, By Geography, 2018 (%)
Figure 164: Company 12 Dry Eye Syndrome Treatment Market Net Revenue, By Years, 2018-2019* ($)
Figure 165: Company 12 Dry Eye Syndrome Treatment Market Net Revenue Share, By Business segments, 2018 (%)
Figure 166: Company 12 Dry Eye Syndrome Treatment Market Net Sales Share, By Geography, 2018 (%)
Figure 167: Company 13 Dry Eye Syndrome Treatment Market Net Revenue, By Years, 2018-2019* ($)
Figure 168: Company 13 Dry Eye Syndrome Treatment Market Net Revenue Share, By Business segments, 2018 (%)
Figure 169: Company 13 Dry Eye Syndrome Treatment Market Net Sales Share, By Geography, 2018 (%)
Figure 170: Company 14 Dry Eye Syndrome Treatment Market Net Revenue, By Years, 2018-2019* ($)
Figure 171: Company 14 Dry Eye Syndrome Treatment Market Net Revenue Share, By Business segments, 2018 (%)
Figure 172: Company 14 Dry Eye Syndrome Treatment Market Net Sales Share, By Geography, 2018 (%)
Figure 173: Company 15 Dry Eye Syndrome Treatment Market Net Revenue, By Years, 2018-2019* ($)
Figure 174: Company 15 Dry Eye Syndrome Treatment Market Net Revenue Share, By Business segments, 2018 (%)
Figure 175: Company 15 Dry Eye Syndrome Treatment Market Net Sales Share, By Geography, 2018 (%)